 |
|
| |||
| Ohio Water Science Center |
By Andrew D. Ebner, David E. Straub, and Jonathan D. Lageman
ONLINE ONLY
This report is available below as an 85–page PDF for viewing and printing.
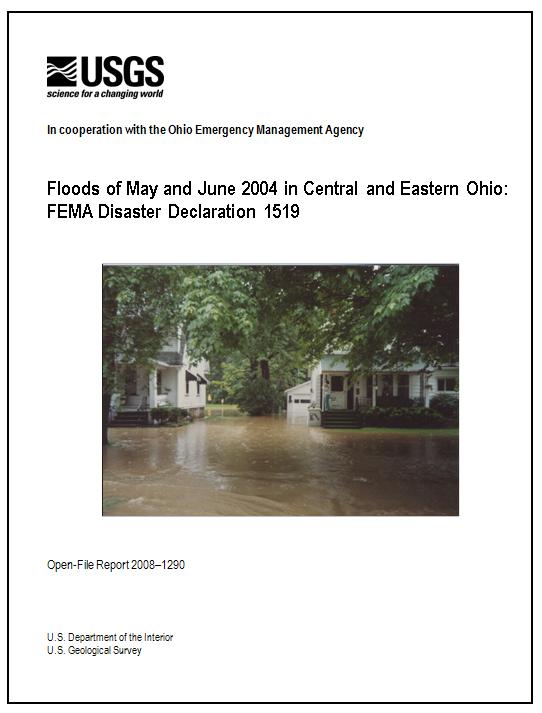
Several severe thunderstorms that passed through Ohio between May 17 and June 17, 2004, produced large amounts of rain in an already wet central and eastern Ohio, resulting in flooding in this region from May 18 to June 21, 2004. Record peak streamflow occurred at three U.S. Geological Survey (USGS) streamgages. Damages caused by the flooding resulting from these storms were severe enough that 25 counties in central and eastern Ohio were declared Federal disaster areas. In all, there were two storm- or flood-related deaths, 3,529 private structures damaged or destroyed, and an estimated $43 million in damages.
This report describes the meteorological factors that resulted in severe flooding in central and eastern Ohio between May 18 and June 21, 2004, and addresses the damages caused by the storms and flooding. Peak-stage, peak-streamflow, and recurrence-interval data are reported for selected USGS streamgages. Flood profiles determined by the USGS are presented for selected streams.
Abstract
Introduction
Antecedent Climatic Conditions
May 18–25, 2004, Flood
Storms of May 17–23, 2004
General Description of the May 18–25, 2004, Flood
Areal Distribution
Flood Stages, Streamflows, and Recurrence Intervals
June 9, 2004, Flood
Storms of June 9, 2004
General Description of the June 9, 2004, Flood
Areal Distribution
Flood Stages, Streamflows, and Recurrence Intervals
June 11–18, 2004, Flood
Storms of June 11–17, 2004
General Description of the June 11–18, 2004, Flood
Areal Distribution
Flood Stages, Streamflows, and Recurrence Intervals
Flood and Storm Damages Associated with FEMA-1519-DR
Summary
Acknowledgments
References Cited
Appendix 1. Details of Hydrologic and Hydraulic Analyses
1-A. West Fork Duck Creek near the Village of Belle Valley
1-B. Plum Creek near the City of Brunswick
1-C. West Branch Sunday Creek and West Branch Sunday Creek Tributary near the Village of Hemlock
1-D. East Branch Rocky River Tributary R9 near the City of North Royalton
1-E. Mud Brook Tributary 1C and Cuyahoga River Tributary 1A near the City of Stow
1–15. Maps showing:
1. Ohio counties declared disaster areas under FEMA declaration 1519.
2. Regionally averaged monthly total precipitation and percentage of
normal precipitation for the 10 climatic
regions of Ohio for A, March and B, April 2004.
3. Isohyetal map of 7-day rainfall totals in Ohio for May 17–23, 2004.
4. Locations of selected U.S. Geological Survey streamgages that are referred to in this report.
5. Selected areas of southeastern Ohio affected by flooding during May 18–25, 2004.
6. Selected areas of eastern Ohio affected by flooding during May 18–25, 2004.
7. Selected areas of northeastern Ohio affected by flooding during May 18–25, 2004.
8. Selected areas of northern Ohio affected by flooding during May 18–25, 2004.
9. Isohyetal map of 6-hour rainfall totals from 3:00 p.m. to 9:00 p.m. on June 9, 2004.
10. Selected areas of northern Ohio affected by flooding on June 9, 2004.
11. Isohyetal map of 7-day rainfall totals in Ohio for June 11–17, 2004.
12. Selected areas of eastern Ohio affected by flooding during June 11–17, 2004.
13. Selected areas of north-central Ohio affected by flooding during June 11–17, 2004.
14. Selected areas of southwestern, western, and central Ohio affected by flooding during June 11–17, 2004.
15. Selected areas of east-central Ohio affected by flooding during June 11–17, 2004.
1-A1–1-E1. Maps showing:
1–A1. Location of the West Fork Duck Creek study reach for the Village of Belle Valley, Ohio.
1–B1. Location of the Plum Creek study reach for the City of Brunswick, Ohio.
1–C1. Location of the West Branch Sunday Creek and West Branch Sunday Creek Tributary study reaches
for the Village of Hemlock, Ohio.
1–D1. Location of the East Branch Rocky River Tributary R9 study reach for the City of North Royalton, Ohio.
1–E1. Location of the Mud Brook Tributary 1C and Cuyahoga River Tributary 1A study reaches for the
City of Stow, Ohio.
1-A2. Graph showing flood profiles for West Fork Duck Creek near the Village of Belle
Valley for the 10-, 50-, 100-,
and 500-year-recurrence-interval floods.
1-A3. Photograph showing cross-section locations for flood profiles on West Fork
Duck Creek near the Village of
Belle Valley, Ohio.
1-B2. Graph showing flood profiles for Plum Creek near the City of Brunswick
for the 10-, 50-, 100-, and
500-year-recurrence-interval floods.
1-B3. Photograph showing cross-section locations for flood profiles on Plum Creek near the City of Brunswick, Ohio.
1-C2. Graph showing flood profiles for West Branch Sunday Creek near the Village
of Hemlock for the 10-, 50-, 100-,
and 500-year-recurrence-interval floods.
1-C3. Graph showing flood profiles for West Branch Sunday Creek Tributary near the
Village of Hemlock for the 10-,
50-, 100-, and 500-year-recurrence-interval floods.
1-C4. Photograph showing cross-section locations for flood profiles on
West Branch Sunday Creek near the Village of
Hemlock, Ohio.
1-C5. Photograph showing cross-section locations for flood profiles on
West Branch Sunday Creek Tributary near the
Village of Hemlock, Ohio.
1-D2. Graph showing flood profiles for East Branch Rocky River Tributary R9
near the City of North Royalton for the 10-,
50-, 100-, and 500-year- recurrence-interval floods.
1-D3. Photograph showing cross-section locations for flood profiles on East Branch Rocky River Tributary R9 near the
City of North Royalton, Ohio.
1-E2. Graph showing flood profiles for Mud Brook Tributary 1C near the City of Stow for the 10-, 50-, 100-, and
500-year-recurrence-interval floods.
1-E3. Graph showing flood profiles for Cuyahoga River Tributary 1A near the City of Stow for the 10-, 50-, 100-, and
500-year- recurrence-interval floods.
1-E4. Photograph showing cross-section locations for flood profiles on Mud Brook
Tributary 1C near the
City of Stow, Ohio.
1-E5. Photograph showing cross-section locations for flood profiles on Cuyahoga
River Tributary 1A near the
City of Stow, Ohio.
1. Precipitation totals and recurrence intervals for selected National Weather Service rain gages in Ohio for May 17–23, 2004.
2. Areas and streams affected by flooding during May 18–25, 2004.
3. Peak stages, peak streamflows, and estimated recurrence-interval ranges
at selected USGS streamgages in Ohio,
May 18–25, 2004.
4. Precipitation totals and recurrence intervals for selected Northeast Ohio
Regional Sewer District rain gages in Cuyahoga
County, Ohio, on June 9, 2004.
5. Areas and streams affected by flooding on June 9, 2004.
6. Peak stages, peak streamflows, and estimated recurrence-interval ranges
at selected USGS streamgages in Cuyahoga
County, Ohio, June 9, 2004.
7. Precipitation totals and recurrence intervals for selected National Weather Service rain gages in Ohio for June 11–17, 2004.
8. Areas and streams affected by flooding during June 11–18, 2004.
9. Peak stages, peak streamflows, and estimated recurrence-interval ranges
at selected USGS streamgages in Ohio,
June 11–18, 2004.
10. Damage estimates for Individual Assistance associated with Federal
Emergency Management Agency disaster declaration
FEMA–1519–DR.
11. Damage estimates for Public Assistance associated with Federal
Emergency Management Agency disaster declaration
FEMA–1519–DR.
1–1. Summary of existing FIS(s) for selected streams in disaster area FEMA–1519–DR.
1–2. Summary of the explanatory-variable values used in the regression equations
and the resulting 10-, 50-, 100-,
and 500-year flood-peak discharge estimates.
1–3. Summary of the hydraulic model version and analysis date for each of the studied stream reaches.
1–A1. Summary of hydraulic-structure solutions for the 10-, 50-, 100-, and 500-year
profiles of West Fork Duck Creek
near the Village of Belle Valley.
1–A2. Comparison of published coordinates to USGS-surveyed coordinates and
bench marks used in the study of Duck Creek
near the Village of Belle Valley.
1–B1. Summary of hydraulic-structure solutions for the 10-, 50-, 100-, and 500-year
profiles of Plum Creek near the
City of Brunswick.
1–B2. Comparison of published coordinates to USGS-surveyed coordinates and
bench marks used in the study of Plum Creek
near the City of Brunswick.
1–C1. Summary of hydraulic-structure solutions for the 10-, 50-, 100-, and 500-year
profiles of West Branch Sunday Creek
and West Branch Sunday Creek
Tributary near the Village of Hemlock.
1–C2. Comparison of published coordinates to USGS-surveyed coordinates and
bench marks used in the study of West Branch
Sunday Creek and West
Branch Sunday Creek Tributary near the Village of Hemlock.
1–D1. Summary of hydraulic-structure solutions for the 10-, 50-, 100-, and 500-year
profiles of East Branch Rocky River
Tributary R9 near the City of North Royalton.
1–D2. Comparison of published coordinates to USGS-surveyed coordinates and
bench marks used in the study of East Branch
Rocky River Tributary R9 near
the City of North Royalton.
1–E1. Summary of hydraulic-structure solutions for the 10-, 50-, 100-, and 500-year
profiles of Mud Brook Tributary 1C and
Cuyahoga River Tributary 1A near the City of Stow.
1–E2. Summary of the breakup of the modeled reach for Cuyahoga River Tributary 1A near the City of Stow.
1–E3. Comparison of published coordinates to USGS-surveyed coordinates and bench marks used in the study
of Mud Brook
Tributary 1C and Cuyahoga River Tributary 1A near the City of Stow.
This document is available in Portable Document Format (PDF)
To view and print report you will need to use Adobe Acrobat Reader (available as freeware)
Users with visual disabilities can visit Online conversion tools for Adobe PDF documents web page
Covers (front and inside front cover) (713 KB) – (8.5" by 11" paper)
Main report (pages i–vi and 1–34) (2.16 MB) – (8.5" by 11" paper)
Appendix 1 (pages 35–85) (8.90 MB) – (8.5" by 11" paper)
Suggested Citation:
Ebner, A.D., Straub, D.E., and Lageman, J.D., 2008, Floods of May and June 2004 in central and eastern Ohio—FEMA Disaster Declaration 1519: U.S. Geological Survey Open-File Report 2008–1290, 85 p.
For more information about USGS activities in Ohio, visit the USGS Ohio Water Science Center home page.
| AccessibilityFOIAPrivacyPolicies and Notices | |
 |
|