Skip Links

USGS - science for a changing world

Open-File Report 2008–1373

Monitoring Inland Storm Surge and Flooding From Hurricane Gustav in Louisiana, September 2008

By Benton D. McGee, Burl B. Goree, Roland W. Tollett, and Robert R. Mason, Jr.

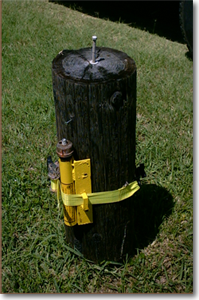
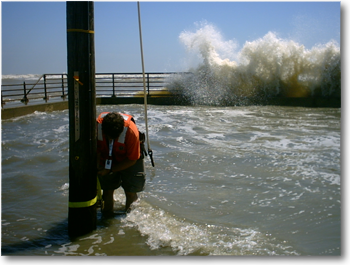
On August 29–31, 2008, the U.S. Geological Survey (USGS) deployed a mobile monitoring network consisting of 124 pressure transducers (sensors) (figs. 1, 2) at 80 sites over an area of about 4,200 square miles to record the timing, extent, and magnitude of inland hurricane storm surge and coastal flooding generated by Hurricane Gustav, which made landfall in southeastern Louisiana on September 1. One-hundred twenty-one sensors from 61 sites (fig. 3) were recovered. Thirty-seven sites from which sensors were recovered were in the New Orleans area, and the remaining 24 sites were distributed throughout southeastern Louisiana. Sites were categorized as surge (21), riverine flooding (18), anthropogenic (affected by the operation of gates or pumps) (17), or mixed/uncertain on the basis of field observations and the appearance of the water-level data (5).

Figure   Figure
Figure 1. Storm-surge sensor.   Figure 2. Deploying a sensor on the coast


Figure SSS-LA-JEF-024 SSS-LA-JEF-023 SSS-LA-JEF-004 SSS-LA-JEF-001 SSS-LA-SCH-001 SSS-LA-SJB-001 SSS-LA-TER-024 SSS-LA-TER-010 SSS-LA-TER-025 SSS-LA-TER-009 SSS-LA-TER-002 SSS-LA-VER-002 SSS-LA-LAF-007 SSS-LA-LAF-006 SSS-LA-TER-008 SSS-LA-TER-004 SSS-LA-VER-003 SSS-LA-IBE-002 SSS-LA-IBE-003 SSS-LA-VER-005 SSS-LA-VER-004 SSS-LA-LAF-004 SSS-LA-STB-004 SSS-LA-ORL-014 SSS-LA-ORL-010 SSS-LA-ORL-009 SSS-LA-ORL-013 SSS-LA-ORL-012 SSS-LA-ORL-005 SSS-LA-ORL-002 SSS-LA-ORL-008 SSS-LA-ORL-012 SSS-LA-ORL-007 SSS-LA-ORL-001 SSS-LA-STB-001 SSS-LA-STB-003 SSS-LA-STB-002 SSS-LA-PLA-001 SSS-LA-PLA-003 SSS-LA-PLA-004 SSS-LA-PLA-002 SSS-LA-PLA-005 SSS-LA-ASS-006 SSS-LA-JEF-013 SSS-LA-JEF-009 SSS-LA-JEF-005 SSS-LA-LAF-002 SSS-LA-ASS-005 SSS-LA-JEF-002 SSS-LA-JEF-014 SSS-LA-JEF-015 SSS-LA-JEF-011 SSS-LA-SMN-002 SSS-LA-JEF-010 SSS-LA-SMY-003 SSS-LA-JEF-017 SSS-LA-JEF-021 SSS-LA-JEF-020 SSS-LA-JEF-018 SSS-LA-SMY-001 SSS-LA-SMY-005 SSS-LA-LAF-003
Figure 3. Sensor sites from which storm-surge data were obtained during Hurricane Gustav, September 2008.

Data were processed for 110 of the 121 sensors recovered; 61 recorded water pressure, which is expressed as water level in feet above North American Vertical Datum of 1988 (NAVD88), and 49 recorded barometric pressure, expressed in pounds per square inch. The sensors also were programmed to record date and time, and air temperature.

Data were processed following protocols established by McGee and others (2005), which include correcting water pressure for changes in barometric pressure and salinity. Quality-control checks were made by colocating water-level sensors at a subset of sites and comparing data from those sensors to water levels computed from recorded pressure data at those sites; and by comparing water levels computed from recorded pressure data to water levels recorded at nearby USGS gaging stations and to independent high-water marks where possible. Elevation surveys using global positioning systems and differential levels were done to relate all water-level data, reference marks, benchmarks, and sensor measuring points to NAVD88.

The data from the Hurricane Gustav storm surge network constitute an extensive collection of continuous water-level records documenting a single land-falling hurricane. The data can be used to evaluate the performance of storm-surge models for maximum and incremental water level and flood extent, and site-specific effects of storm-surge on natural and anthropogenic elements of the environment; anthropogenic elements include several gates and pumps used to control or diminish flooding in New Orleans and other areas of southeastern Louisiana. The data are available below on a provisional basis in tab-delimited, ASCII format by site for each sensor (table 1). Data for each site comprise date, time, water level, corresponding water pressure, barometric pressure, temperature from water-pressure sensor, temperature from barometric-pressure sensor, and indicators of missing data. The data-processing date is in the file header. The data also are available in a single folder by clicking here.

Reference

McGee, B.D., Goree, B.B., Tollett, R.W., Woodward, B.K., and Kress, W.H., 2005, Hurricane Rita surge data, southwestern Louisiana and southeastern Texas, September to November 2005: U.S. Geological Survey Data Series 220, available at https://pubs.usgs.gov/ds/2006/220/.

Table 1. Hurricane Gustav storm-surge data for 61 sites in Louisiana, September 2008.

Site name

Latitude,
decimal degrees

Longitude,
decimal degrees

Data type

Graph

SSS-LA-ASS-005

29.94113

-91.02342

Riverine flooding

Graph (97 KB .pdf)

SSS-LA-ASS-006

29.98961

-91.03153

Riverine flooding

Graph (54 KB .pdf)

SSS-LA-IBE-002

29.92250

-91.80325

Riverine flooding

Graph (95 KB .pdf)

SSS-LA-IBE-003

29.85286

-91.78750

Riverine flooding

Graph (92 KB .pdf)

SSS-LA-JEF-001

30.03112

-90.24667

Anthropogenic

Graph (206 KB .pdf)

SSS-LA-JEF-002

30.02205

-90.21449

Anthropogenic

Graph (208 KB .pdf)

SSS-LA-JEF-004

30.01147

-90.27467

Anthropogenic

Graph (197 KB .pdf)

SSS-LA-JEF-005

30.02136

-90.12379

Surge

Graph (109 KB .pdf)

SSS-LA-JEF-009

30.01600

-90.17967

Anthropogenic

Graph (208 KB .pdf)

SSS-LA-JEF-010

29.89872

-90.16577

Anthropogenic

Graph (219 KB .pdf)

SSS-LA-JEF-011

29.91157

-90.16761

Anthropogenic

Graph (126 KB .pdf)

SSS-LA-JEF-013

30.02121

-90.18043

Surge

Graph (228 KB .pdf)

SSS-LA-JEF-014

29.99987

-90.12338

Mixed/uncertain

Graph (131 KB .pdf)

SSS-LA-JEF-015

29.97588

-90.12542

Anthropogenic

Graph (210 KB .pdf)

SSS-LA-JEF-017

29.87534

-90.11511

Anthropogenic

Graph (274 KB .pdf)

SSS-LA-JEF-018

29.87130

-90.06951

Anthropogenic

Graph (309 KB .pdf)

SSS-LA-JEF-020

29.87690

-90.04356

Anthropogenic

Graph (284 KB .pdf)

SSS-LA-JEF-021

29.90695

-90.01850

Anthropogenic

Graph (277 KB .pdf)

SSS-LA-JEF-023

29.83630

-90.08440

Anthropogenic

Graph (201 KB .pdf)

SSS-LA-JEF-024

29.77839

-90.10021

Riverine flooding

Graph (94 KB .pdf)

SSS-LA-LAF-002

29.79847

-90.82244

Riverine flooding

Graph (90 KB .pdf)

SSS-LA-LAF-003

29.70780

-90.57255

Riverine flooding

Graph (141 KB .pdf)

SSS-LA-LAF-004

29.56899

-90.38516

Riverine flooding

Graph (174 KB .pdf)

SSS-LA-LAF-006

29.24706

-90.20988

Surge

Graph (162 KB .pdf)

SSS-LA-LAF-007

29.18723

-90.09022

Surge

Graph (163 KB .pdf)

SSS-LA-ORL-001

29.93675

-90.13543

Surge

Graph (255 KB .pdf)

SSS-LA-ORL-002

30.02807

-90.12029

Surge

Graph (253 KB .pdf)

SSS-LA-ORL-005

30.02589

-90.08292

Surge

Graph (115 KB .pdf)

SSS-LA-ORL-007

29.93322

-90.01417

Anthropogenic

Graph (142 KB .pdf)

SSS-LA-ORL-008

29.98061

-90.02260

Surge

Graph (147 KB .pdf)

SSS-LA-ORL-009

30.00439

-90.02618

Surge

Graph (163 KB .pdf)

SSS-LA-ORL-010

30.03182

-90.03658

Surge

Graph (129 KB .pdf)

SSS-LA-ORL-012

29.98243

-89.94561

Surge

Graph (135 KB .pdf)

SSS-LA-ORL-013

30.00628

-89.93957

Surge

Graph (144 KB .pdf)

SSS-LA-ORL-014

30.07697

-89.94317

Surge

Graph (136 KB .pdf)

SSS-LA-PLA-001

29.86738

-90.01072

Surge

Graph (220 KB .pdf)

SSS-LA-PLA-002

29.86535

-90.00482

Anthropogenic

Graph (202 KB .pdf)

SSS-LA-PLA-003

29.87751

-90.01637

Anthropogenic

Graph (196 KB .pdf)

SSS-LA-PLA-004

29.86309

-89.90876

Surge

Graph (196 KB .pdf)

SSS-LA-PLA-005

29.81649

-90.04346

Anthropogenic

Graph (98 KB .pdf)

SSS-LA-SCH-001

29.91380

-90.27480

Riverine flooding

Graph (118 KB .pdf)

SSS-LA-SJB-001

29.79057

-90.42360

Riverine Flooding

Graph (109 KB .pdf)

SSS-LA-SMN-002

29.76347

-91.17583

Riverine flooding

Graph (80 KB .pdf)

SSS-LA-SMY-001

29.76756

-91.71614

Riverine flooding

Graph (97 KB .pdf)

SSS-LA-SMY-003

29.57344

-91.53700

Riverine flooding

Graph (81 KB .pdf)

SSS-LA-SMY-005

29.68156

-91.47080

Riverine flooding

Graph (117 KB .pdf)

SSS-LA-STB-001

29.96234

-89.98760

Anthropogenic

Graph (136 KB .pdf)

SSS-LA-STB-002

29.93954

-89.92856

Surge

Graph (189 KB .pdf)

SSS-LA-STB-003

29.90090

-89.89376

Mixed/uncertain

Graph (199 KB .pdf)

SSS-LA-STB-004

29.85498

-89.67865

Surge

Graph (250 KB .pdf)

SSS-LA-TER-002

29.64317

-90.96119

Mixed/uncertain

Graph (92 KB .pdf)

SSS-LA-TER-004

29.56061

-90.79118

Mixed/uncertain

Graph (148 KB .pdf)

SSS-LA-TER-008

29.49858

-90.68173

Surge

Graph (150 KB .pdf)

SSS-LA-TER-009

29.42679

-90.59938

Mixed/uncertain

Graph (153 KB .pdf)

SSS-LA-TER-010

29.33291

-90.64293

Surge

Graph (158 KB .pdf)

SSS-LA-TER-024

29.24594

-90.66109

Surge

Graph (170 KB .pdf)

SSS-LA-TER-025

29.37317

-90.71300

Surge

Graph (152 KB .pdf)

SSS-LA-VER-002

29.79719

-92.14097

Riverine flooding

Graph (81 KB .pdf)

SSS-LA-VER-003

29.88552

-92.12508

Riverine flooding

Graph (91 KB .pdf)

SSS-LA-VER-004

29.97492

-92.13875

Riverine flooding

Graph (85 KB .pdf)

SSS-LA-VER-005

29.91839

-91.99808

Riverine flooding

Graph (91 KB .pdf)

Version 1.0

First posted January 8, 2009

For additional information contact:

Director, Louisiana Water Science Center
3535 S. Sherwood Forest Blvd.
Suite 120
Baton Rouge, Louisiana 70816
(225) 298-5481

http://la.water.usgs.gov

Part or all of this report is presented in Portable Document Format (PDF); the latest version of Adobe Reader or similar software is required to view it. Download the latest version of Adobe Reader, free of charge.


Suggested citation:

McGee, B.D., Goree, B.B., Tollett, R.W., and Mason, R.R., Jr., 2008, Monitoring inland storm surge and flooding from Hurricane Gustav in Louisiana, September 2008: U.S. Geological Survey Open-File Report 2008–1373 [https://pubs.usgs.gov/of/2008/1373/].


Accessibility FOIA Privacy Policies and Notices

Take Pride in America logo USA.gov logo U.S. Department of the Interior | U.S. Geological Survey
URL: http://pubsdata.usgs.gov/pubs/of/2008/1373/index.html
Page Contact Information: GS Pubs Web Contact
Page Last Modified: Wednesday, 07-Dec-2016 21:38:05 EST