DH_SedimentSamples: Locations and analysis of sediment samples collected in the Duxbury to Hull Massachusetts survey area.

Metadata also available as - [Outline] - [Parseable text]

Frequently-anticipated questions:


What does this data set describe?

Title:
DH_SedimentSamples: Locations and analysis of sediment samples collected in the Duxbury to Hull Massachusetts survey area.
Abstract:
These data were collected under a cooperative agreement with the Massachusetts Office of Coastal Zone Management (CZM) and the U.S. Geological Survey (USGS), Coastal and Marine Geology Program, Woods Hole Science Center (WHSC). Initiated in 2003, the primary objective of this program is to develop regional geologic framework information for the management of coastal and marine resources. Accurate data and maps of sea-floor geology are important first steps toward protecting fish habitat, delineating marine resources, and assessing environmental changes due to natural or human impacts. The project is focused on the inshore waters (5-30 m deep) of Massachusetts between the New Hampshire border and Cape Cod Bay. Data collected for the mapping cooperative have been released in a series of USGS Open-File Reports (<http://woodshole.er.usgs.gov/project-pages/coastal_mass/html/current_map.html>). This spatial dataset is from the study area located between Duxbury and Hull Massachusetts, and consists of high-resolution geophysics (bathymetry, backscatter intensity, and seismic reflection) and ground validation (sediment samples, video tracklines and bottom photographs). The data were collected during four separate surveys conducted between 2003 and 2007 (NOAA survey H10993 in 2003, USGS-WHSC survey 06012 in 2006, and USGS-WHSC surveys 07001 and 07003 in 2007) and cover more than 200 square kilometers of the inner continental shelf.
  1. How should this data set be cited?

    U.S. Geological Survey, 2010, DH_SedimentSamples: Locations and analysis of sediment samples collected in the Duxbury to Hull Massachusetts survey area.: Open-File Report 2009-1072, U.S. Geological Survey, Coastal and Marine Geology Program, Woods Hole Science Center, Woods Hole, Massachusetts.

    Online Links:

    This is part of the following larger work.

    Barnhardt, Walter A. , Ackerman, Seth D. , Andrews, Brian D. , and Baldwin, Wayne E. , 2010, Geophysical and Sampling Data from the Inner Continental Shelf: Duxbury to Hull, Massachusetts.: Open-File Report 2009-1072, U.S. Geological Survey, Coastal and Marine Geology Program, Woods Hole Science Center, Woods Hole, Massachusetts.

    Online Links:

  2. What geographic area does the data set cover?

    West_Bounding_Coordinate: -70.810074
    East_Bounding_Coordinate: -70.606740
    North_Bounding_Coordinate: 42.325839
    South_Bounding_Coordinate: 42.106931

  3. What does it look like?

    <https://pubs.usgs.gov/of/2009/1072/GIS/browse_jpg/big/DH_SedimentSamples.jpg> (JPEG)
    Thumbnail image of sediment sample locations

  4. Does the data set describe conditions during a particular time period?

    Beginning_Date: 07-Sep-2007
    Ending_Date: 11-Sep-2007
    Currentness_Reference: ground condition

  5. What is the general form of this data set?

    Geospatial_Data_Presentation_Form: vector digital data

  6. How does the data set represent geographic features?

    1. How are geographic features stored in the data set?

      This is a Vector data set. It contains the following vector data types (SDTS terminology):

      • Entity point (28)

    2. What coordinate system is used to represent geographic features?

      Horizontal positions are specified in geographic coordinates, that is, latitude and longitude. Latitudes are given to the nearest 0.000001. Longitudes are given to the nearest 0.000001. Latitude and longitude values are specified in Decimal degrees.

      The horizontal datum used is D_WGS_1984.
      The ellipsoid used is WGS_1984.
      The semi-major axis of the ellipsoid used is 6378137.000000.
      The flattening of the ellipsoid used is 1/298.257224.

  7. How does the data set describe geographic features?

    DH_SedimentSamples
    Point location of sediment samples (Source: USGS)

    FID
    Internal feature number. (Source: ESRI)

    Sequential unique whole numbers that are automatically generated.

    Shape
    Feature geometry. (Source: ESRI)

    Coordinates defining the features.

    GROUP
    Internal Value - Sediment Lab Grouping (Source: USGS)

    Range of values
    Minimum:3
    Maximum:3

    DB_ID
    Unique identifier consisting of two characters and three numerics assigned during lab analysis (Source: Scientist)

    Character string of width 254

    FIELD_NO
    Sample name assigned in the field (Source: Scientist)

    Character string of width 254

    PROJECT
    Project under which the samples were taken (COASTAL MASS = Coastal Massachusetts) (Source: Scientist)

    Character string of width 254

    CRUISE_ID
    Name or number of cruise during which the samples were collected (Source: Scientist)

    Character string of width 254

    CONTACT
    Name (initial and last name) of the principal investigator and/or survey data curator (Source: Scientist)

    Character string of width 254

    AREA
    General geographic where the samples were taken (Source: Scientist)

    Character string of width 254

    LATITUDE
    Latitude coordinate of sample location (decimal degrees, WGS84) (Source: USGS East Coast Sediment Texture Database data dictionary)

    Range of values
    Minimum:42.106931
    Maximum:42.325839
    Units:Decimal degrees
    Resolution:0.000001

    LONGITUDE
    Longitude coordinate of sample location (decimal degrees, WGS84) (Source: USGS East Coast Sediment Texture Database data dictionary)

    Range of values
    Minimum:-70.810074
    Maximum:-70.60674
    Units:Decimal degrees
    Resolution:0.000001

    DEPTH_M
    Depth or sounding in meters, extracted from the final bathymetry grid from the Duxbury to Hull survey area (depth for sample 145 was determined by the adjacent bathymetry grid wmb_bathy6m - see processing steps for more information). (Source: USGS East Coast Sediment Texture Database data dictionary)

    Range of values
    Minimum:9.9
    Maximum:33.8
    Units:meters

    T_DEPTH
    Top depth of the sample below sediment-water interface in centimeters (Source: USGS East Coast Sediment Texture Database data dictionary)

    Range of values
    Minimum:0
    Maximum:0
    Units:centimeters

    B_DEPTH
    Bottom depth of the sample below sediment-water interface in centimeters (Source: USGS East Coast Sediment Texture Database data dictionary)

    Range of values
    Minimum:2
    Maximum:2
    Units:centimeters

    DEVICE
    Device used to collect sample (Source: USGS East Coast Sediment Texture Database data dictionary)

    VAN VEEN GRAB

    MONTH_COLL
    Calendar month sample collected based on time in UTC. (Source: USGS East Coast Sediment Texture Database data dictionary)

    Range of values
    Minimum:9
    Maximum:9

    DAY_COLL
    Calendar day sample collected based on time in UTC. (Source: USGS East Coast Sediment Texture Database data dictionary)

    Range of values
    Minimum:8
    Maximum:10

    YEAR_COLL
    Calendar year sample collected based on time in UTC. (Source: USGS East Coast Sediment Texture Database data dictionary)

    Range of values
    Minimum:7
    Maximum:7

    MONTH_ANAL
    Calendar month sample analyzed. (Source: USGS East Coast Sediment Texture Database data dictionary)

    Range of values
    Minimum:11
    Maximum:11

    DAY_ANAL
    Calendar day sample analyzed. (Source: USGS East Coast Sediment Texture Database data dictionary)

    Range of values
    Minimum:1
    Maximum:8

    YEAR_ANAL
    Calendar year sample analyzed. (Source: USGS East Coast Sediment Texture Database data dictionary)

    Range of values
    Minimum:7
    Maximum:7

    WEIGHT
    Weight of dry sample in grams (Source: Sediment Laboratory Analyst)

    Range of values
    Minimum:11.1211
    Maximum:207.04
    Units:grams
    Resolution:0.0001

    GRAVEL_PCT
    Gravel content in percent dry weight of the sample (particles with nominal diameters greater than 2 mm; -1phi and larger) (Source: USGS East Coast Sediment Texture Database data dictionary)

    Range of values
    Minimum:0
    Maximum:65.21
    Units:percent
    Resolution:0.01

    SAND_PCT
    Sand content in percent dry weight of the sample (particles with nominal diameters less than 2 mm, but greater than or equal to 0.0625 mm ; 0phi through 4phi ) (Source: USGS East Coast Sediment Texture Database data dictionary)

    Range of values
    Minimum:1.79
    Maximum:99.51
    Units:percent
    Resolution:0.01

    SILT_PCT
    Silt content in percent dry weight of the sample (particles with nominal diameters less than 0.0625 mm, but greater than or equal to 0.004 mm; 5phi through 8phi, inclusive) (Source: USGS East Coast Sediment Texture Database data dictionary)

    Range of values
    Minimum:0.09
    Maximum:63.24
    Units:percent
    Resolution:0.01

    CLAY_PCT
    Clay content in percent dry weight of the sample (particles with nominal diameters less than 0.004 mm; 9phi and smaller) (Source: USGS East Coast Sediment Texture Database data dictionary)

    Range of values
    Minimum:0.06
    Maximum:44.98
    Units:percent
    Resolution:0.01

    CLASSIFICA
    Sediment description based on a rigorous definition (Shepard, 1954) (Source: USGS East Coast Sediment Texture Database data dictionary - USGS OFR 2005-1001)

    ValueDefinition
    GRAVELSediment whose main phase (usually >50%) is >2 mm
    GRAVELLY SEDIMENTSediment whose main phase (usually >50%) is >2 mm, but with significant sand)
    SANDSediment whose main phase is <2 mm, but >0.062 mm
    SILTY SANDSediment whose main phase is sand (usually >50%), but with significant silt
    SAND SILT CLAYSediment with sand, silt, and clay concentrations all <20%)
    SANDY SILTSediment whose main phase is silt (usually >50%), but with significant sand
    CLAYEY SILTSediment whose main phase is silt (usually >50%), but with significant clay

    MEDIAN
    Middle point in the grain-size distribution in phi units (Source: USGS East Coast Sediment Texture Database data dictionary)

    Range of values
    Minimum:-1.82
    Maximum:7.84
    Units:phi
    Resolution:0.01

    MEAN
    Average value in the grain-size distribution in phi units (Source: USGS East Coast Sediment Texture Database data dictionary)

    Range of values
    Minimum:-1.68
    Maximum:7.83
    Units:phi
    Resolution:0.01

    STDEV
    Standard Deviation of the grain-size distribution in phi units (Source: USGS East Coast Sediment Texture Database data dictionary)

    Range of values
    Minimum:0.52
    Maximum:4.19
    Units:phi
    Resolution:0.01

    SKEWNESS
    Deviation from symmetrical form of the grain-size distribution (Source: USGS East Coast Sediment Texture Database data dictionary)

    Range of values
    Minimum:-0.43
    Maximum:3.63
    Resolution:0.01

    KURTOSIS
    Degree of curvature near the mode of the grain-size distribution (Source: USGS East Coast Sediment Texture Database data dictionary)

    Range of values
    Minimum:-1.25
    Maximum:73.47
    Resolution:0.01

    MODE1CLASS
    First mode (particle size that occurs the most number of times) in phi units (Source: U.S. Geological Survey)

    null value

    MODE1FREQ
    Modal strength of the first mode in percent. (Source: U.S. Geological Survey)

    null value

    MODE2CLASS
    Second mode in phi units. (Source: U.S. Geological Survey)

    null value

    MODE2FREQ
    Modal strength of the second mode in percent. (Source: U.S. Geological Survey)

    null value

    MODE3CLASS
    Third mode in phi units. (Source: U.S. Geological Survey)

    null value

    MODE3FREQ
    Modal strength of the third mode in percent. (Source: U.S. Geological Survey)

    null value

    NMODES
    Number of modes (Source: U.S. Geological Survey)

    null value

    PHIM5
    Weight percent of the sample in the -5 phi fraction (Source: USGS East Coast Sediment Texture Database data dictionary)

    Range of values
    Minimum:0
    Maximum:0
    Units:percent
    Resolution:0.01

    PHIM4
    Weight percent of the sample in the -4 phi fraction (Source: USGS East Coast Sediment Texture Database data dictionary)

    Range of values
    Minimum:0
    Maximum:14.7
    Units:percent
    Resolution:0.01

    PHIM3
    Weight percent of the sample in the -3 phi fraction (Source: USGS East Coast Sediment Texture Database data dictionary)

    Range of values
    Minimum:0
    Maximum:25.79
    Units:percent
    Resolution:0.01

    PHIM2
    Weight percent of the sample in the -2 phi fraction (Source: USGS East Coast Sediment Texture Database data dictionary)

    Range of values
    Minimum:0
    Maximum:20.98
    Units:percent
    Resolution:0.01

    PHIM1
    Weight percent of the sample in the -1 phi fraction (Source: USGS East Coast Sediment Texture Database data dictionary)

    Range of values
    Minimum:0
    Maximum:39.73
    Units:percent
    Resolution:0.01

    PHI_0
    Weight percent of the sample in the 0 phi fraction (Source: USGS East Coast Sediment Texture Database data dictionary)

    Range of values
    Minimum:0.01
    Maximum:21.44
    Units:percent
    Resolution:0.01

    PHI_1
    Weight percent of the sample in the 1 phi fraction (Source: USGS East Coast Sediment Texture Database data dictionary)

    Range of values
    Minimum:0.08
    Maximum:29.61
    Units:percent
    Resolution:0.01

    PHI_2
    Weight percent of the sample in the 2 phi fraction (Source: USGS East Coast Sediment Texture Database data dictionary)

    Range of values
    Minimum:0.28
    Maximum:60.43
    Units:percent
    Resolution:0.01

    PHI_3
    Weight percent of the sample in the 3 phi fraction (Source: USGS East Coast Sediment Texture Database data dictionary)

    Range of values
    Minimum:0.48
    Maximum:79.06
    Units:percent
    Resolution:0.01

    PHI_4
    Weight percent of the sample in the 4 phi fraction (Source: USGS East Coast Sediment Texture Database data dictionary)

    Range of values
    Minimum:0.09
    Maximum:47.03
    Units:percent
    Resolution:0.01

    PHI_5
    Weight percent of the sample in the 5 phi fraction (Source: USGS East Coast Sediment Texture Database data dictionary)

    Range of values
    Minimum:0.01
    Maximum:12.01
    Units:percent
    Resolution:0.01

    PHI_6
    Weight percent of the sample in the 6 phi fraction (Source: USGS East Coast Sediment Texture Database data dictionary)

    Range of values
    Minimum:0.02
    Maximum:21.36
    Units:percent
    Resolution:0.01

    PHI_7
    Weight percent of the sample in the 7 phi fraction (Source: USGS East Coast Sediment Texture Database data dictionary)

    Range of values
    Minimum:0.03
    Maximum:22.10
    Units:percent
    Resolution:0.01

    PHI_8
    Weight percent of the sample in the 8 phi fraction (Source: USGS East Coast Sediment Texture Database data dictionary)

    Range of values
    Minimum:0.03
    Maximum:30.58
    Units:percent
    Resolution:0.01

    PHI_9
    Weight percent of the sample in the 9 phi fraction (Source: USGS East Coast Sediment Texture Database data dictionary)

    Range of values
    Minimum:0.03
    Maximum:25.27
    Units:percent
    Resolution:0.01

    PHI_10
    Weight percent of the sample in the 10 phi fraction (Source: USGS East Coast Sediment Texture Database data dictionary)

    Range of values
    Minimum:0.02
    Maximum:14.07
    Units:percent
    Resolution:0.01

    PHI_11
    Weight percent of the sample in the 11 phi fraction (Source: USGS East Coast Sediment Texture Database data dictionary)

    Range of values
    Minimum:0.01
    Maximum:5.64
    Units:percent
    Resolution:0.01

    ANALYST
    Name(usually first initial and last name) of person who performed the grain size or physical properties analysis (Source: USGS East Coast Sediment Texture Database data dictionary)

    Character string of width 254

    ANAL_COMM
    Any further information about sediment analysis for all or specific parameters in this table (Source: USGS East Coast Sediment Texture Database data dictionary)

    Character string of width 254

    LITHOLOGY
    General lithologic description of sample (Source: USGS East Coast Sediment Texture Database data dictionary)

    Character string of width 254

    COMMENTS
    IComments on sample collection or lithology (Source: USGS East Coast Sediment Texture Database data dictionary)

    Character string of width 254

    Entity_and_Attribute_Overview:
    The Attribute Definition Source for most of these attributes is the USGS East Coast Sediment Texture Database data dictionary which can be found in USGS Open File Report 2005-1001 (<https://pubs.usgs.gov/of/2005/1001/>)
    Entity_and_Attribute_Detail_Citation:
    USGS Open File Report 2005-1001 (<https://pubs.usgs.gov/of/2005/1001/>)


Who produced the data set?

  1. Who are the originators of the data set? (may include formal authors, digital compilers, and editors)

  2. Who also contributed to the data set?

  3. To whom should users address questions about the data?

    Seth Ackerman
    U.S. Geological Survey
    Geologist
    384 Woods Hole Rd.
    Woods Hole, MA 02543-1598
    USA

    508-548-8700 x2315 (voice)
    508-457-2310 (FAX)
    sackerman@usgs.gov


Why was the data set created?

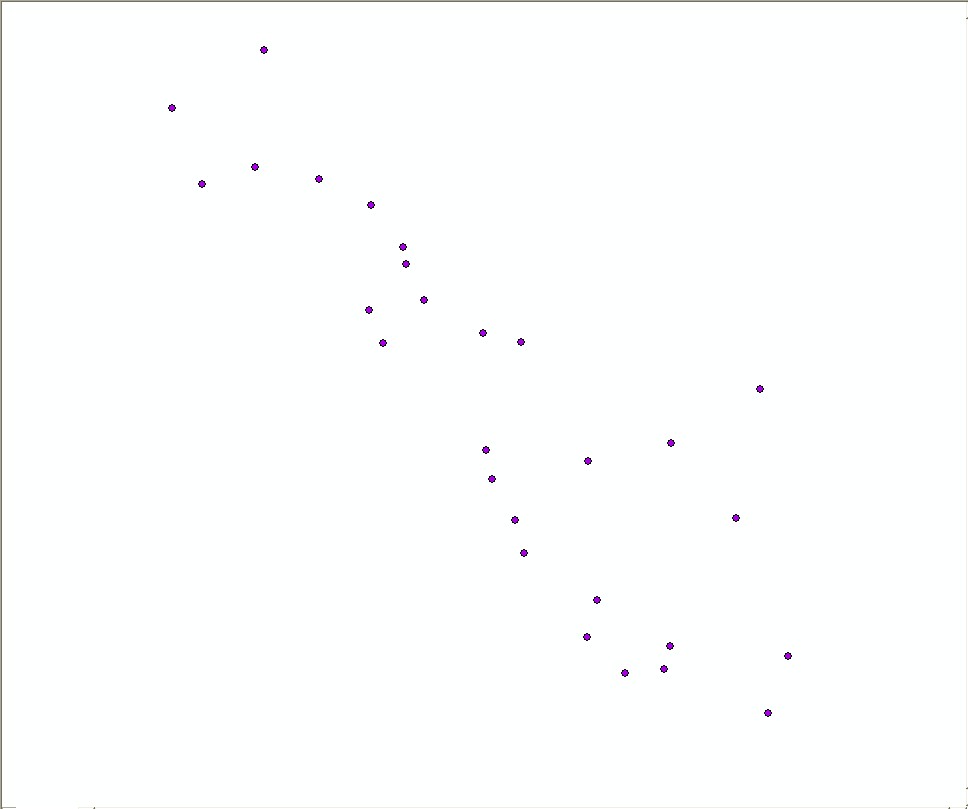
This data set includes the locations, identifiers, grain-size data and(or) textural descriptions of surficial sediments collected at 28 stations. The sediments were collected with a modified Van Veen grab (large SEABed Observation and Sampling System (SEABOSS)) during USGS survey 07003, conducted September 7-11, 2007 aboard the R/V Connecticut offshore Massachusetts in the Duxbury to Hull survey area. This data set was collected to ground-truth (verify) the acoustic data sets that were acquired during NOAA hydrographic survey H10993 (2003) and USGS geophysical surveys 06012 (2006) and 07001 (2007). Samples were analyzed in the sediment laboratory at the USGS Woods Hole Science Center.


How was the data set created?

  1. From what previous works were the data drawn?

    (source 1 of 1)

  2. How were the data generated, processed, and modified?

    Date: Sep-2007 (process 1 of 5)
    One hundred twenty-eight samples were collected aboard the R/V Connecticut (USGS survey 07003) with a Van Veen grab sampler (Blackwood and Parolski, 2001) that was also equipped with a digital-still and video camera. Forty-nine additional stations were occupied and "sampled" with the photographs and video where sediment samples could not be collected. Those stations are not represented in this dataset; see the SEABOSS Trackline shapefile in this report (USGS OFR 2009-1072) for the locations of those data.

    Person who carried out this activity:

    Science party of survey 07003
    U.S. Geological Survey
    Geologists
    384 Woods Hole Road
    Woods Hole, MA 02543-1598
    USA

    (508) 548-8700 x2315 (voice)
    (508) 457-2310 (FAX)
    sackerman@usgs.gov

    Data sources produced in this process:
    • bagged sediment samples

    Date: Nov-2007 (process 2 of 5)
    Samples were analyzed in the sediment laboratory at the USGS Woods Hole Science Center. Coarse fraction determined by sieve; fine fraction determined by Coulter Counter. See Poppe, Williams, and Paskevich (2005) for analytical specifics. MS Excel file (XLS) saved as Comma Separated Value file (CSV).

    Person who carried out this activity:

    Larry Poppe
    U.S. Geological Survey
    Geologist
    384 Woods Hole Road
    Woods Hole, MA 02543-1598
    USA

    (508) 548-8700 x2314 (voice)
    (508) 457-2310 (FAX)
    lpoppe@usgs.gov

    Data sources used in this process:
    • bagged sediment samples

    Data sources produced in this process:

    • wb1.xls
    • wb1.csv

    Date: 06-Feb-2009 (process 3 of 5)
    In ArcCatalog (version 9.3), the ASCII comma-delimited file (wb1.csv) was converted to a point feature class by right-clicking on the comma separated value text file -- Create Feature Class -- from XY table using the defined projection Geographic (Decimal_Degrees_WGS84.prj). {output file: 07003_SedAnalysis_Feb6.shp]

    Person who carried out this activity:

    Seth Ackerman
    U.S. Geological Survey
    Geologist
    384 Woods Hole Rd.
    Woods Hole, MA 02543-1598
    USA

    508-548-8700 x2315 (voice)
    508-457-2310 (FAX)
    sackerman@usgs.gov

    Data sources used in this process:
    • wb1.csv

    Data sources produced in this process:

    • 07003_SedAnalysis_Feb6.shp
    • 07003_SedAnalysis_Feb6.prj

    Date: 06-Feb-2009 (process 4 of 5)
    In ArcMap (version 9.3), the twenty-eight sediment sample locations from within the Duxbury to Hull survey area were selected from the shapefile of one hundred twenty-eight sediment sample locations that were collected during USGS field activity 07003. The selected sample locations representing the data from the Duxbury to Hull project were exported to a new ESRI point shapefile. Then XTools Pro (version 5.3.0) for ArcGIS desktop was used to export the table to Microsoft Excel, where the table was saved as an ASCII comma-delimited file (csv) [output files: DH_SedimentSamples.shp, DH_SedimentSamples.csv]

    Person who carried out this activity:

    Seth Ackerman
    U.S. Geological Survey
    Geologist
    384 Woods Hole Rd.
    Woods Hole, MA 02543-1598
    USA

    508-548-8700 x2315 (voice)
    508-457-2310 (FAX)
    sackerman@usgs.gov

    Data sources used in this process:
    • 07003_SedAnalysis_Feb6.shp

    Data sources produced in this process:

    • DH_SedimentSamples.shp
    • DH_SedimentSamples.prj
    • DH_SedimentSamples.csv

    Date: 20-Aug-2009 (process 5 of 5)
    In ArcMap (version 9.3), new depths were extracted from the final bathymetry grid (DH_bathy5m) using the tool VACExtras (v2.1) - Extract Depth. A single station (sample number 145) was collected beyond the bounds of the Duxbury to Hull survey area but within the adjacent Western Massachusetts Bay multibeam-echosounder survey (<https://pubs.usgs.gov/ds/99/>) therefore the depth of this sample was determined from the grid "wmb_bathy6m" using the identify tool in ArcMap and manually editing the attribute table. The Extract Depth tool created a temporary column in the attribute table called "depth_temp" and the ArcMap field calculator was used to convert the negative elevation value to a positive depth value, replacing the existing values in the field "DEPTH_M." The ASCII comma-delimited file (csv) created in the previous step was manually edited using a Microsoft Excel and saved as a CSV file with the same filename [output files: DH_SedimentSamples.shp, DH_SedimentSamples.csv]

    Person who carried out this activity:

    Seth Ackerman
    U.S. Geological Survey
    Geologist
    384 Woods Hole Rd.
    Woods Hole, MA 02543-1598
    USA

    508-548-8700 x2315 (voice)
    508-457-2310 (FAX)
    sackerman@usgs.gov

    Data sources used in this process:
    • DH_SedimentSamples.shp
    • DH_SedimentSamples.csv

    Data sources produced in this process:

    • DH_SedimentSamples.shp
    • DH_SedimentSamples.csv

  3. What similar or related data should the user be aware of?

    Poppe, L.J., Williams, S.J., and Paskevich, V.F., 2005, USGS East-Coast Sediment Analysis: Procedures, Database, and GIS Data: Open-File Report 2005-1001, U.S. Geological Survey, Coastal and Marine Geology Program, Woods Hole Science Center, Woods Hole, MA.

    Online Links:

    Shepard, F.P., 1954, Nomenclature based on sand-silt-clay ratios: Journal Sedimentary Petrology 24 (3), Society of Economic Paleontologists and Mineralogists, Tulsa, OK.

    Online Links:

    Blackwood, D., and Parolski, K., 2001, Seabed observation and sampling system: Sea Technology v. 42, no. 2, p. 39-43.

    Barnhardt, Walter A. , Andrews, Brian D. , and Butman, Bradford, 2006, High-Resolution Mapping of the Inner Continental Shelf: Nahant to Gloucester, Massachusetts: Open-File Report 2005-1293, U.S. Geological Survey, Coastal and Marine Geology Program, Woods Hole Science Center, Woods Hole, MA.

    Online Links:

    Ackerman, Seth D. , Butman, Bradford, Barnhardt, Walter A. , Danforth, William W. , and Crocker, James M. , 2006, High-Resolution Geologic Mapping of the Inner Continental Shelf: Boston Harbor and Approaches, Massachusetts: Open-File Report 2006-1008, U.S. Geological Survey, Coastal and Marine Geology Program, Woods Hole Science Center, Woods Hole, MA.

    Online Links:

    Barnhardt, Walter A. , Andrews, Brian D. , Ackerman, Seth D. , Baldwin, Wayne E. , and Hein, Christopher J. , 2009, High-Resolution Geological Mapping of the Inner Continental Shelf: Cape Ann to Salisbury Beach, Massachusetts: Open-File Report 2007-1373, U.S. Geological Survey, Coastal and Marine Geology Program, Woods Hole Science Center, Woods Hole, MA.

    Online Links:


How reliable are the data; what problems remain in the data set?

  1. How well have the observations been checked?

    All attributes were checked in a consistent manner

  2. How accurate are the geographic locations?

    Navigation for survey 07003 used differential Global Positioning System (GPS). The recorded position of each sediment sample is actually the position of the GPS antenna on the survey vessel, not the SEABOSS sampler. The SEABOSS was deployed approximately 5 meters astern of the GPS antenna off the ship's J-frame on the starboard side. No layback or offset was applied to the recorded position. In addition to the ±5 meter offset the SEABOSS may drift additionally away from the survey vessel when deployed to the seafloor. Based on the various sources for horizontal offsets, a conservative estimate the horizontal accuracy of the SEABOSS location is 20-30 meters.

  3. How accurate are the heights or depths?

  4. Where are the gaps in the data? What is missing?

    Only the subset of grain-size data collected during the R/V Connecticut survey 07003 that are within the study area between Duxbury and Hull have been included in this spatial dataset. Seventy-seven stations were occupied with the SEABOSS in the Duxbury to Hull survey area; however sediment samples were only collected at 28 stations where collecting a sample would not damage the sampling equipment (e.g. no samples were collected in areas with cobble, boulder or rocky seabed, as identified in real-time by video and photos). A total of 184 sampling sites were occupied during survey 07003; and a total of 128 sediment samples were collected. The grain-size data that is not included in this report are from sites south of Brant Rock, Massachusetts and will be published in a subsequent data release focused on Cape Cod Bay.

  5. How consistent are the relationships among the observations, including topology?

    No additional checks for topological consistency were performed on this data. Gaps in sequential sample numbers may exist.


How can someone get a copy of the data set?

Are there legal restrictions on access or use of the data?

Access_Constraints: None
Use_Constraints:
Public domain data from the U.S. Government are freely redistributable with proper metadata and source attribution. Please recognize the U.S. Geological Survey as the source of this information.

  1. Who distributes the data set? (Distributor 1 of 2)

    Seth Ackerman
    U.S. Geological Survey
    Geologist
    384 Woods Hole Rd.
    Woods Hole, MA 02543-1598
    USA

    508-548-8700 x2315 (voice)
    508-457-2310 (FAX)
    sackerman@usgs.gov

  2. What's the catalog number I need to order this data set?

    Downloadable Data

  3. What legal disclaimers am I supposed to read?

    Neither the U.S. Government, the Department of the Interior, nor the USGS, nor any of their employees, contractors, or subcontractors, make any warranty, express or implied, nor assume any legal liability or responsibility for the accuracy, completeness, or usefulness of any information, apparatus, product, or process disclosed, nor represent that its use would not infringe on privately owned rights. The act of distribution shall not constitute any such warranty, and no responsibility is assumed by the USGS in the use of these data or related materials. Any use of trade, product, or firm names is for descriptive purposes only and does not imply endorsement by the U.S. Government.

  4. How can I download or order the data?

  5. What hardware or software do I need in order to use the data set?

    These data are available in Environmental Systems Research Institute (ESRI) shapefile format. The user must have ArcGIS or ArcView 3.0 or greater software to read and process the data file. In lieu of ArcView or ArcGIS, the user may utilize another GIS application package capable of importing data. A free data viewer, ArcExplorer, capable of displaying the data is available from ESRI at www.esri.com. The shapefile is also distributed in compressed format as one WinZip (ver. 9.0) file. To utilize these data, the user must be able to uncompress the WinZip file.


  1. Who distributes the data set? (Distributor 2 of 2)

    Seth Ackerman
    U.S. Geological Survey
    Geologist
    384 Woods Hole Rd.
    Woods Hole, MA 02543-1598
    USA

    508-548-8700 x2315 (voice)
    508-457-2310 (FAX)
    sackerman@usgs.gov

  2. What's the catalog number I need to order this data set?

    Downloadable Data

  3. What legal disclaimers am I supposed to read?

    Neither the U.S. Government, the Department of the Interior, nor the USGS, nor any of their employees, contractors, or subcontractors, make any warranty, express or implied, nor assume any legal liability or responsibility for the accuracy, completeness, or usefulness of any information, apparatus, product, or process disclosed, nor represent that its use would not infringe on privately owned rights. The act of distribution shall not constitute any such warranty, and no responsibility is assumed by the USGS in the use of these data or related materials. Any use of trade, product, or firm names is for descriptive purposes only and does not imply endorsement by the U.S. Government.

  4. How can I download or order the data?

  5. What hardware or software do I need in order to use the data set?

    These data are available as a generic ASCII formatted data file. The user must have a software program capable of reading the comma-delimited data file.


Who wrote the metadata?

Dates:
Last modified: 29-Oct-2009
Metadata author:
Seth Ackerman
U.S. Geological Survey
Geologist
384 Woods Hole Rd.
Woods Hole, MA 02543-1598
USA

508-548-8700 x2315 (voice)
508-457-2310 (FAX)
sackerman@usgs.gov

Metadata standard:
FGDC Content Standards for Digital Geospatial Metadata (FGDC-STD-001-1998)
Metadata extensions used:


Generated by mp version 2.8.25 on Fri Feb 19 20:52:16 2010