More information about the individual USGS surveys conducted as part of the northern Cape Cod Bay project can be found on the Woods Hole Coastal and Marine Science Center Field Activity webpage:
06012: <http://quashnet.er.usgs.gov/data/2006/06012/> 07001: <http://quashnet.er.usgs.gov/data/2007/07001/> 07002: <http://quashnet.er.usgs.gov/data/2007/07002/> 07003: <http://quashnet.er.usgs.gov/data/2007/07003/> 08002: <http://quashnet.er.usgs.gov/data/2008/08002/>
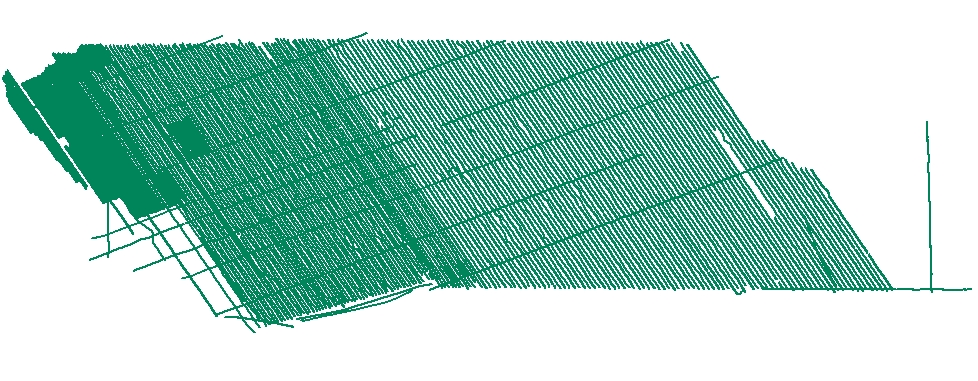
U.S. Geological Survey, 2010, CCB_BathTracklines: Survey tracklines along which bathymetric data were collected with a SEA, SWATHplus interferometric sonar offshore of Massachusetts within northern Cape Cod Bay (ESRI Shapefile, Geographic, WGS84).: Open-File Report 2010-1006, U.S. Geological Survey, Coastal and Marine Geology Program, Woods Hole Coastal and Marine Science Center, Woods Hole, Massachusetts.This is part of the following larger work.Online Links:
- <https://pubs.usgs.gov/of/2010/1006/GIS/shapefile/CCB_BathTracklines.zip>
- <https://pubs.usgs.gov/of/2010/1006/html/appendix1.html>
Andrews, Brian D. , Ackerman, Seth D. , Baldwin, Wayne E. , and Barnhardt, Walter A. , 2010, Geophysical and Sampling Data from the Inner Continental Shelf: Northern Cape Cod Bay, Massachusetts.: Open-File Report 2010-1006, U.S. Geological Survey, Coastal and Marine Geology Program, Woods Hole Coastal and Marine Science Center, Woods Hole, Massachusetts.Online Links:
This is a Vector data set. It contains the following vector data types (SDTS terminology):
Horizontal positions are specified in geographic coordinates, that is, latitude and longitude. Latitudes are given to the nearest 0.000001. Longitudes are given to the nearest 0.000001. Latitude and longitude values are specified in Decimal degrees.
The horizontal datum used is D_WGS_1984.
The ellipsoid used is WGS_1984.
The semi-major axis of the ellipsoid used is 6378137.000000.
The flattening of the ellipsoid used is 1/298.257224.
Sequential unique whole numbers that are automatically generated.
Coordinates defining the features.
Character string of width 4.
| Range of values | |
|---|---|
| Minimum: | 0.04 |
| Maximum: | 18.61 |
| Units: | kilometers (km) |
Characters string of width 10.
Characters string of width 10.
508-548-8700 x2348 (voice)
508-457-2310 (FAX)
bandrews@usgs.gov
The purpose of these data is to manage the trackline navigation and filenames of the 3,289 kilometers of raw bathymetry files collected using a Systems Engineering and Assessment (SEA) Ltd. SWATHplus interferometric sonar within the northern Cape Cod Bay survey area.
During 06012, a TSS DMS 2-05 motion reference unit was mounted directly above the sonar transducers and continuously recorded and sent vertical displacement (heave) and attitude (pitch and roll) of the vessel during acquisition to the SWATHplus software. During 06012 vessel heading was determined by a KVH compass that was corrected for magnetic variation of +15.583 degrees (from NOAA Chart number13246 36th ed., Mar. 10/01) during post processing. During 07002, a Coda Octopus F180 inertial-motion unit, mounted directly above the transducers, measured true heading, vertical displacement (heave) and attitude (pitch and roll) of the vessel during acquisition.
Field activities 07001 and 08002: the SWATHplus transducers were mounted on a rigid pole on the bow of the R/V Rafael, about 0.5 m below the waterline. A Coda Octopus F180 inertial-motion unit, mounted directly above the transducers, measured true heading, vertical displacement (heave) and attitude (pitch and roll) of the vessel during acquisition.
Navigation: Field activity 06012: Real-Time Kinematic (RTK) GPS navigation was used to determine the horizontal and vertical position (xyz) of the GPS antenna mounted directly above the SWATHplus transducers with sub-meter accuracy. The RTK-corrected coordinates were transmitted to the ship from a land-based RTK-GPS station established by the USGS at NOAA Tidal Station #8446009 in Brant Rock Harbor, MA.
Field activities 07001, 07002, and 08002: Differential GPS (DGPS) navigation was used to determine the horizontal position (x,y) of the GPS antenna mounted directly above and forward (F180R primary antenna, 0.5 meters) of the SWATHplus transducers with +/- 1-2 meter accuracy. RTK-GPS was used to determine the vertical position of the Ashtech GPS antenna (z) with sub-meter accuracy.
Vertical coordinates for all four surveys were referenced to Mean Lower Low Water (MLLW) using the offset between the North American Vertical Datum of 1988 (NAVD 88) and MLLW published for the tidal benchmark. Horizontal (x and y) and vertical (z) offsets between the transducers, motion sensor, and GPS antenna were precisely measured and recorded within the SWATHplus acquisition software (SEA Swath Processor (2005)), which established the motion sensor as the common reference point during data acquisition.
Speed of Sound: Sound-velocity profiles were collected approximately every 2 hours by a hand-casted Applied MicroSystems SV Plus sound velocimeter. The depth of the transducers below the sea surface was measured and recorded within the SWATHplus acquisition software, and used as a reference point for deriving the acoustic ray path based on sound velocity profiles.
Tides: During post-processing, soundings were referenced to local MLLW by using orthometric to chart datum offsets obtained from NOAA Tidal Station #8446009 at Brant Rock Harbor, Massachusetts. Data were processed and gridded by using the SEA SWATHplus Swath Processor (version 10.0) CARIS Hydrographic Information Processing System (HIPS version 6.1).
Person who carried out this activity:
508-548-8700 x2348 (voice)
508-457-2310 (FAX)
bandrews@usgs.gov
Person who carried out this activity:
508-548-8700 x2348 (voice)
508-457-2310 (FAX)
bandrews@usgs.gov
B. The files extracted from CARIS HIPS have 4-5 navigation fixes per second. Each file was subsampled to 1 fix per second by using AWK (see code below) to remove the fractions-of-a-second from the time column then grabbing the first occurrence of each second. > awk '{print $1" "substr($2,1,8)" "$3" "$4" "$5}' greped_combined.txt | awk '$2 != prev { print; prev = $2 }' > 2.CCB_NAV_awked.txt
C. Checked that there were no additional spurious fixes outside the survey area using another series of AWK code (see code below), and reformatted for conversion from comma separated value (CSV) data to ESRI point feature class > awk -F" " '{if(substr($4,1,3)=="-70") print $0}' 2.* | awk -F" " '{if(substr($3,1,1)=="4") print $0}'| awk -f reformat_CARIS2Arc_CCB.awk > CCB_bathyNAV_all.csv
Person who carried out this activity:
508-548-8700 x2315 (voice)
508-457-2310 (FAX)
sackerman@usgs.gov
Person who carried out this activity:
508-548-8700 x2315 (voice)
508-457-2310 (FAX)
sackerman@usgs.gov
Person who carried out this activity:
508-548-8700 x2348 (voice)
508-457-2310 (FAX)
bandrews@usgs.gov
Barnhardt, Walter A. , Andrews, Brian D. , and Butman, Bradford, 2006, High-Resolution Mapping of the Inner Continental Shelf: Nahant to Gloucester, Massachusetts: Open-File Report 2005-1293, U.S. Geological Survey, Coastal and Marine Geology Program, Woods Hole Science Center, Woods Hole, Massachusetts.Online Links:
Ackerman, Seth D. , Butman, Bradford, Barnhardt, Walter A. , Danforth, William W. , and Crocker, James M. , 2006, High-Resolution Geologic Mapping of the Inner Continental Shelf: Boston Harbor and Approaches, Massachusetts: Open-File Report 2006-1008, U.S. Geological Survey, Coastal and Marine Geology Program, Woods Hole Science Center, Woods Hole, Massachusetts.Online Links:
Barnhardt, Walter A. , Andrews, Brian D. , Ackerman, Seth D. , Baldwin, Wayne E. , and Hein, Christopher J. , 2009, High-Resolution Geological Mapping of the Inner Continental Shelf: Cape Ann to Salisbury Beach, Massachusetts: Open-File Report 2007-1373, U.S. Geological Survey, Coastal and Marine Geology Program, Woods Hole Science Center, Woods Hole, Massachusetts.Online Links:
Barnhardt, Walter A. , Ackerman, Seth D. , Andrews, Brian D. , and Baldwin, Wayne E. , 2010, Geophysical and Sampling Data from the Inner Continental Shelf: Duxbury to Hull, Massachusetts: Open-File Report 2009-1072, U.S. Geological Survey, Coastal and Marine Geology Program, Woods Hole Science Center, Woods Hole, Massachusetts.Online Links:
All attributes were checked in a consistent manner.
Field activity 06012: The SWATHplus transducers were mounted on a rigid pole, approximately 2.6 m below the water line, along the starboard side of the R/V Megan T. Miller. Position data were provided by an Ashtech Z-Surveyor Extreme for real-time kinematic (RTK) navigation (an Ashtech BR2G Differential Global Positioning System (DGPS) was used as a backup navigation system) and recorded to the raw data files (SXR) via Swath Processor (version 2.07) acquisition software. During some portions of the survey, technical difficulties caused the GPS systems to malfunction and lose the "fixed" RTK signal. When this occurred, the navigation system defaulted to a "float" RTK, and then to a GPS (stand alone) signal, after which the navigation signal was lost completely. Surveying was halted until a reliable GPS signal was restored. A conservative estimate of positional accuracy is +/- 2 meters, but when the navigation system was providing the "fixed" RTK signal, positional accuracy is <1 m.
Field activities 07001, 07002, and 08002: The SWATHplus transducers were mounted on a rigid pole from the bow of the R/V Rafael, approximately 0.5 m below the water line during surveys 07001 and 08001, and 2.6 m below the water line on the starboard side for survey 07002. Position data were recorded by Hypack software to Hypack raw files using an Ashtech Z-Surveyor Extreme for real-time kinematic (RTK) navigation, and an Ashtech BR2G for Differential Global Positioning System (DGPS) navigation. DGPS navigation from the primary F180 antenna was recorded to the raw sonar data files (SXR) via SWATHplus acquisition software. A conservative estimate of positional accuracy is +/- 2 meters.
Based on SWATHplus interferometric sonar system specifications, vertical accuracy of the raw data may approximate 1% of water depth, which translates to 0.1 0.6 meters within the northern Cape Cod Bay survey area. RTK-GPS was used to establish water-level heights relative to Mean Lower Low Water (MLLW), providing decimeter-scale accuracies. Tide-correction was done in post-processing (see process steps). Refraction artifacts were minimized by acquiring a range of sound velocity profiles throughout the survey area to model the sound velocity structure of the water column. Changes in vessel draft due to fuel and water usage were not considered.
Only the subsets of interferometric bathymetric sonar collected during field activities 06012 and 07001 that are within the study area in the northern Cape Cod Bay survey area south of Brant Rock, Massachusetts and have been included in this spatial dataset. This shapefile includes all bathymetric tracklines collected in the northern Cape Cod Bay survey area, however, not all of these tracklines were included in the final bathymetric grid published in this same report. Data collected along transit lines, east-west seismic tie lines, and other lines of poor quality were excluded from this grid. The " Mosaic" attribute in this shapefile identifies the 528 lines that were included and the 60 lines that were not included in the final grid.
Any spurious data points were removed during processing. Duplicate names may exist for the linename attribute; however further querying the data by the "Survey", "Device", or "JD" attributes will distinguish a unique trackline for each record in this spatial dataset.
Are there legal restrictions on access or use of the data?
- Access_Constraints: None
- Use_Constraints:
- Public domain data from the U.S. Government are freely redistributable with proper metadata and source attribution. Please recognize the U.S. Geological Survey (USGS) as the source of this information.
508-548-8700 x2348 (voice)
bandrews@usgs.gov
Downloadable Data
Neither the U.S. Government, the Department of the Interior, nor the USGS, nor any of their employees, contractors, or subcontractors, make any warranty, express or implied, nor assume any legal liability or responsibility for the accuracy, completeness, or usefulness of any information, apparatus, product, or process disclosed, nor represent that its use would not infringe on privately owned rights. The act of distribution shall not constitute any such warranty, and no responsibility is assumed by the USGS in the use of these data or related materials. Any use of trade, product, or firm names is for descriptive purposes only and does not imply endorsement by the U.S. Government.
| Data format: | Survey tracklines for SWATHplus bathymetric data collected offshore of Massachusetts within northern Cape Cod Bay. in format SHP (version ArcGIS 9.3) ESRI polyline shapefile Size: 12 Mb |
|---|---|
| Network links: |
<https://pubs.usgs.gov/of/2010/1006/GIS/shapefile/CCB_BathTracklines.zip> |
| Media you can order: |
DVD-ROM
(Density 4.75
Gbytes)
(format UDF)
|
This zip file contains data available in Environmental Systems Research Institute (ESRI) shapefile format. The user must have software capable of uncompressing the WinZip file and displaying the shapefile. In lieu of ArcView or ArcGIS, the user may utilize another GIS application package capable of importing the data. A free data viewer, ArcExplorer, capable of displaying the data is available from ESRI at www.esri.com.
508-548-8700 x2348 (voice)
508-457-2310 (FAX)
bandrews@usgs.gov