Skip past header information
USGS - science for a changing world
EPA Logo with link to EPA Home Page.  

U.S. Geological Survey Open-File Report 2010-1251

Moderate-Resolution Sea Surface Temperature Data for the Nearshore North Pacific


Skip past contents information| Title Page | Contents | List of Figures | Acronyms and Abbreviations | Conversion Factors | Abstract | Introduction | Data Description | Data Processing | GIS Data Catalog | Access Databases | Scripts | Acknowledgments | References Cited |


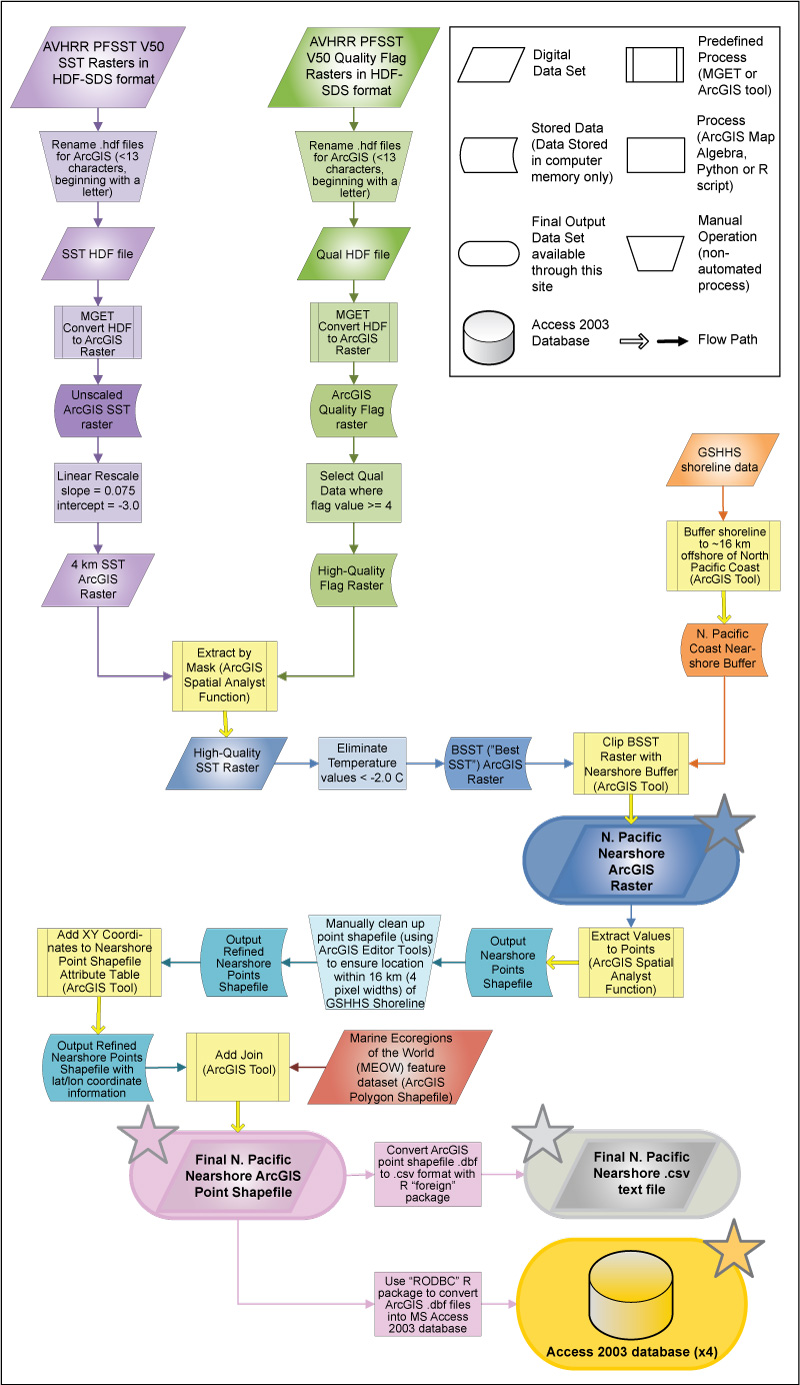
Figure 1, flow chart of data processing steps.


Figure 1. Flowchart detailing the data processing steps taken to convert AVHRR Pathfinder 4 km HDF data into North Pacific nearshore SST data in the form of ESRI GRIDs, ESRI shapefiles, text .csv files, and Access 2003 Databases. The flowchart color scheme emphasizes the relation of a particular input to its processes and outputs by using the same shades. New inputs or inputs derived through the combination of previous outputs have unique colors. Yellow rectangular boxes denote pre-existing (canned) MGET or ArcGIS tools used in processing. The final products marked with star symbols represent the datasets available through this report.

Download the flow chart in PDF format (250 KB).


To view files in PDF format, download a free copy of Adobe Reader.


Accessibility FOIA Privacy Policies and Notices

Take Pride in America logo USA.gov logo U.S. Department of the Interior | U.S. Geological Survey
URL: http://pubsdata.usgs.gov/pubs/of/2010/1251/figure1.html
Page Contact Information: GS Pubs Web Contact
Page Last Modified: Wednesday, 07-Dec-2016 23:21:48 EST