CLIPNOAASHORE.SHP: National Ocean Service Coastline for a Part of the Northeastern United States in the Long Island, New York Area

Metadata also available as - [Outline] - [Parseable text] - [XML]

Frequently-anticipated questions:


What does this data set describe?

Title:
CLIPNOAASHORE.SHP: National Ocean Service Coastline for a Part of the Northeastern United States in the Long Island, New York Area
Abstract:
NOAA's Medium Resolution Digital Vector Shoreline is a high-quality, Geographic Information System-ready, general-use digital vector dataset containing the coastline of the contiguous United States of America. The shoreline was created from data captured (digitized from scanned images of the master separates of the NOS Charts) from over 270 National Ocean Service Navigation Charts and spans some 80,000 nautical miles at an average map scale of 1:70,000.
This product created by the Strategic Environmental Assessments (SEA) Division of NOAA's Office of Ocean Resources Conservation and Assessment comprises over 75,000 nautical miles of coastline (nearly 2.5 million vertices), representing the entire conterminous United States of America. Alaska, the Hawaiian Islands, Puerto Rico, and all other interests and territories of the United States are not included in the collection.
The dataset is designed for a broad target audience ranging from governmental agencies, universities and other research institutions, to the private sector, and students, as well as any other concern requiring a general purpose digital shoreline layer for GIS and cartographic projects.
Supplemental_Information:
Generally, 1:80,000 NOAA coast charts took precedence and were used when available. For areas where 1:80,000 charts were not readily available, charts with the next closest higher scale (e.g., 1:60,000) were used down to the highest scale available. Alternately, if higher scale charts were not available, charts of the closest lower scale (e.g., 1:100,000) were used down to the lowest scale. The digital shoreline for Florida was obtained from the state. This digital file was originally created from NOAA nautical charts and was not recreated by SEA. Generally, for these shoreline sections (EC80_06, GC80_05, and GC80_06), the highest scale charts available were used to digitize the shoreline. The resultant average mapping scale for the entire Medium Resolution Digital Vector Shoreline is approximately 1:70,000. See NOAA's Medium Resolution Digital Vector Shoreline website for more details on this product: <http://coastalgeospatial.noaa.gov/shoreline.html> >
  1. How should this data set be cited?

    National Oceanic and Atmospheri, National Ocean Service (NOS), Office of , 1994, CLIPNOAASHORE.SHP: National Ocean Service Coastline for a Part of the Northeastern United States in the Long Island, New York Area: NOAA/NOS/ORCA/SEA, Silver Spring, MD.

    Online Links:

    This is part of the following larger work.

    Cross, V.A., Bratton, J.F., Kroeger, K.D., Crusius, J., and Worley, C.R., 2011, Continuous Resistivity Profiling Data from Great South Bay, Long Island, New York: Open-File Report 2011-1040, U.S. Geological Survey, Coastal and Marine Geology Program, Woods Hole Coastal and Marine Science Center, Woods Hole, MA.

    Online Links:

  2. What geographic area does the data set cover?

    West_Bounding_Coordinate: -74.048314
    East_Bounding_Coordinate: -71.726373
    North_Bounding_Coordinate: 41.406037
    South_Bounding_Coordinate: 40.542912

  3. What does it look like?

    <https://pubs.usgs.gov/of/2011/1040/data/basemap/clipnoaashore.gif> (GIF)
    Thumbnail image of the NOAA medium-resolution coast in the study area.

  4. Does the data set describe conditions during a particular time period?

    Calendar_Date: 1994
    Currentness_Reference: publication date

  5. What is the general form of this data set?

    Geospatial_Data_Presentation_Form: vector digital data

  6. How does the data set represent geographic features?

    1. How are geographic features stored in the data set?

      This is a Vector data set. It contains the following vector data types (SDTS terminology):

      • G-polygon (1)

    2. What coordinate system is used to represent geographic features?

      Horizontal positions are specified in geographic coordinates, that is, latitude and longitude. Latitudes are given to the nearest 0.000001. Longitudes are given to the nearest 0.000001. Latitude and longitude values are specified in Decimal degrees.

      The horizontal datum used is North American Datum of 1983.
      The ellipsoid used is Geodetic Reference System 80.
      The semi-major axis of the ellipsoid used is 6378137.000000.
      The flattening of the ellipsoid used is 1/298.257222.

      Vertical_Coordinate_System_Definition:
      Altitude_System_Definition:
      Altitude_Datum_Name: National Geodetic Vertical Datum of 1929
      Altitude_Encoding_Method:
      Horizontal positions of the shoreline are based on a vertical tidal datum. This is typically Mean Lower Low Water but can vary. Consult the appropriate charts for additional information.

  7. How does the data set describe geographic features?

    clipnoaashore
    shapefile attribute table. (Source: ESRI)

    FID
    Internal feature number. (Source: ESRI)

    Sequential unique whole numbers that are automatically generated.

    Shape
    Feature geometry. (Source: ESRI)

    Coordinates defining the features.

    ID
    Attribute included in the original dataset without a definition. (Source: Unknown.)

    Unknown definition or units.


Who produced the data set?

  1. Who are the originators of the data set? (may include formal authors, digital compilers, and editors)

  2. Who also contributed to the data set?

    Please credit National Oceanic and Atmospheric Administration (NOAA), National Ocean Service (NOS), Office of Coast Survey, and the Strategic Environmental Assessments (SEA) Division of the Office of Ocean Resources Conservation and Assessment (ORCA) as the originator of the dataset.

  3. To whom should users address questions about the data?

    Steve Rohmann
    NOAA/NOS/SEA/ORCA
    NOAA
    Silver Spring, MD 20910
    USA

    (301) 713-3000 x137 (voice)
    (301) 713-4384 (FAX)
    srohmann@seamail.nos.noaa.gov


Why was the data set created?

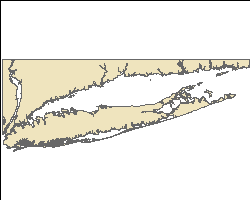
The purpose of this dataset is to provide the NOAA medium-resolution shoreline as a basemap data layer for the area of interest.


How was the data set created?

  1. From what previous works were the data drawn?

    (source 1 of 1)
    Type_of_Source_Media: paper
    Source_Scale_Denominator: 80000

  2. How were the data generated, processed, and modified?

    Date: 2006 (process 1 of 2)
    Within ArcMap 9.2, a polygon graphic was converted to a polygon shapefile using XToolsPro v. 5.2 using the Feature Conversion - Graphics to Feature tool.

    Person who carried out this activity:

    VeeAnn A. Cross
    U.S. Geological Survey
    Marine Geologist
    Woods Hole Coastal and Marine Science Center
    Woods Hole, MA 02543-1598

    (508) 548-8700 x2251 (voice)
    (508) 457-2310 (FAX)
    vatnipp@usgs.gov

    Data sources used in this process:
    • graphic

    Data sources produced in this process:

    • temprect.shp

    Date: 2006 (process 2 of 2)
    Within ArcMap 9.2 - ArcToolbox - Analysis Tools - Extract - Clip. The original NOAA polygon coastline shapefile was clipped with the new polygon shapefile. No XY tolerance was set. (The original NOAA polygon coastline was downloaded from the internet in 2002.)

    Person who carried out this activity:

    VeeAnn A. Cross
    U.S. Geological Survey
    Marine Geologist
    Woods Hole Coastal and Marine Science Center
    Woods Hole, MA 02543-1598

    (508) 548-8700 x2251 (voice)
    (508) 457-2310 (FAX)
    vatnipp@usgs.gov

    Data sources used in this process:
    • temprect.shp
    • mergefinal.shp

    Data sources produced in this process:

    • clipnoaashore.shp

  3. What similar or related data should the user be aware of?


How reliable are the data; what problems remain in the data set?

  1. How well have the observations been checked?

  2. How accurate are the geographic locations?

    According to NOAA, the data supplied here are a compilation of information collected from some 270+ current or pre-release National Ocean Service (NOS) Navigation Charts. In compiling this product we made no attempt to ascertain the congruency between the charted data and the real world. Our objective was to simply capture the representative coastline as provided to us via the NOS Chart. Every effort was made to capture the shoreline on these charts as faithfully as our skills and technology allowed, and there is every indication that we were successful. In doing so, however, we automatically conveyed the character (all aspects, both good and bad) of those data to our digital product. Because this character may or may not be in agreement with the real world, the user is advised to exercise caution in making any assumptions about the fallibility, or infallibility, of the spatial information supplied here, especially when circumstances warrant a high degree of absolute positional accuracy. Spatial data were derived directly from NOS Navigation Charts, which meet or exceed National Map Accuracy standards (hard copy); the digital data supplied in this compilation, when plotted at scale, should meet or exceed these same cartographic standards.

  3. How accurate are the heights or depths?

  4. Where are the gaps in the data? What is missing?

    This dataset supplies the complete shoreline in the area of interest.

  5. How consistent are the relationships among the observations, including topology?

    The original NOAA shoreline was clipped to the area of interest. No additional checks on shoreline accuracy were performed.


How can someone get a copy of the data set?

Are there legal restrictions on access or use of the data?

Access_Constraints: None.
Use_Constraints:
These data are not to be used for navigation purposes. Mariners should refer to the appropriate nautical chart. Public domain data from the U.S. Government are freely redistributable with proper metadata and source attribution.

  1. Who distributes the data set? (Distributor 1 of 1)

    Steve Rohm
    NOAA, N/ORCA1
    NOAA
    Silver Spring, MD 20910
    USA

    (301) 713-3000 x137 (voice)
    (301) 713-4384 (FAX)
    rohmann@seamail.nos.noaa.gov

  2. What's the catalog number I need to order this data set?

    Downloadable Data: Medium Resolution Digital Vector U.S. Shoreline [OL 72 18.7 -66.5 -168]

  3. What legal disclaimers am I supposed to read?

    Although this data has been processed successfully on a computer system at NOAA, no warranty, expressed or implied, is made by NOAA regarding the utility of the data on any other system, nor shall the act of distribution constitute any such warranty. NOAA warrants the delivery of this product in computer-readable format, and will offer a replacement copy of the product when the product is determined unreadable by computer input peripherals, or when the physical medium is delivered in damaged condition.

  4. How can I download or order the data?

  5. What hardware or software do I need in order to use the data set?

    This WinZip file contains data available in ESRI polygon shapefile format. The user must have software capable of uncompressing the WinZip file and reading/displaying the shapefile.


Who wrote the metadata?

Dates:
Last modified: 31-Aug-2012
Metadata author:
VeeAnn A. Cross
U.S. Geological Survey
Marine Geologist
Woods Hole Coastal and Marine Science Center
Woods Hole, MA 02543-1598

(508) 548-8700 x2251 (voice)
(508) 457-2310 (FAX)
vatnipp@usgs.gov

Metadata standard:
FGDC Content Standards for Digital Geospatial Metadata (FGDC-STD-001-1998)
Metadata extensions used:


Generated by mp version 2.9.6 on Fri Aug 31 13:33:17 2012