Open-File Report 2013–1063
Red Sheep Creek
Provisional Data Access (Large file will open in new window)
Figures [ Click to view a Julian Day Reference Calendar (in new window) ]
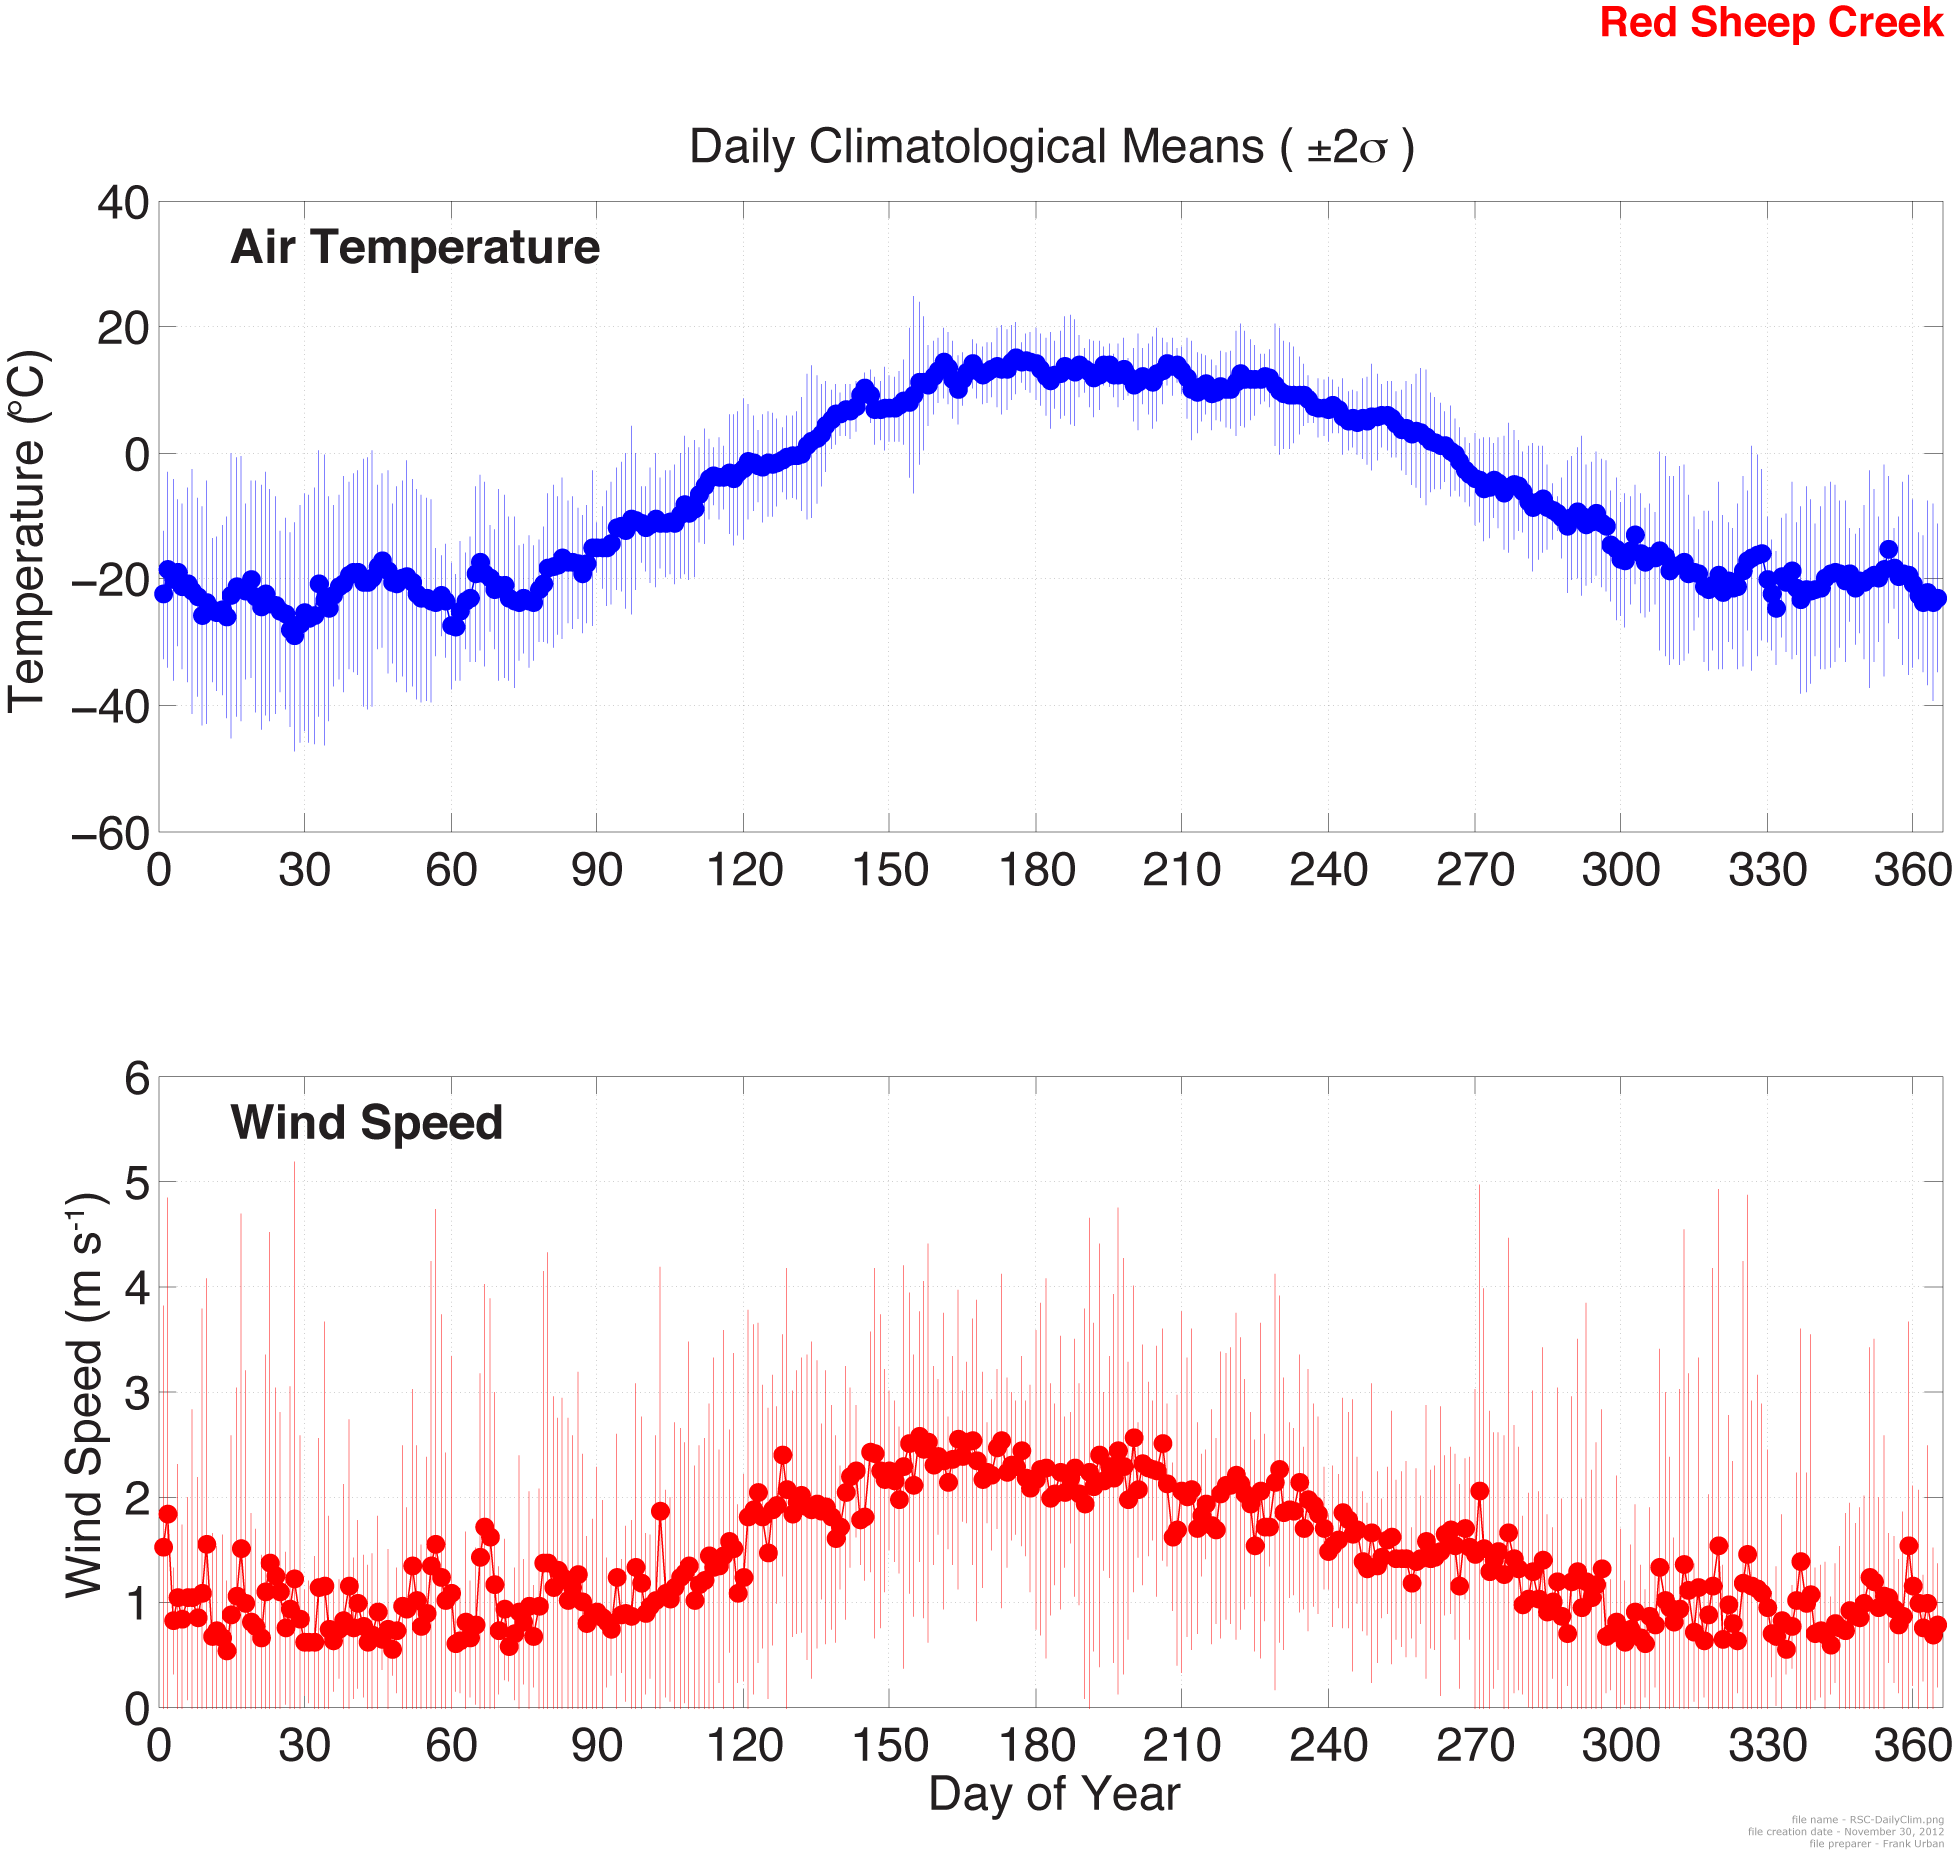
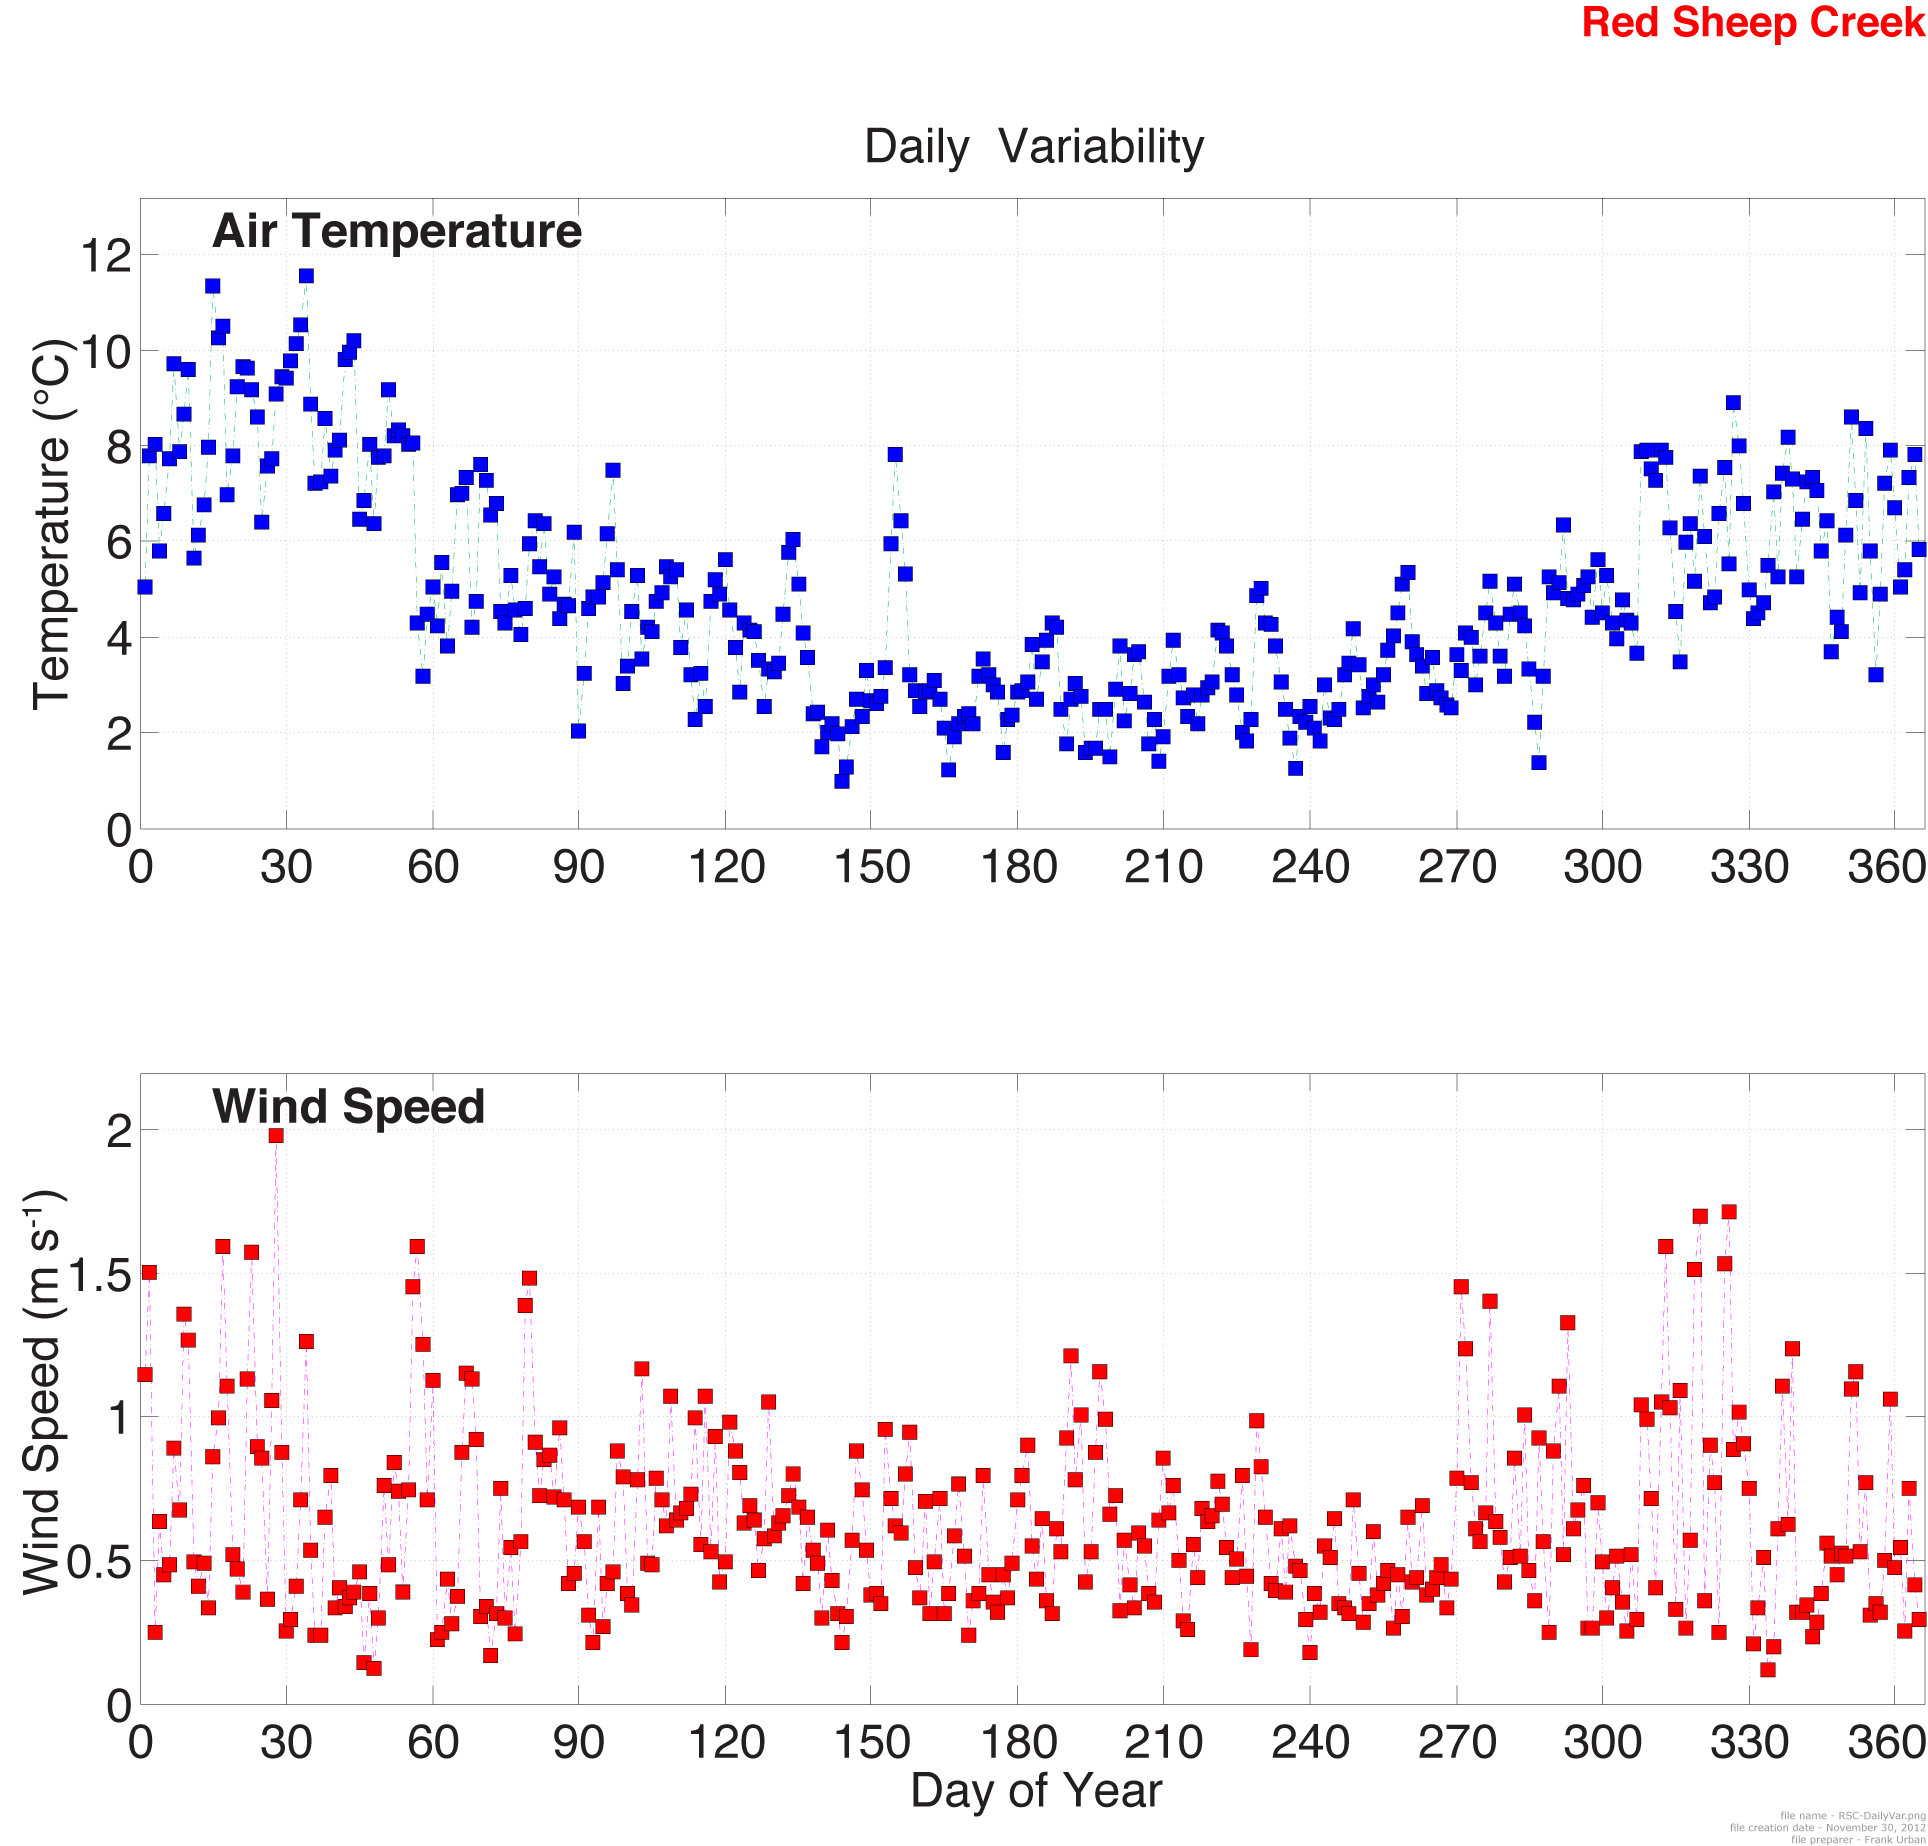
TablesTable 1a. Statistical summaries of provisional air temperature data at monthly resolution—average, minimum, maximum, anomaly, and percentage of data available. Anomalies are calculated relative to the entire available period of record for the given site. 95% of the data must be available in order to calculate statistics. Periods with less than the 95% requirement are represented by NaN (not a number).Site name: Red Sheep Creek Variable: Temperature (°C) Date of preparation: 30-Nov-2012 Name of preparer: Frank Urban Monthly Averages: Year JAN FEB MAR APR MAY JUN JUL AUG SEP OCT NOV DEC 2004 NaN NaN NaN NaN NaN NaN NaN NaN -2.37 -11.64 -20.78 -22.12 2005 -21.37 -21.63 -14.72 -7.99 6.75 12.62 11.07 10.22 1.58 -9.20 -21.73 -16.74 2006 -26.39 -18.34 -21.29 -11.13 3.19 10.37 11.56 8.32 5.33 -7.26 -21.97 -16.83 2007 -20.55 -23.83 -24.51 -6.61 2.17 13.24 15.02 10.66 1.72 -11.21 -13.97 -19.97 2008 -25.28 -21.79 -18.46 -8.10 2.89 12.14 11.46 7.01 0.44 -15.18 -16.98 -22.70 2009 -24.30 -22.85 -23.82 -9.91 NaN NaN NaN NaN NaN NaN NaN NaN 2010 NaN NaN NaN NaN NaN NaN NaN NaN 2.44 -8.52 -14.13 -26.13 2011 -19.92 -23.43 -18.26 -11.94 NaN NaN NaN NaN 2.88 -8.37 -24.12 -19.96 Minimum Value Each Month: Year JAN FEB MAR APR MAY JUN JUL AUG SEP OCT NOV DEC 2004 NaN NaN NaN NaN NaN NaN NaN NaN -15.82 -24.82 -34.92 -36.53 2005 -35.75 -35.07 -26.14 -25.39 -6.30 0.77 0.53 -2.09 -11.50 -23.05 -33.89 -34.82 2006 -39.48 -39.38 -36.86 -26.49 -14.29 -9.28 4.12 -1.17 -2.35 -21.17 -29.72 -33.34 2007 -36.97 -40.63 -39.01 -19.88 -16.65 3.06 6.37 0.36 -11.73 -23.28 -23.20 -36.01 2008 -39.64 -37.00 -34.06 -23.52 -6.30 0.47 1.97 -2.42 -12.95 -30.18 -31.83 -34.92 2009 -38.24 -37.59 -34.87 -28.62 NaN NaN NaN NaN NaN NaN NaN NaN 2010 NaN NaN NaN NaN NaN NaN NaN NaN -14.94 -20.39 -34.18 -36.01 2011 -37.59 -38.06 -31.04 -27.22 NaN NaN NaN NaN -9.34 -23.06 -32.83 -33.06 Maximum Value Each Month: Year JAN FEB MAR APR MAY JUN JUL AUG SEP OCT NOV DEC 2004 NaN NaN NaN NaN NaN NaN NaN NaN 10.07 2.37 -7.97 -7.24 2005 -1.31 -9.47 -5.95 14.04 16.61 24.30 21.43 24.77 9.28 3.14 -2.84 -3.18 2006 -12.75 0.83 -3.88 0.35 13.57 20.85 20.23 19.09 15.99 2.63 -11.92 -4.80 2007 -7.04 -3.47 -4.72 6.00 15.42 23.72 23.35 19.09 14.67 0.95 -1.26 -8.02 2008 -7.16 -0.57 -2.85 3.65 15.31 23.64 21.20 16.29 14.59 0.51 -6.55 -4.07 2009 0.97 -8.27 -6.33 12.10 NaN NaN NaN NaN NaN NaN NaN NaN 2010 NaN NaN NaN NaN NaN NaN NaN NaN 14.45 6.25 -1.55 -9.57 2011 1.01 -5.61 0.83 2.50 NaN NaN NaN NaN 14.68 2.65 -9.93 -7.19 Anomaly Relative to the Climatological Mean: Year JAN FEB MAR APR MAY JUN JUL AUG SEP OCT NOV DEC 2004 NaN NaN NaN NaN NaN NaN NaN NaN -4.09 -1.44 -1.68 -1.48 2005 2.19 -0.26 5.85 0.89 3.29 0.27 -1.37 1.17 -0.14 1.00 -2.63 3.90 2006 -2.83 3.04 -0.72 -2.24 -0.27 -1.98 -0.88 -0.73 3.62 2.94 -2.88 3.80 2007 3.01 -2.46 -3.94 2.28 -1.29 0.88 2.57 1.61 0.00 -1.01 5.13 0.67 2008 -1.72 -0.42 2.12 0.78 -0.57 -0.21 -0.99 -2.04 -1.28 -4.99 2.11 -2.06 2009 -0.74 -1.47 -3.25 -1.03 NaN NaN NaN NaN NaN NaN NaN NaN 2010 NaN NaN NaN NaN NaN NaN NaN NaN 0.72 1.68 4.97 -5.49 2011 3.64 -2.06 2.31 -3.05 NaN NaN NaN NaN 1.17 1.83 -5.02 0.67 Percent of Data Available during Each Month: Year JAN FEB MAR APR MAY JUN JUL AUG SEP OCT NOV DEC 2004 0.00 0.00 0.00 0.00 0.00 0.00 0.00 0.00 100.00 100.00 100.00 100.00 2005 100.00 100.00 100.00 100.00 100.00 100.00 100.00 100.00 100.00 100.00 100.00 100.00 2006 100.00 100.00 100.00 100.00 100.00 100.00 100.00 99.60 100.00 100.00 100.00 100.00 2007 100.00 100.00 100.00 100.00 100.00 100.00 100.00 100.00 100.00 100.00 100.00 100.00 2008 100.00 100.00 100.00 100.00 100.00 100.00 100.00 100.00 100.00 100.00 100.00 100.00 2009 100.00 100.00 100.00 100.00 84.01 0.00 0.00 0.00 0.00 0.00 0.00 0.00 2010 0.00 0.00 0.00 0.00 0.00 0.00 0.00 39.78 100.00 100.00 100.00 100.00 2011 100.00 100.00 100.00 100.00 63.17 0.00 0.00 20.97 100.00 100.00 100.00 100.00
Table 1b. Statistical summaries of provisional wind speed data at monthly resolution—average, maximum, and percentage of data available. 95% of the data must be available in order to calculate statistics. Periods with less than the 95% requirement are represented by NaN (not a number). Site name: Red Sheep Creek Variable: Wind Speed (m s-1) Date of preparation: 30-Nov-2012 Name of preparer: Frank Urban Monthly Averages: Year JAN FEB MAR APR MAY JUN JUL AUG SEP OCT NOV DEC 2004 NaN NaN NaN NaN NaN NaN NaN NaN NaN 0.70 0.64 0.98 2005 1.00 NaN 1.42 1.05 1.95 2.44 2.57 1.98 1.73 1.13 1.39 NaN 2006 0.51 1.14 0.79 1.33 1.92 2.70 2.40 1.83 1.26 1.11 0.98 0.93 2007 0.79 0.75 0.91 1.19 1.63 2.27 2.01 1.73 1.60 1.11 0.94 0.84 2008 1.10 1.07 1.19 1.31 2.25 2.19 1.96 1.82 1.41 1.11 1.09 0.81 2009 0.91 NaN 0.90 0.85 2.09 2.16 1.94 1.90 1.38 1.13 0.71 1.06 2010 NaN 1.10 1.28 1.40 2.30 2.26 2.17 1.62 1.32 1.19 NaN NaN 2011 0.90 1.03 0.60 1.29 NaN NaN NaN NaN 1.59 0.87 0.93 1.13 Maximum Value Each Month: Year JAN FEB MAR APR MAY JUN JUL AUG SEP OCT NOV DEC 2004 NaN NaN NaN NaN NaN NaN NaN NaN NaN 4.39 5.63 6.37 2005 6.72 NaN 8.77 5.60 5.25 6.06 6.79 6.19 5.88 5.36 7.16 NaN 2006 6.40 6.80 5.51 6.50 5.85 7.99 7.21 7.03 4.95 6.04 8.45 5.95 2007 5.69 5.13 5.11 6.48 7.28 6.08 7.94 5.57 5.52 4.55 6.37 6.85 2008 8.95 6.47 7.16 6.65 6.54 6.11 5.85 4.80 4.56 6.71 5.78 5.27 2009 8.41 NaN 5.41 5.02 5.32 5.71 6.64 5.53 4.59 5.98 5.06 6.13 2010 NaN 6.24 7.21 5.57 6.10 6.39 6.14 5.21 5.93 5.47 NaN NaN 2011 7.85 9.68 3.93 8.17 NaN NaN NaN NaN 5.25 4.49 7.11 7.73 Percent of Data Available during Each Month: Year JAN FEB MAR APR MAY JUN JUL AUG SEP OCT NOV DEC 2004 0.00 0.00 0.00 0.00 0.00 0.00 0.00 0.00 94.58 96.64 96.25 100.00 2005 100.00 94.94 100.00 100.00 100.00 100.00 100.00 100.00 99.17 100.00 100.00 76.08 2006 100.00 100.00 100.00 100.00 100.00 100.00 100.00 99.60 100.00 98.52 100.00 100.00 2007 100.00 100.00 100.00 100.00 100.00 100.00 100.00 100.00 100.00 100.00 100.00 100.00 2008 100.00 100.00 100.00 100.00 100.00 100.00 100.00 100.00 100.00 100.00 100.00 100.00 2009 100.00 84.97 100.00 100.00 100.00 100.00 100.00 99.73 99.03 100.00 100.00 100.00 2010 93.28 100.00 100.00 100.00 100.00 100.00 100.00 99.87 100.00 100.00 77.92 88.04 2011 100.00 100.00 100.00 100.00 63.17 0.00 0.00 20.97 100.00 100.00 100.00 100.00
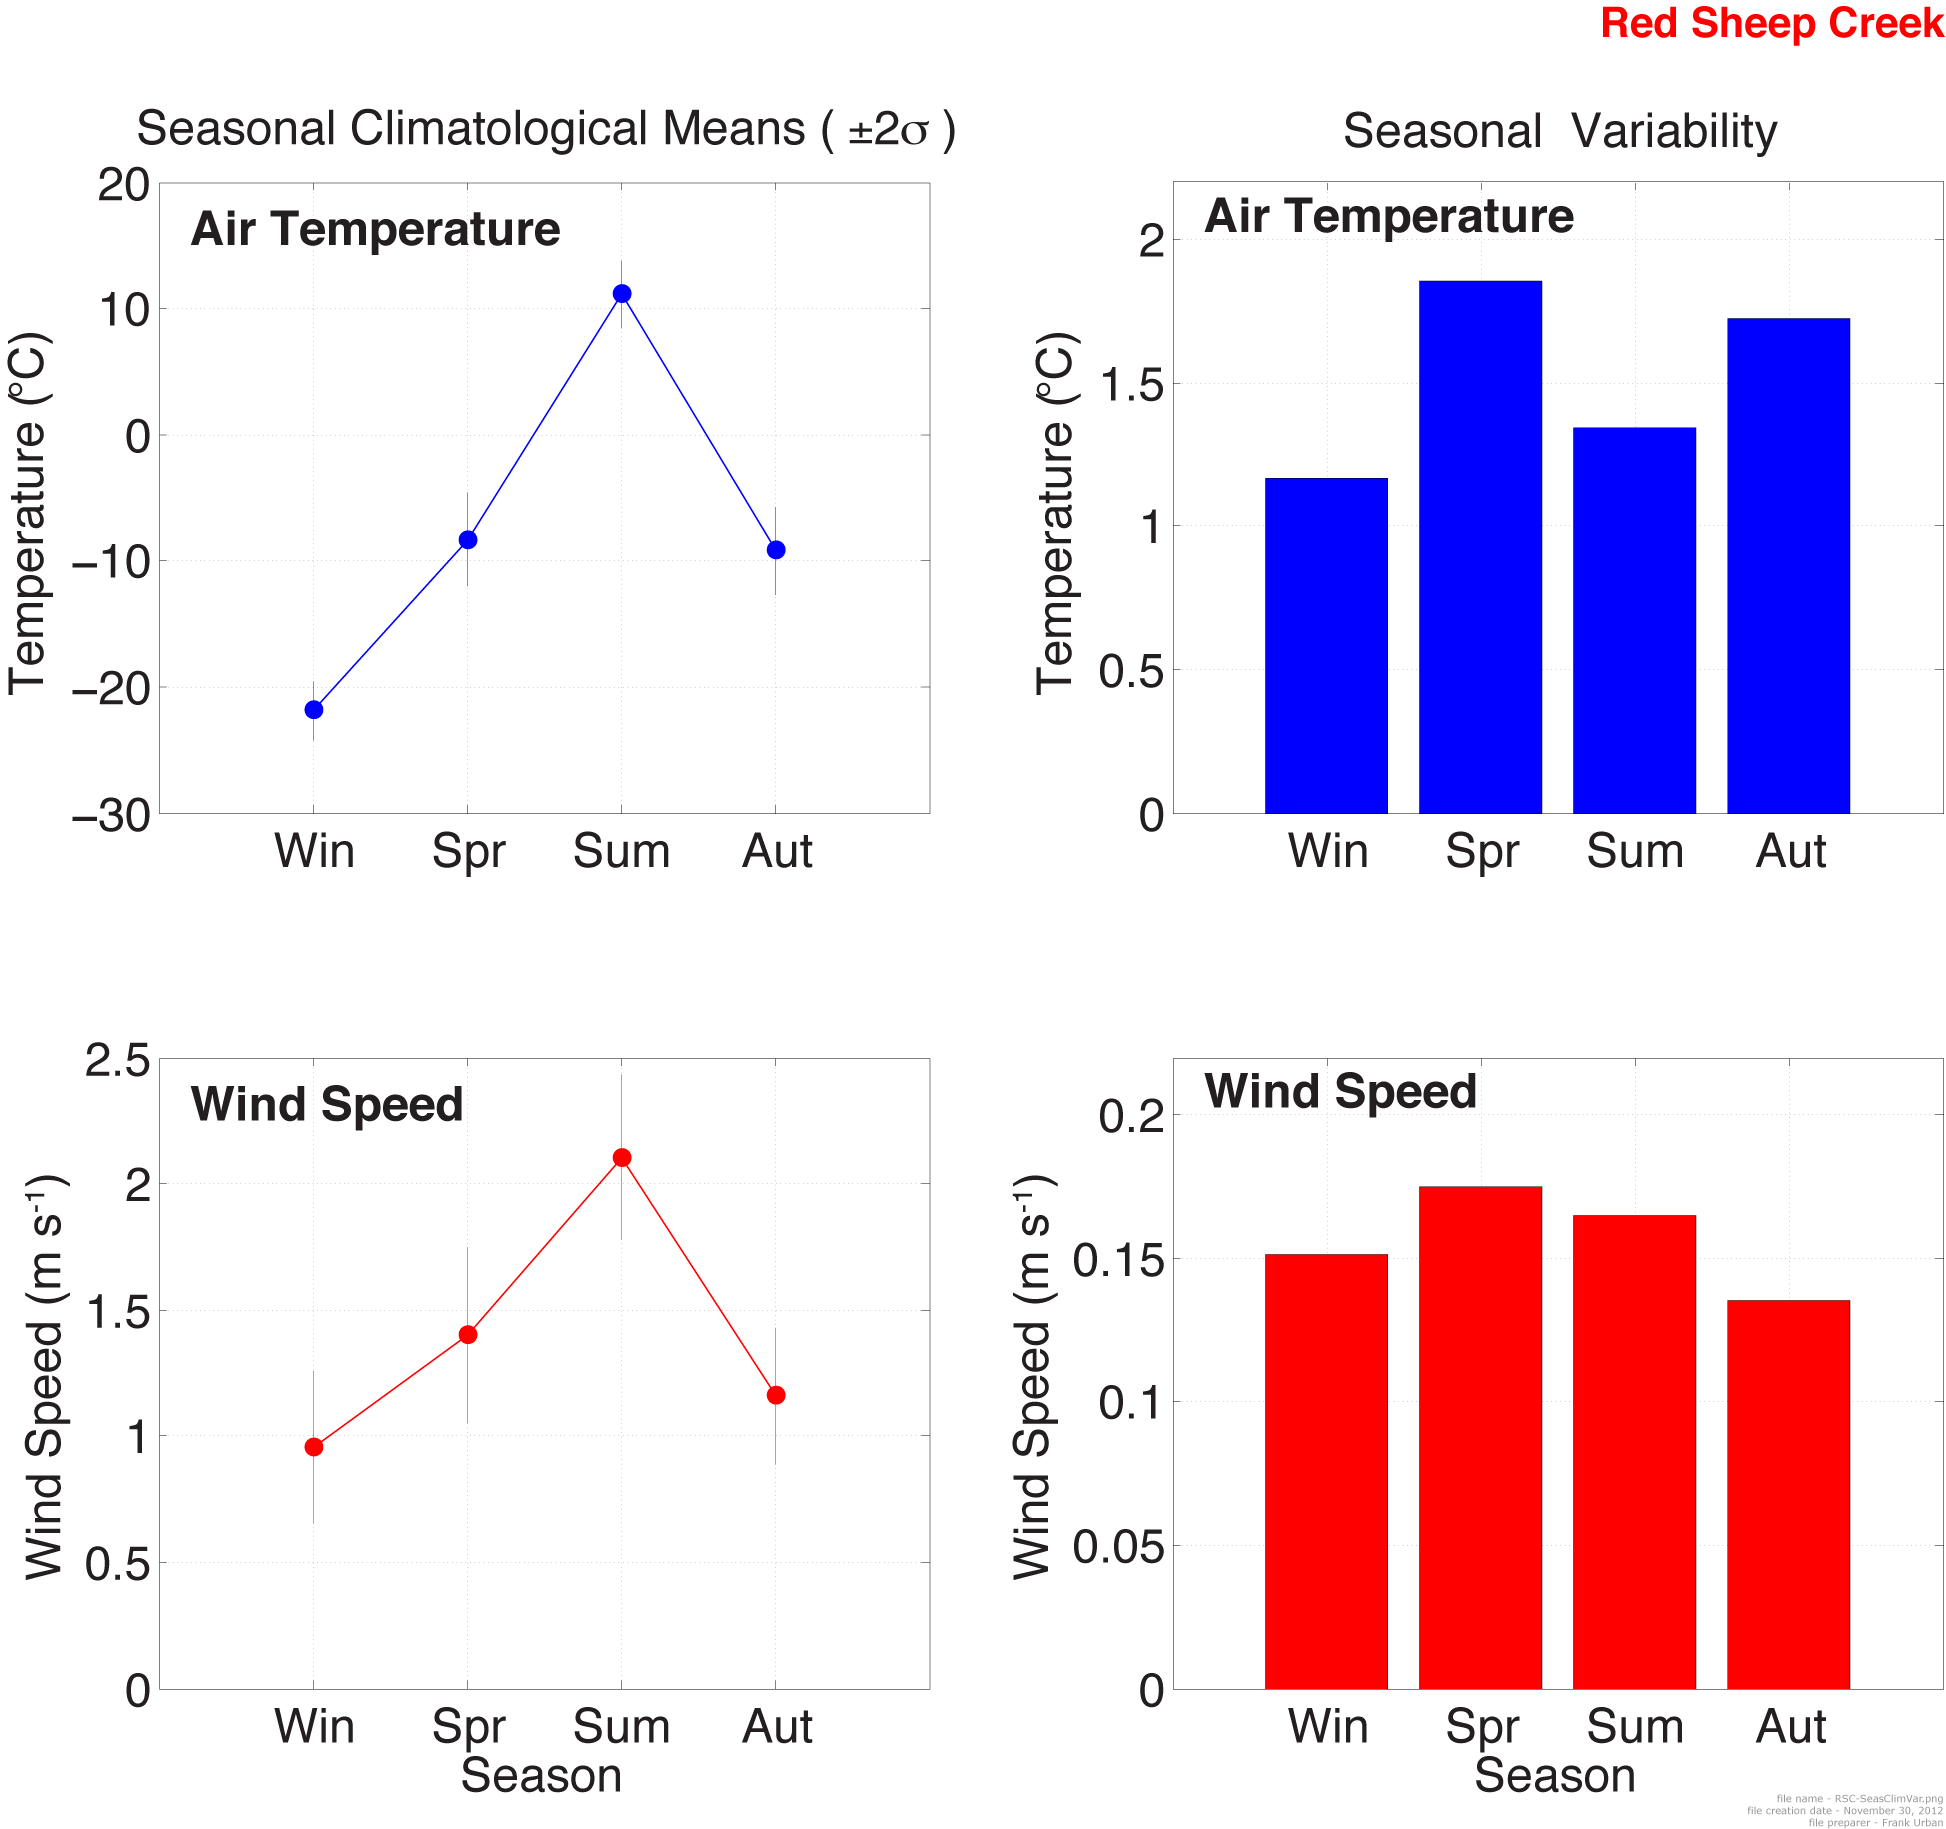
Table 2a. Statistical summaries of provisional air temperature data at seasonal and annual resolution—average, minimum, maximum, anomaly, and percentage of data available. Anomalies are calculated relative to the entire available period of record for the given site. 95% of the data must be available in order to calculate statistics. Periods with less than the 95% requirement are represented by NaN (not a number). Site name: Red Sheep Creek Variable: Temperature (°C) Date of preparation: 30-Nov-2012 Name of preparer: Frank Urban Seasonal/Annual Averages: Year WINTER SPRING SUMMER AUTUMN ANNUAL 2004 NaN NaN NaN -11.60 NaN 2005 -21.71 -5.29 11.29 -9.78 -5.82 2006 -20.56 -9.73 10.08 -7.96 -6.98 2007 -20.29 -9.68 12.97 -7.86 -6.40 2008 -22.36 -7.89 10.18 -10.63 -7.86 2009 -23.30 NaN NaN NaN NaN 2010 NaN NaN NaN -6.76 NaN 2011 -23.15 NaN NaN -9.85 NaN Minimum Value Each Season/Year: Year WINTER SPRING SUMMER AUTUMN ANNUAL 2004 NaN NaN NaN -34.92 NaN 2005 -36.53 -26.14 -2.09 -33.89 -35.75 2006 -39.48 -36.86 -9.28 -29.72 -39.48 2007 -40.63 -39.01 0.36 -23.28 -40.63 2008 -39.64 -34.06 -2.42 -31.83 -39.64 2009 -38.24 NaN NaN NaN NaN 2010 NaN NaN NaN -34.18 NaN 2011 -38.06 NaN NaN -32.83 NaN Maximum Value Each Season/Year: Year WINTER SPRING SUMMER AUTUMN ANNUAL 2004 NaN NaN NaN 10.07 NaN 2005 -1.31 16.61 24.77 9.28 24.77 2006 0.83 13.57 20.85 15.99 20.85 2007 -3.47 15.42 23.72 14.67 23.72 2008 -0.57 15.31 23.64 14.59 23.64 2009 0.97 NaN NaN NaN NaN 2010 NaN NaN NaN 14.45 NaN 2011 1.01 NaN NaN 14.68 NaN Anomaly Relative to the Climatological Mean: Year WINTER SPRING SUMMER AUTUMN ANNUAL 2004 NaN NaN NaN -2.39 NaN 2005 0.16 3.04 0.16 -0.57 0.94 2006 1.31 -1.39 -1.05 1.24 -0.21 2007 1.58 -1.35 1.84 1.35 0.36 2008 -0.49 0.45 -0.95 -1.42 -1.09 2009 -1.43 NaN NaN NaN NaN 2010 NaN NaN NaN 2.45 NaN 2011 -1.29 NaN NaN -0.65 NaN Percent of Data Available during Each Season/Year: Year WINTER SPRING SUMMER AUTUMN ANNUAL 2004 0.00 0.00 0.00 100.00 0.00 2005 100.00 100.00 100.00 100.00 1.00 2006 100.00 100.00 99.86 100.00 1.00 2007 100.00 100.00 100.00 100.00 1.00 2008 100.00 100.00 100.00 100.00 1.00 2009 100.00 94.61 0.00 0.00 0.40 2010 0.00 0.00 13.41 100.00 0.37 2011 100.00 87.59 7.07 100.00 0.73
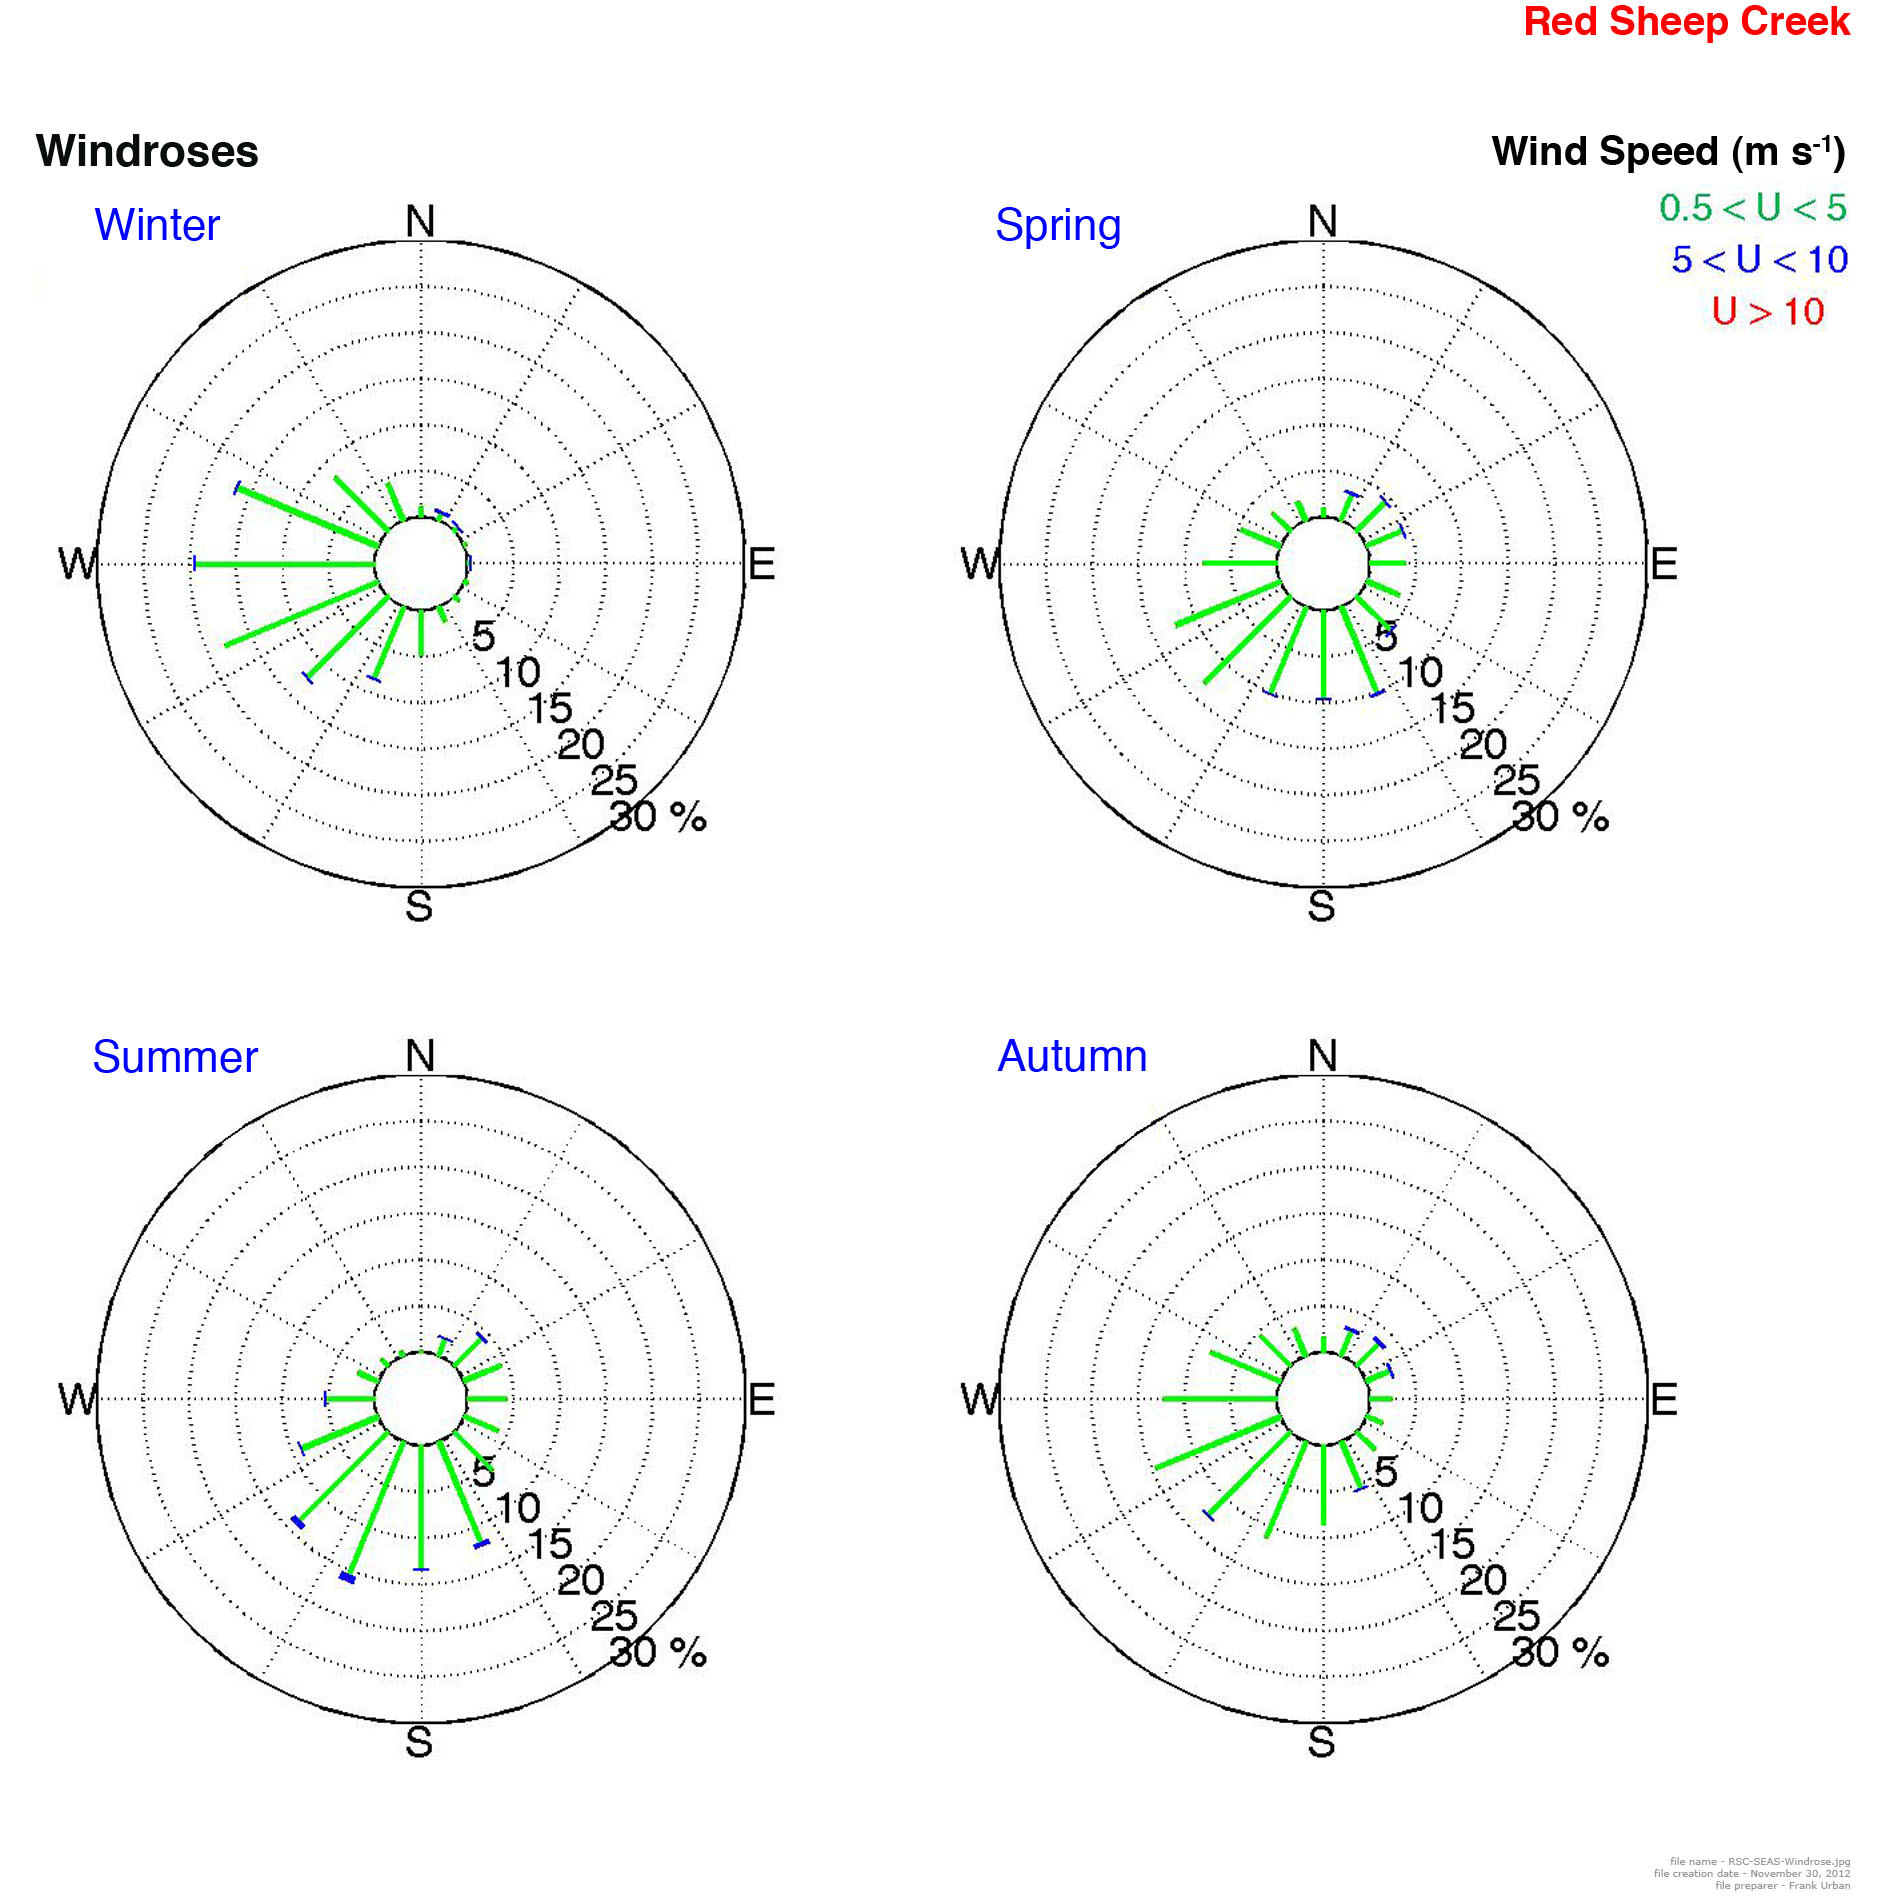
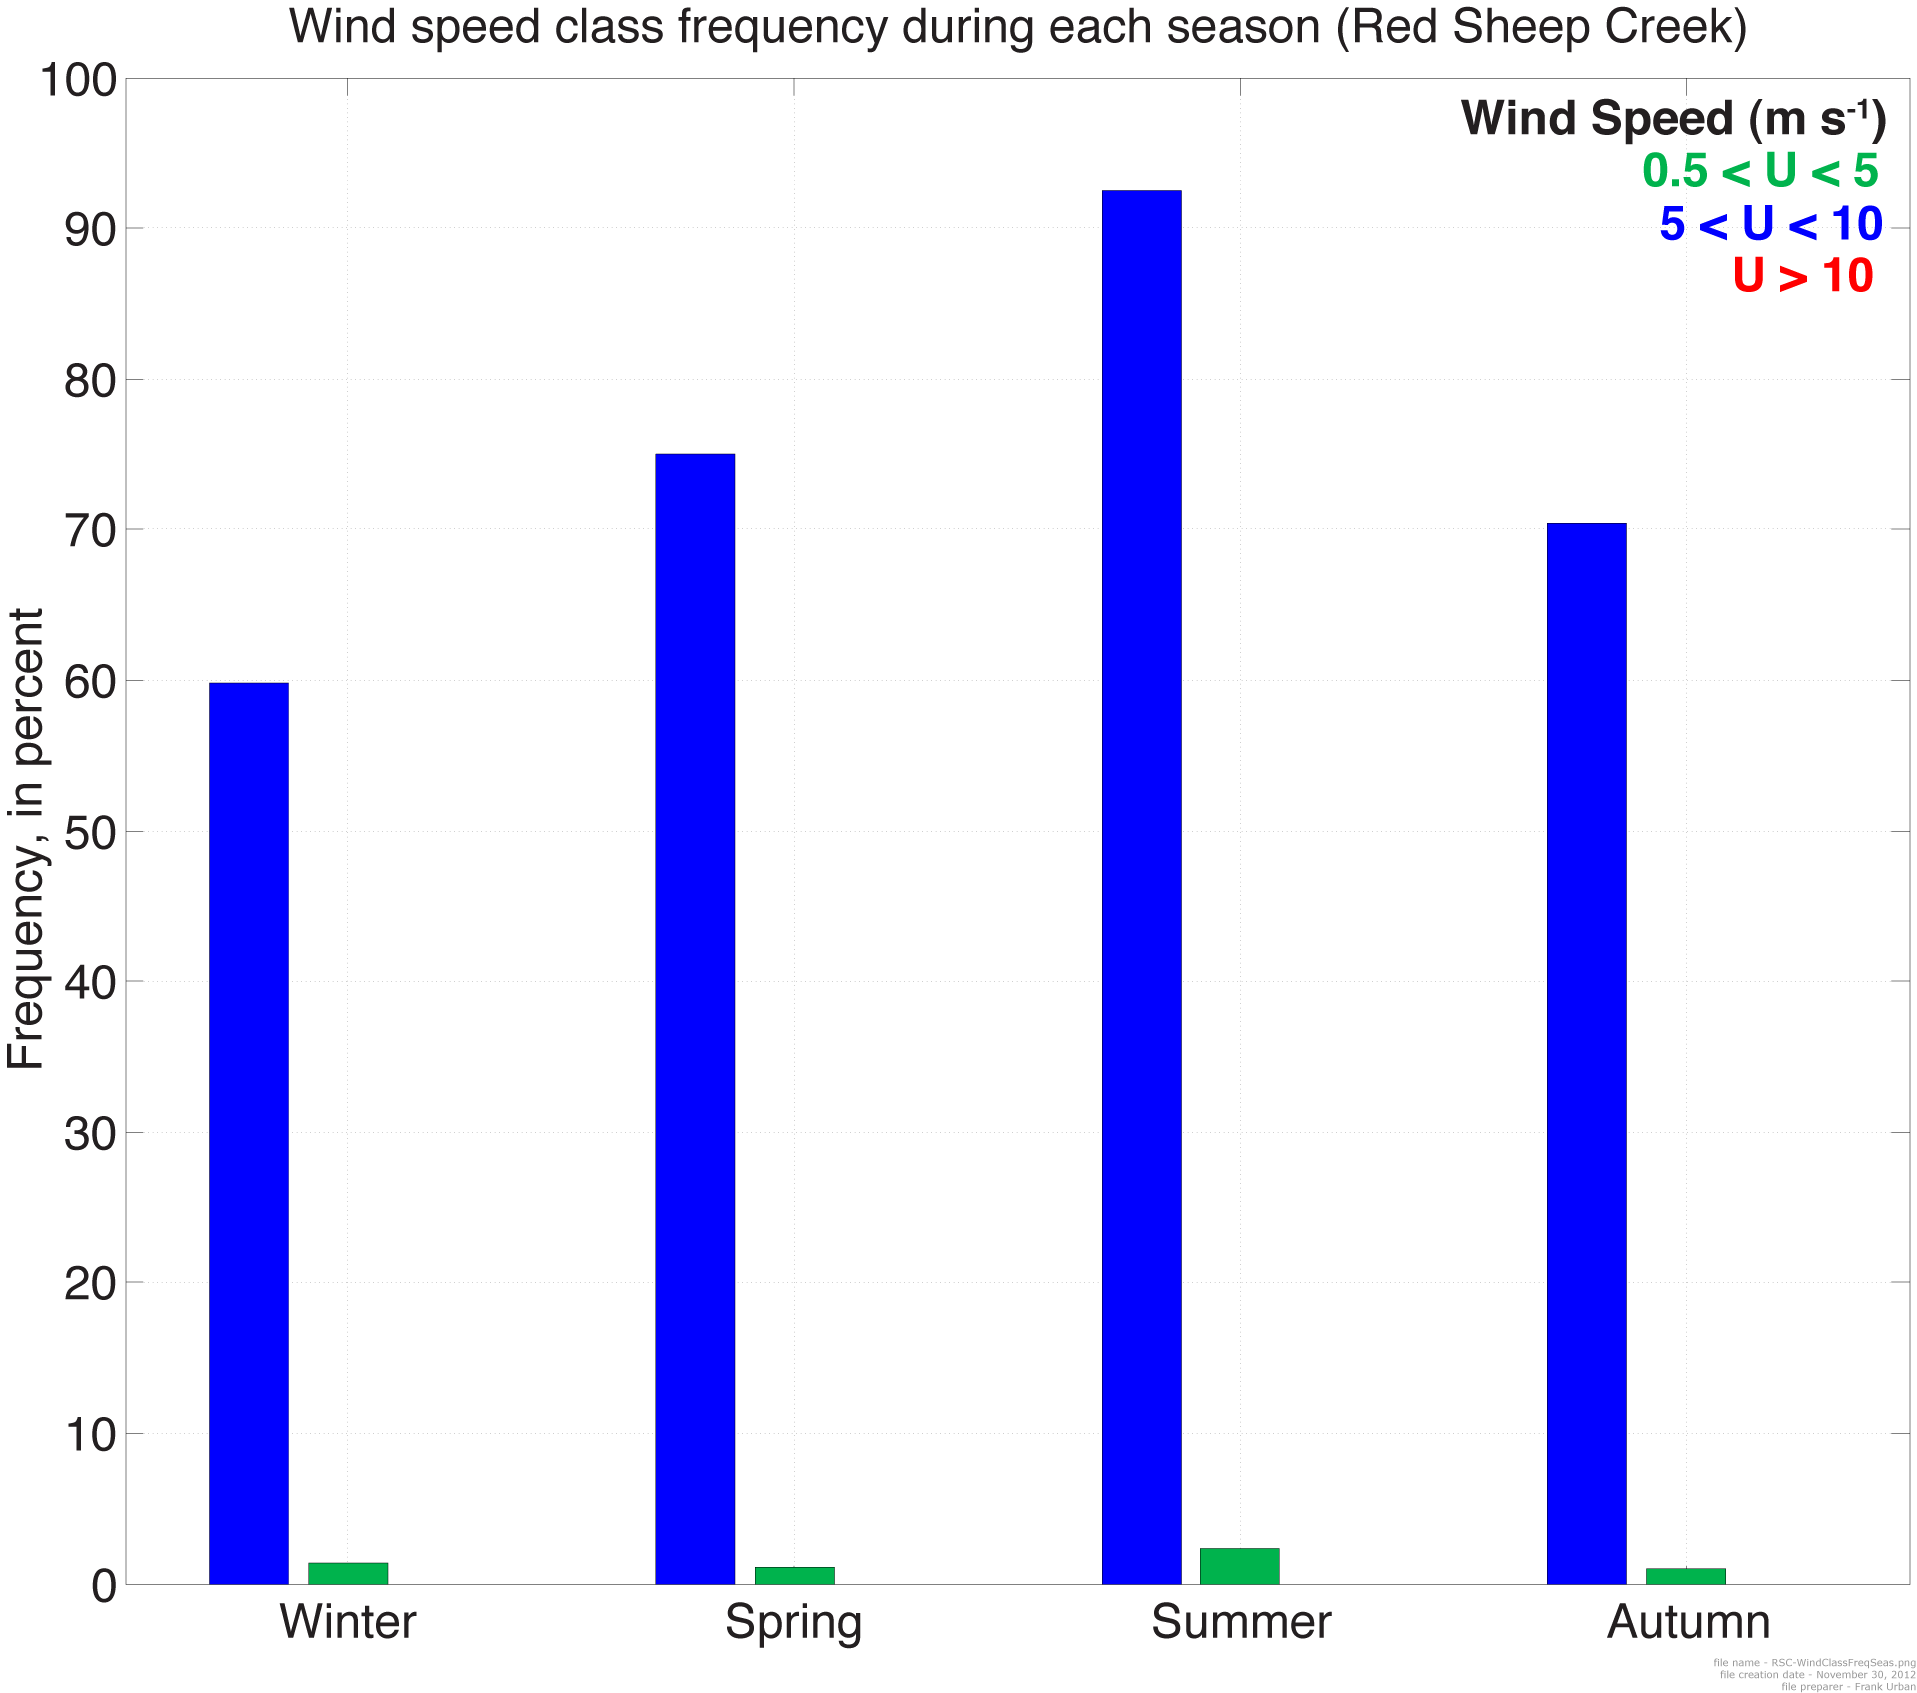
Table 2b. Statistical summaries of provisional wind speed data at seasonal and annual resolution—average, maximum, and percentage of data available. 95% of the data must be available in order to calculate statistics. Periods with less than the 95% requirement are represented by NaN (not a number). Site name: Red Sheep Creek Variable: Wind Speed (m s-1) Date of preparation: 30-Nov-2012 Name of preparer: Frank Urban Seasonal/Annual Averages: Year WINTER SPRING SUMMER AUTUMN ANNUAL 2004 NaN NaN NaN 0.98 NaN 2005 0.86 1.48 2.33 1.41 1.52 2006 NaN 1.35 2.31 1.12 1.41 2007 0.82 1.24 2.00 1.21 1.32 2008 1.00 1.58 1.99 1.20 1.44 2009 0.80 1.28 2.00 1.07 1.32 2010 1.11 1.66 2.01 NaN 1.48 2011 0.92 NaN NaN 1.13 NaN Maximum Hourly Average Value for Each Season/Year: Year WINTER SPRING SUMMER AUTUMN ANNUAL 2004 NaN NaN NaN 6.90 NaN 2005 6.72 8.77 6.79 7.16 8.77 2006 NaN 6.50 7.99 8.45 8.45 2007 5.95 7.28 7.94 6.37 7.94 2008 8.95 7.16 6.11 6.71 8.95 2009 8.41 5.41 6.64 5.98 8.41 2010 6.71 7.21 6.39 NaN 7.21 2011 9.68 NaN NaN 7.11 NaN Percent of Data Available during Each Season/Year: Year WINTER SPRING SUMMER AUTUMN ANNUAL 2004 0.00 0.00 0.00 95.83 0.00 2005 98.43 100.00 100.00 99.73 0.98 2006 91.76 100.00 99.86 99.50 1.00 2007 100.00 100.00 100.00 100.00 1.00 2008 100.00 100.00 100.00 100.00 1.00 2009 95.32 100.00 99.91 99.68 0.99 2010 97.69 100.00 99.95 92.72 0.97 2011 95.88 87.59 7.07 100.00 0.73 |
For additional information contact: |
|||||||||||||||||||||||||||||||||

![]() U.S. Department of the Interior |
U.S. Geological Survey
U.S. Department of the Interior |
U.S. Geological Survey
URL: http://pubsdata.usgs.gov/pubs/of/2013/1063/RedSheepCreek/RedSheepCreek.html
Page Contact Information: GS Pubs Web Contact
Page Last Modified: Monday, 29-Apr-2013 14:45:26 EDT