|
|
Figures 10–19
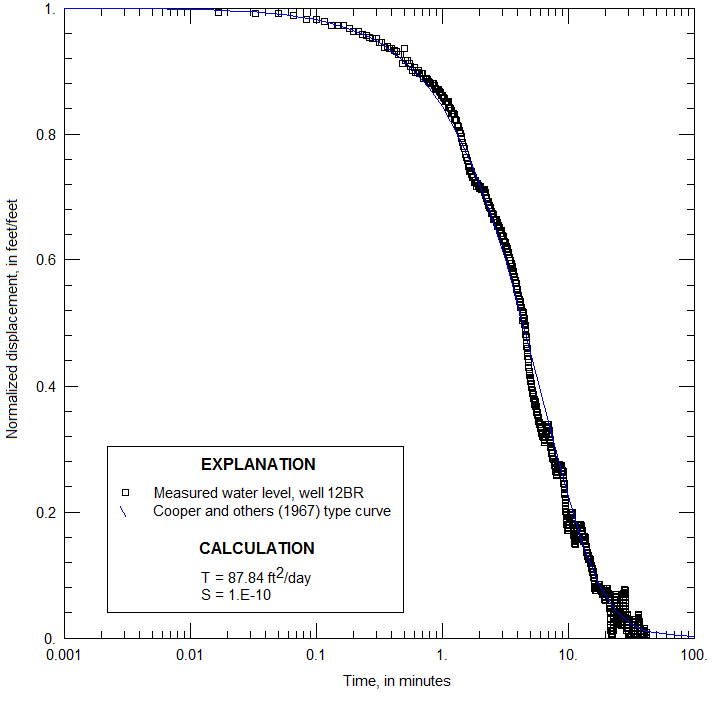
Figure 10. Normalized water-level displacement as a function of time for well 12BR, Naval Air Warfare Center, West Trenton, New Jersey, with best-fit Cooper type curve. (T, transmissivity; ft2/day, square feet per day; S, storage coefficient) |
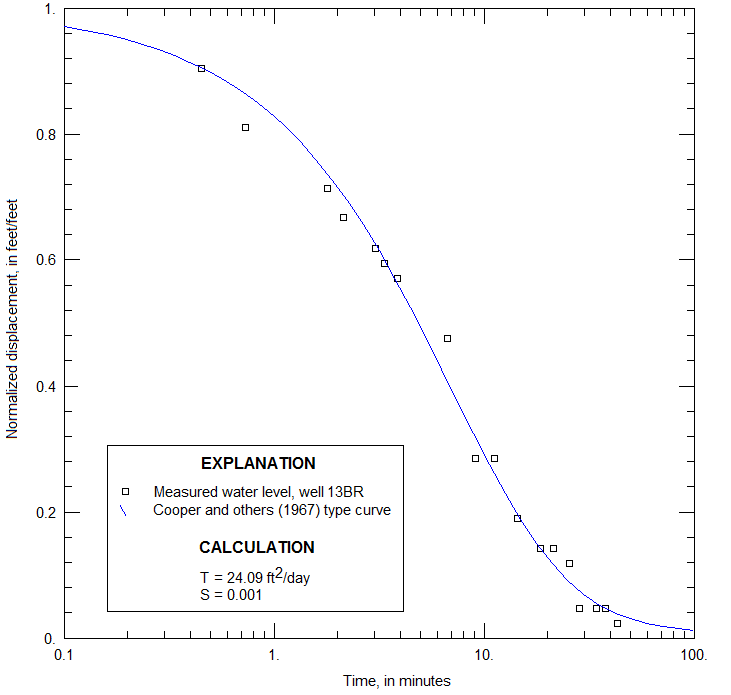
Figure 11. Normalized water-level displacement as a function of time for well 13BR, Naval Air Warfare Center, West Trenton, New Jersey, with best-fit Cooper type curve. (T, transmissivity; ft2/day, square feet per day; S, storage coefficient) |
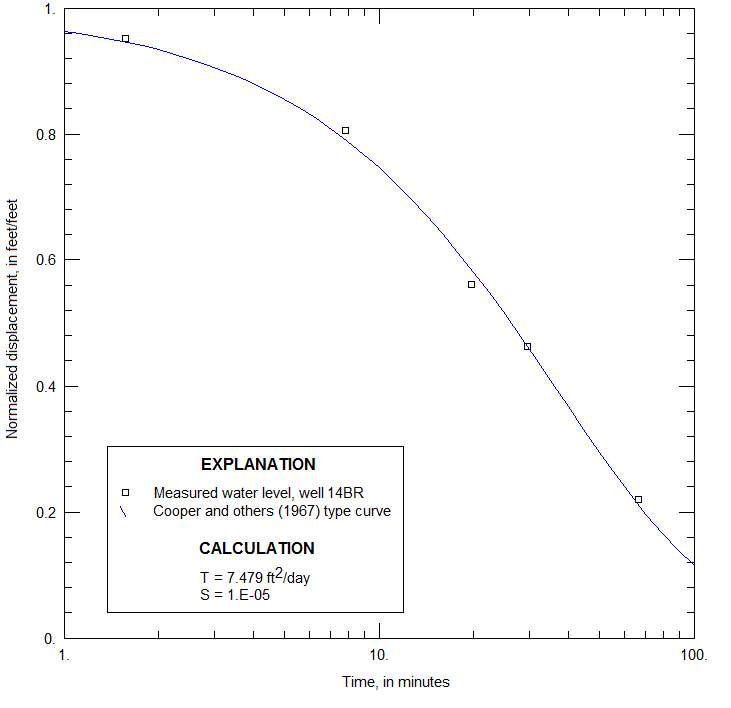
Figure 12. Normalized water-level displacement as a function of time for well 14BR, Naval Air Warfare Center, West Trenton, New Jersey, with best-fit Cooper type curve. (T, transmissivity; ft2/day, square feet per day; S, storage coefficient) |
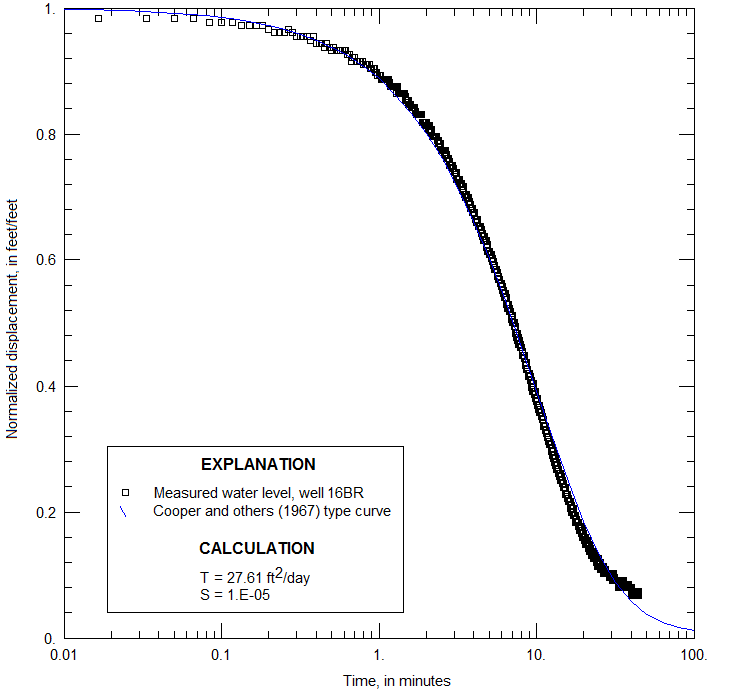
Figure 13. Normalized water-level displacement as a function of time for well 16BR, Naval Air Warfare Center, West Trenton, New Jersey, with best-fit Cooper type curve. (T, transmissivity; ft2/day, square feet per day; S, storage coefficient) |
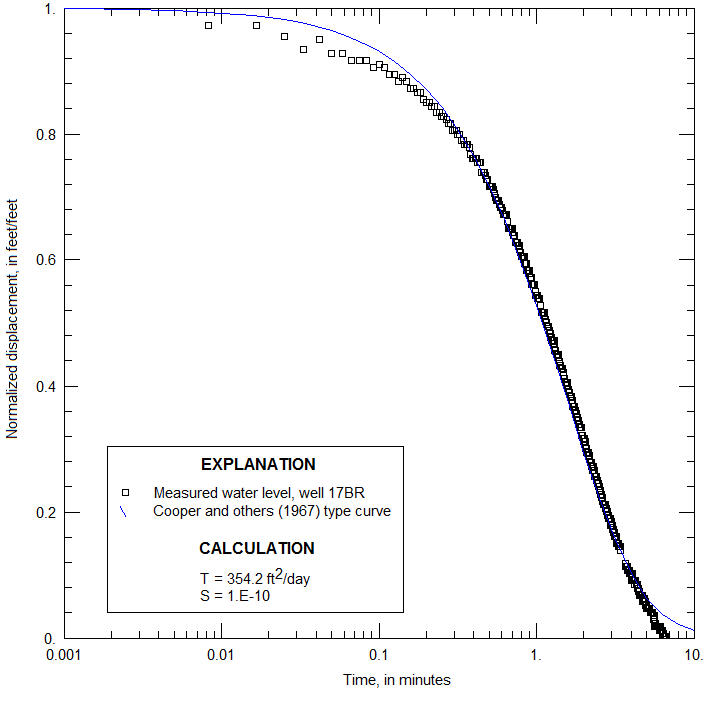
Figure 14. Normalized water-level displacement as a function of time for well 17BR, Naval Air Warfare Center, West Trenton, New Jersey, with best-fit Cooper type curve. (T, transmissivity; ft2/day, square feet per day; S, storage coefficient) |
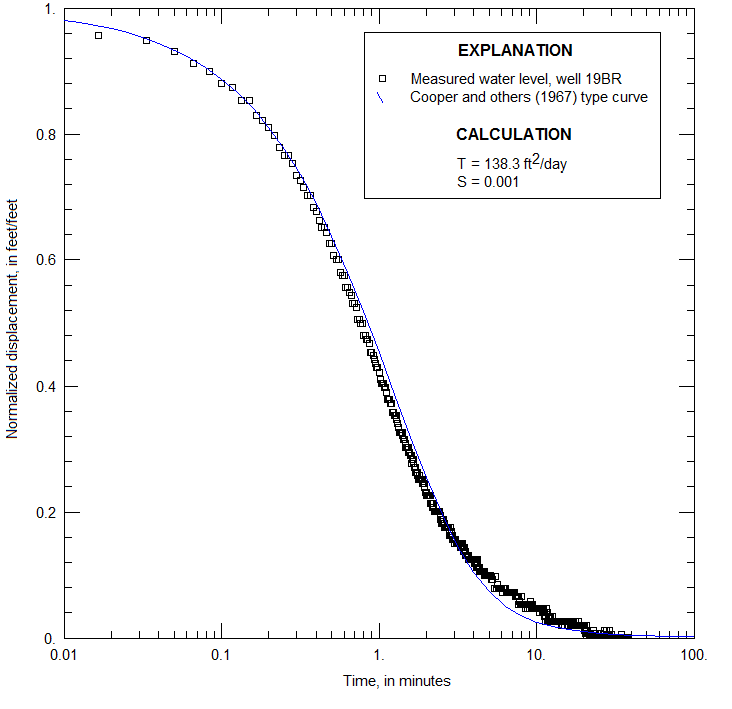
Figure 15. Normalized water-level displacement as a function of time for well 19BR, Naval Air Warfare Center, West Trenton, New Jersey, with best-fit Cooper type curve. (T, transmissivity; ft2/day, square feet per day; S, storage coefficient) |
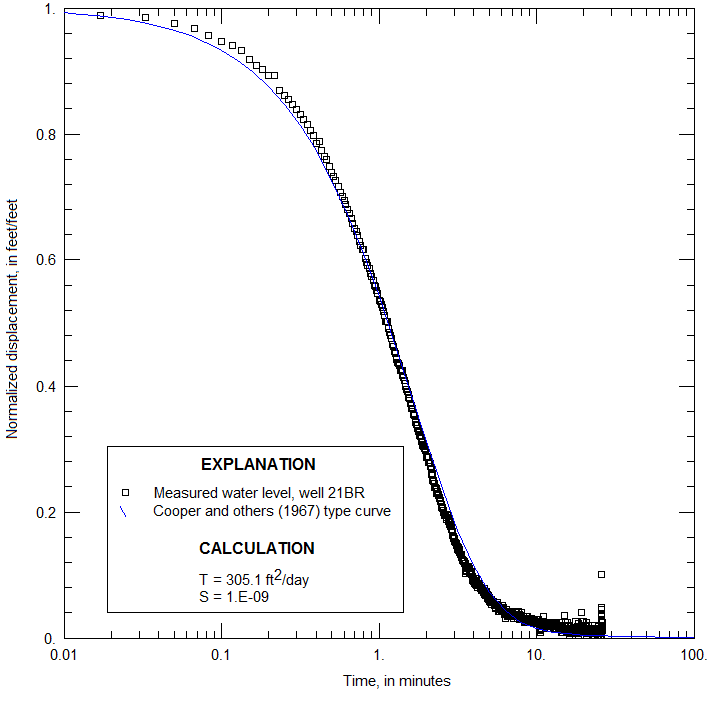
Figure 16. Normalized water-level displacement as a function of time for well 21BR, Naval Air Warfare Center, West Trenton, New Jersey, with best-fit Cooper type curve. (T, transmissivity; ft2/day, square feet per day; S, storage coefficient) |
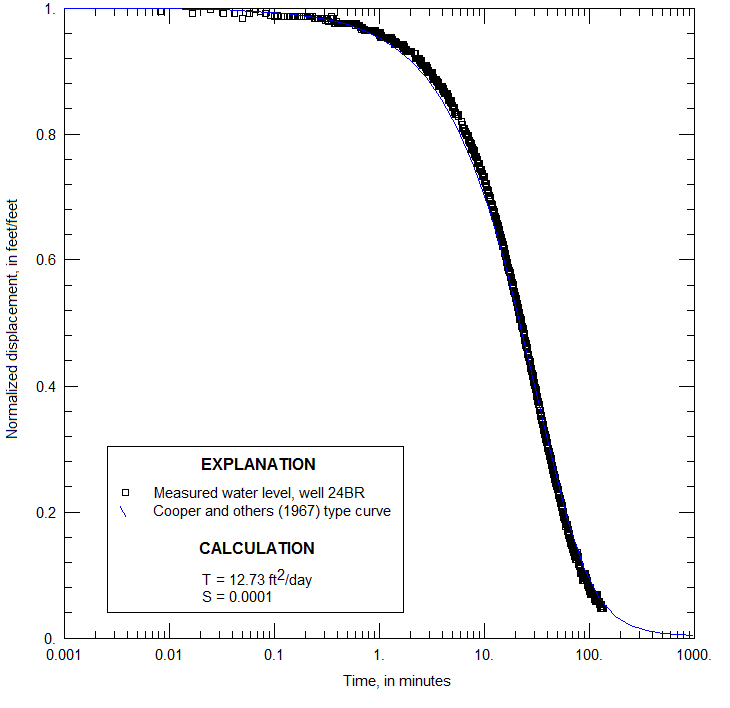
Figure 17. Normalized water-level displacement as a function of time for well 24BR, Naval Air Warfare Center, West Trenton, New Jersey, with best-fit Cooper type curve. (T, transmissivity; ft2/day, square feet per day; S, storage coefficient) |
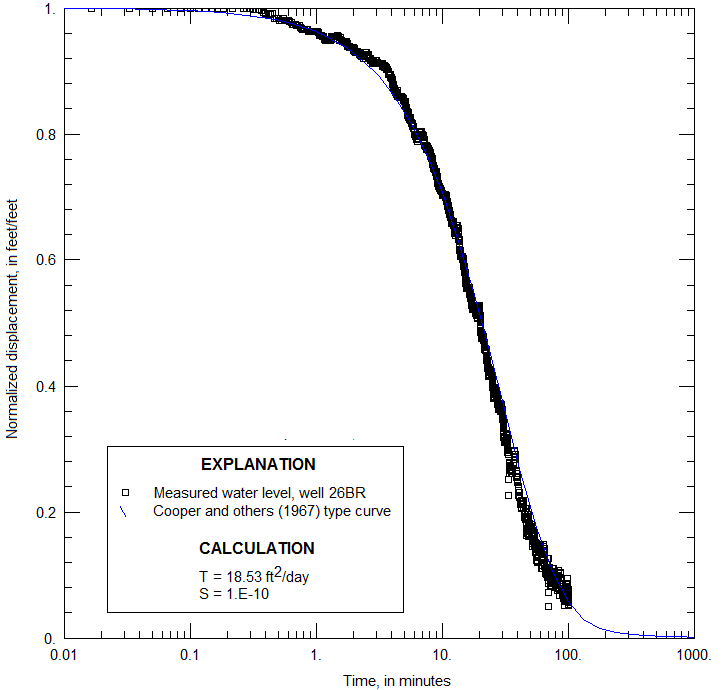
Figure 18. Normalized water-level displacement as a function of time for well 26BR, Naval Air Warfare Center, West Trenton, New Jersey, with best-fit Butler type curve. (T, transmissivity; ft2/day, square feet per day) |
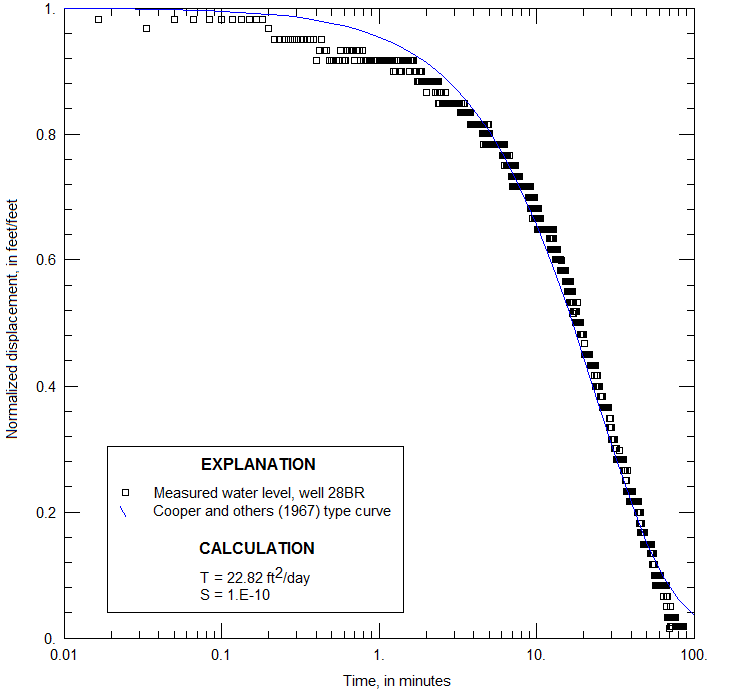
Figure 19. Normalized water-level displacement as a function of time for well 28BR, Naval Air Warfare Center, West Trenton, New Jersey, with best-fit Butler type curve. (T, transmissivity; ft2/day, square feet per day) |
|

