|
|
Figures 20–29
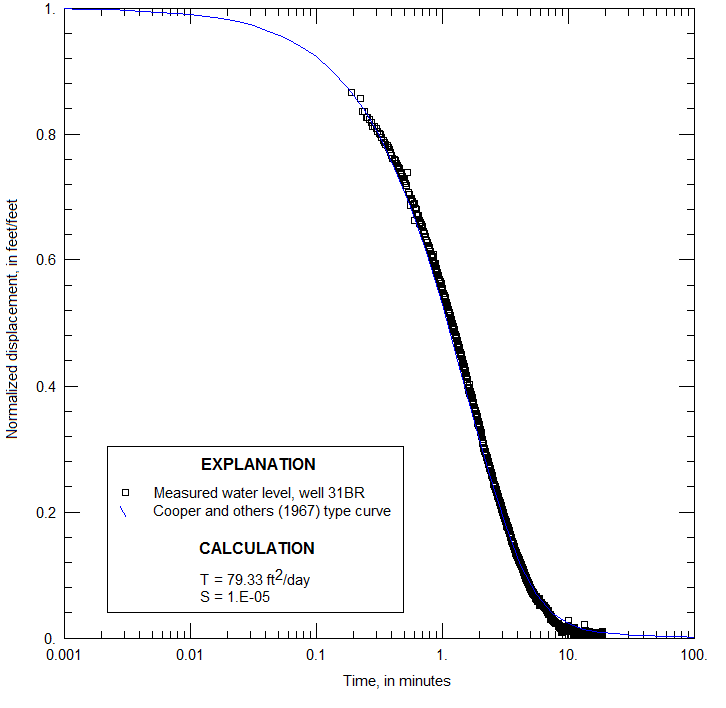
Figure 20. Normalized water-level displacement as a function of time for well 31BR, Naval Air Warfare Center, West Trenton, New Jersey, with best-fit Cooper type curve. (T, transmissivity; ft2/day, square feet per day; S, storage coefficient) |
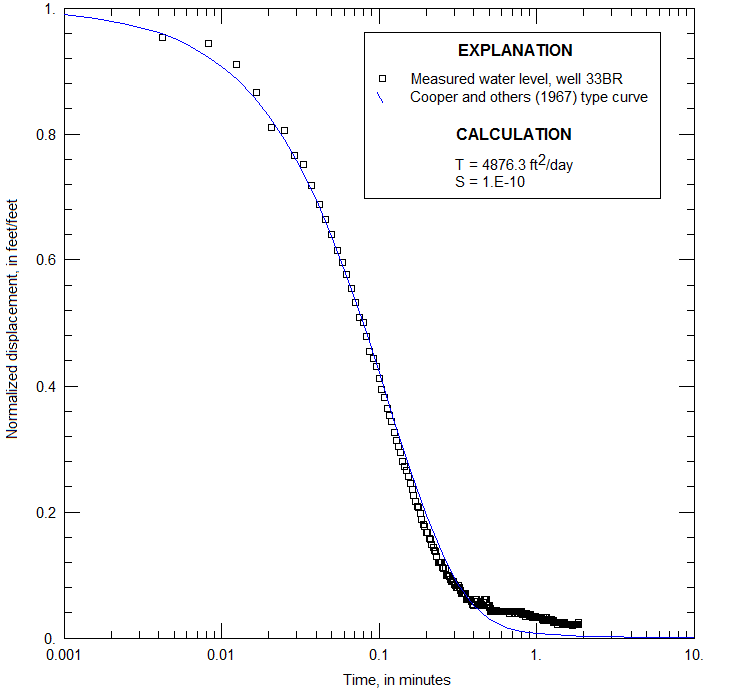
Figure 21. Normalized water-level displacement as a function of time for well 33BR, Naval Air Warfare Center, West Trenton, New Jersey, with best-fit Cooper type curve. (T, transmissivity; ft2/day, square feet per day; S, storage coefficient) |
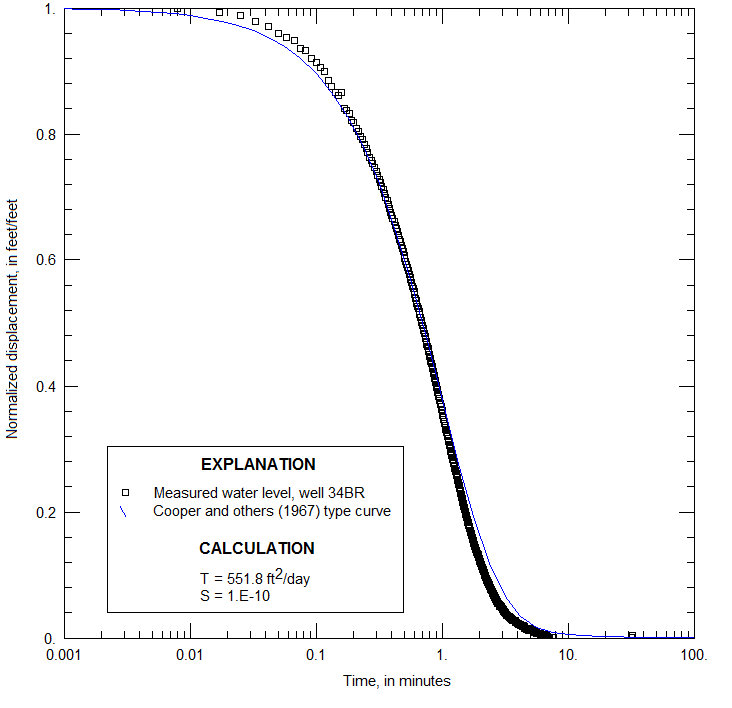
Figure 22. Normalized water-level displacement as a function of time for well 34BR, Naval Air Warfare Center, West Trenton, New Jersey, with best-fit Cooper type curve. (T, transmissivity; ft2/day, square feet per day; S, storage coefficient) |
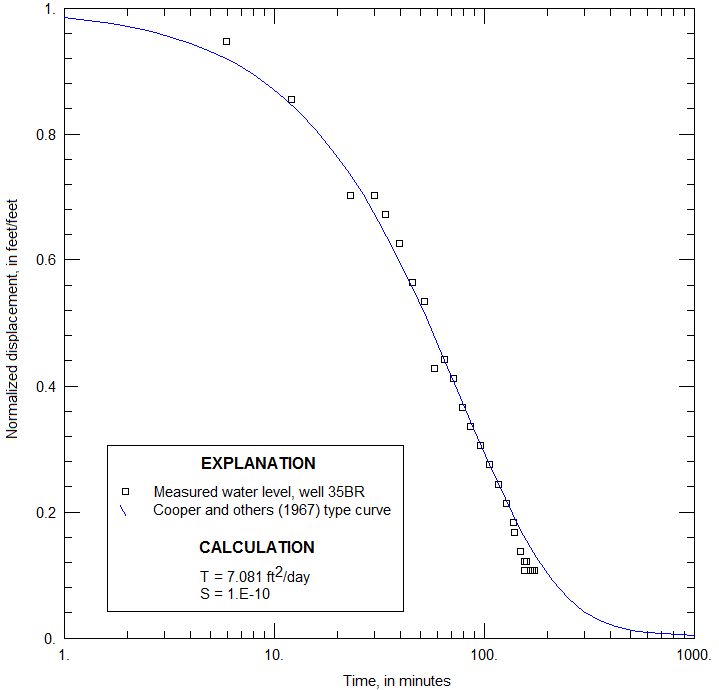
Figure 23. Normalized water-level displacement as a function of time for well 35BR, Naval Air Warfare Center, West Trenton, New Jersey, with best-fit Cooper type curve. (T, transmissivity; ft2/day, square feet per day; S, storage coefficient) |
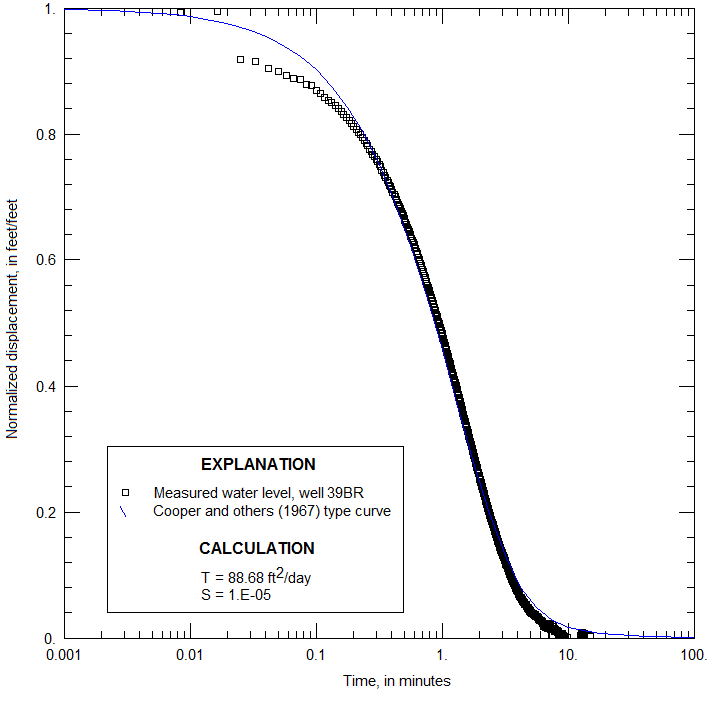
Figure 24. Normalized water-level displacement as a function of time for well 39BR, Naval Air Warfare Center, West Trenton, New Jersey, with best-fit Cooper type curve. (T, transmissivity; ft2/day, square feet per day; S, storage coefficient) |

Figure 25. Normalized water-level displacement as a function of time for well 41BR, Naval Air Warfare Center, West Trenton, New Jersey, with best-fit Cooper type curve. (T, transmissivity; ft2/day, square feet per day; S, storage coefficient) |
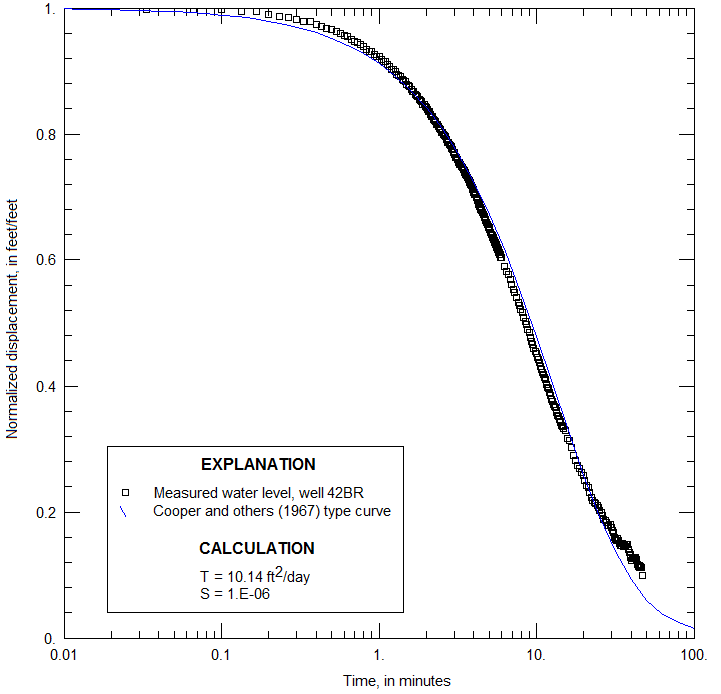
Figure 26. Normalized water-level displacement as a function of time for well 42BR, Naval Air Warfare Center, West Trenton, New Jersey, with best-fit Cooper type curve. (T, transmissivity; ft2/day, square feet per day; S, storage coefficient) |
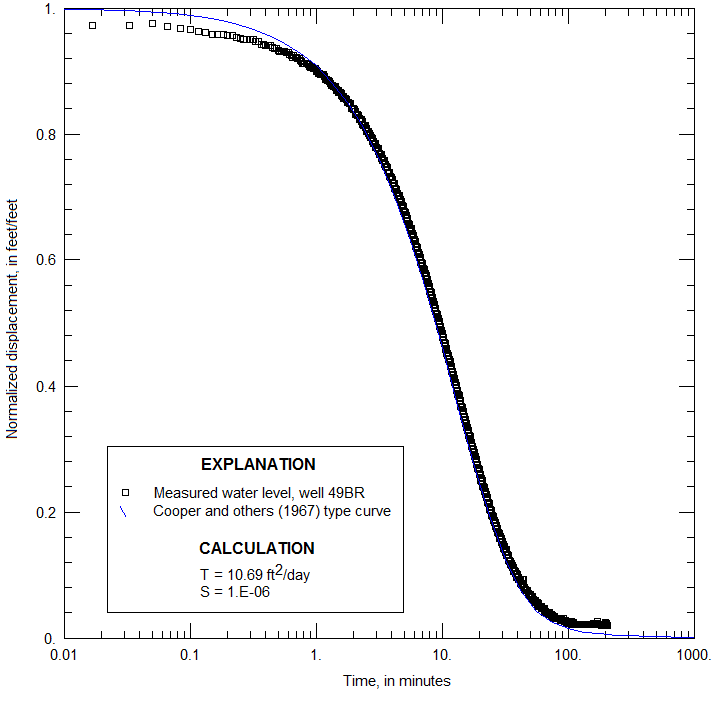
Figure 27. Normalized water-level displacement as a function of time for well 49BR, Naval Air Warfare Center, West Trenton, New Jersey, with best-fit Cooper type curve. (T, transmissivity; ft2/day, square feet per day; S, storage coefficient) |
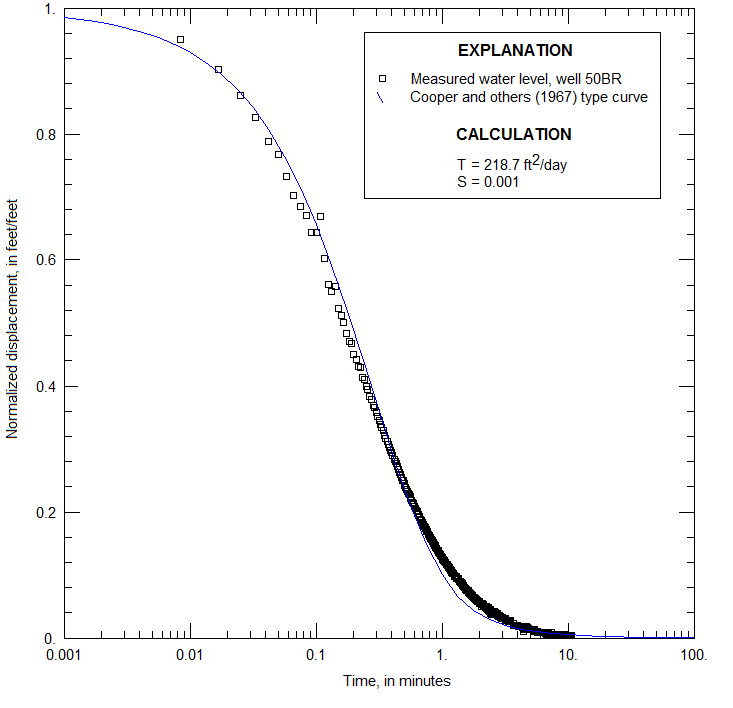
Figure 28. Normalized water-level displacement as a function of time for well 50BR, Naval Air Warfare Center, West Trenton, New Jersey, with best-fit Butler type curve. (T, transmissivity; ft2/day, square feet per day) |
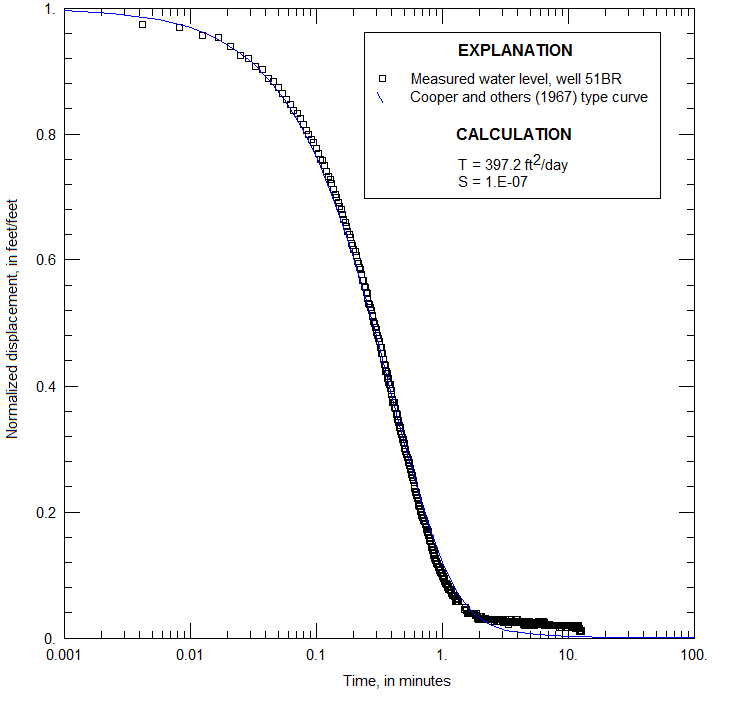
Figure 29. Normalized water-level displacement as a function of time for well 51BR, Naval Air Warfare Center, West Trenton, New Jersey, with best-fit Butler type curve. (T, transmissivity; ft2/day, square feet per day) |
|

