|
|
Figures 2–9
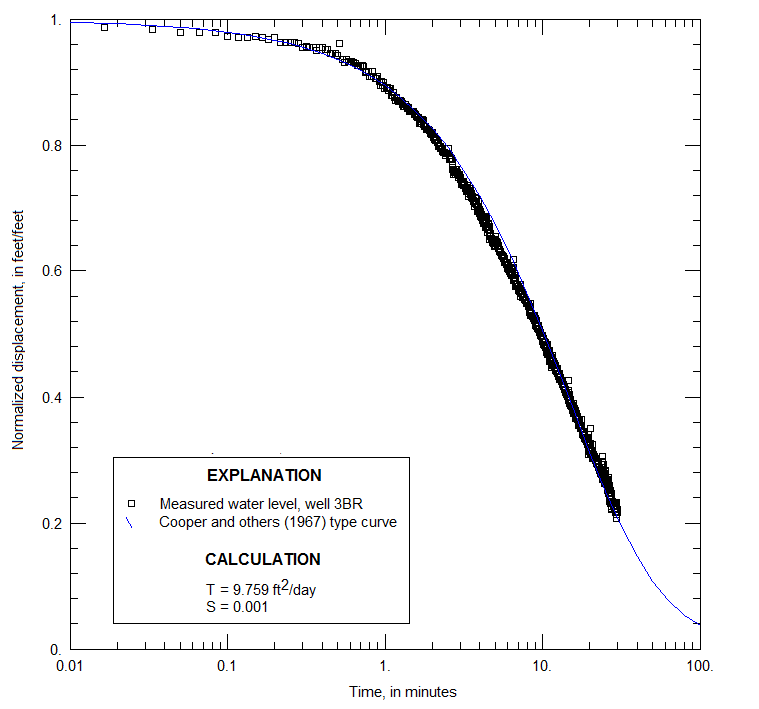
Figure 2. Normalized water-level displacement as a function of time for well 03BR, Naval Air Warfare Center, West Trenton, New Jersey, with best-fit Cooper type curve. (T, transmissivity; ft2/day, square feet per day; S, storage coefficient) |
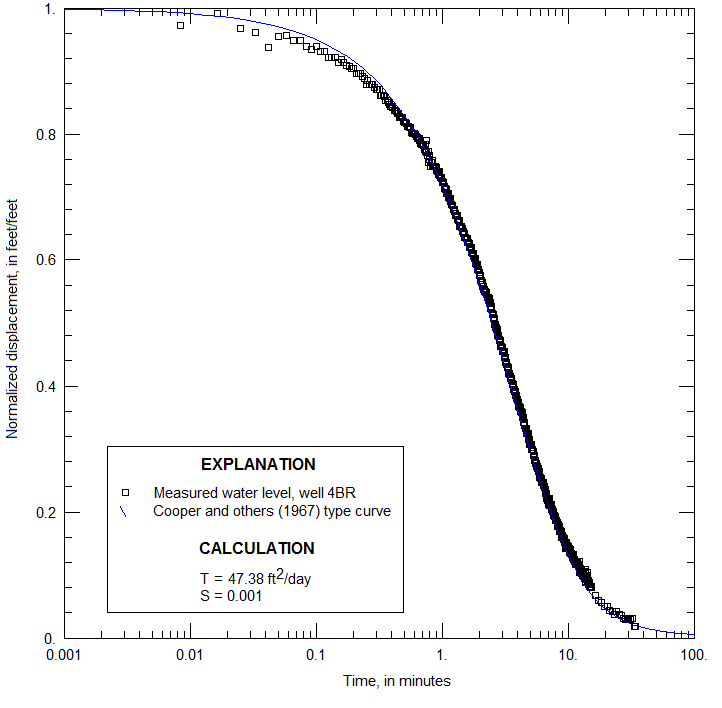
Figure 3. Normalized water-level displacement as a function of time for well 04BR, Naval Air Warfare Center, West Trenton, New Jersey, with best-fit Cooper type curve. (T, transmissivity; ft2/day, square feet per day; S, storage coefficient) |
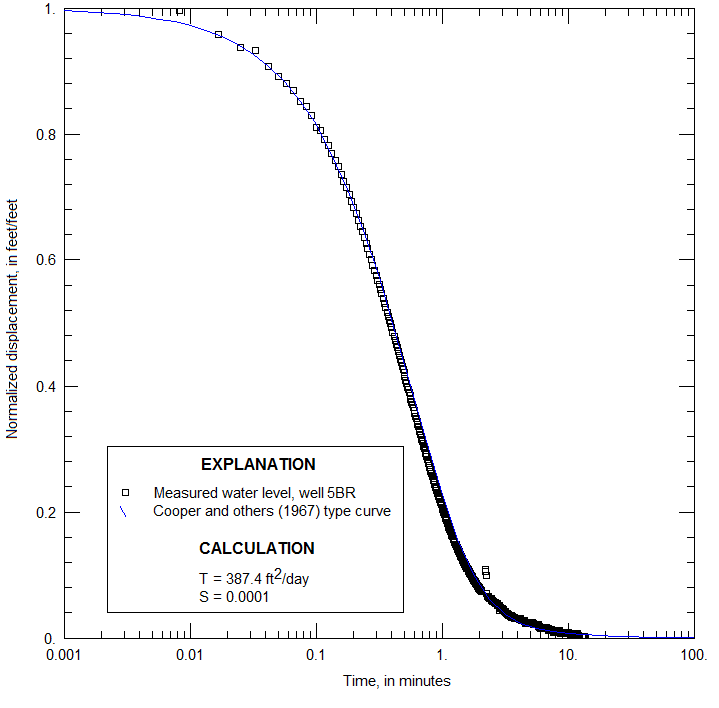
Figure 4. Normalized water-level displacement as a function of time for well 05BR, Naval Air Warfare Center, West Trenton, New Jersey, with best-fit Cooper type curve. (T, transmissivity; ft2/day, square feet per day; S, storage coefficient) |
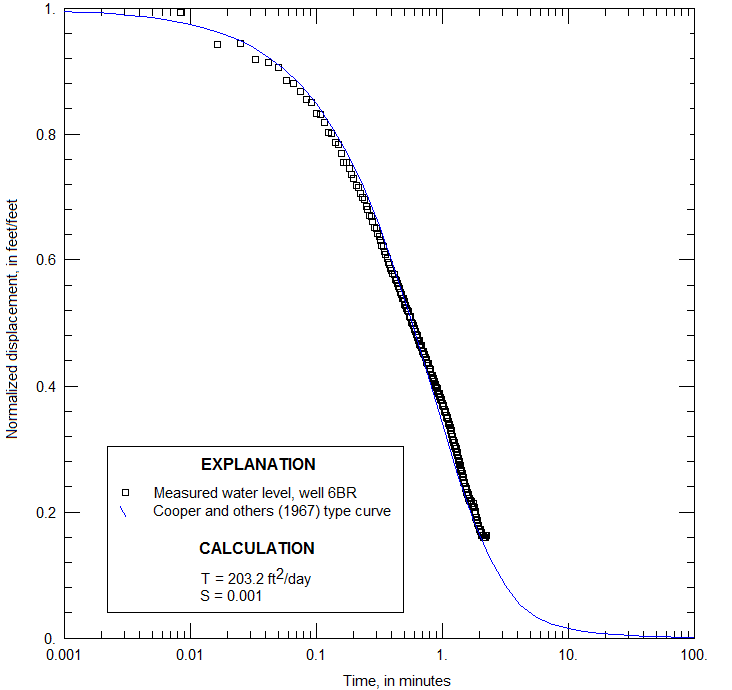
Figure 5. Normalized water-level displacement as a function of time for well 06BR, Naval Air Warfare Center, West Trenton, New Jersey, with best-fit Cooper type curve. (T, transmissivity; ft2/day, square feet per day; S, storage coefficient) |
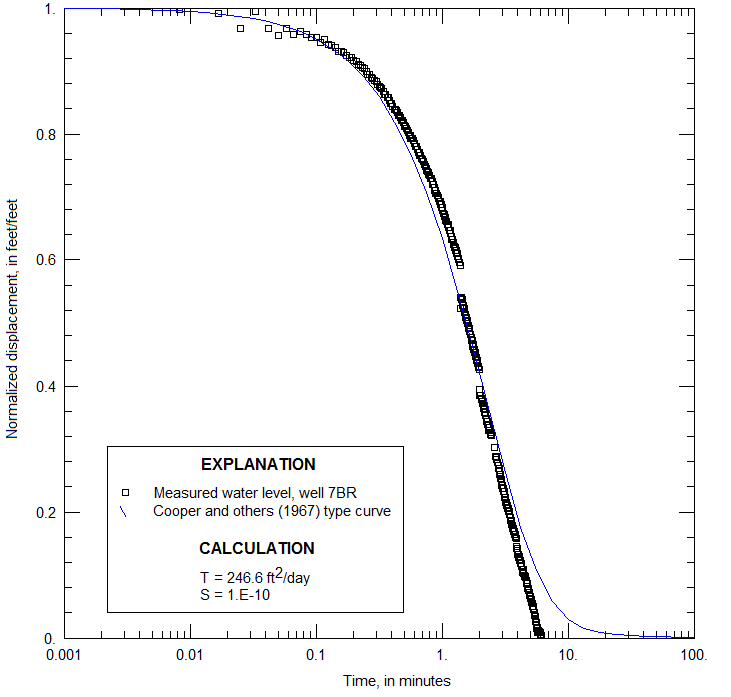
Figure 6. Normalized water-level displacement as a function of time for well 07BR, Naval Air Warfare Center, West Trenton, New Jersey, with best-fit Cooper type curve. (T, transmissivity; ft2/day, square feet per day; S, storage coefficient) |
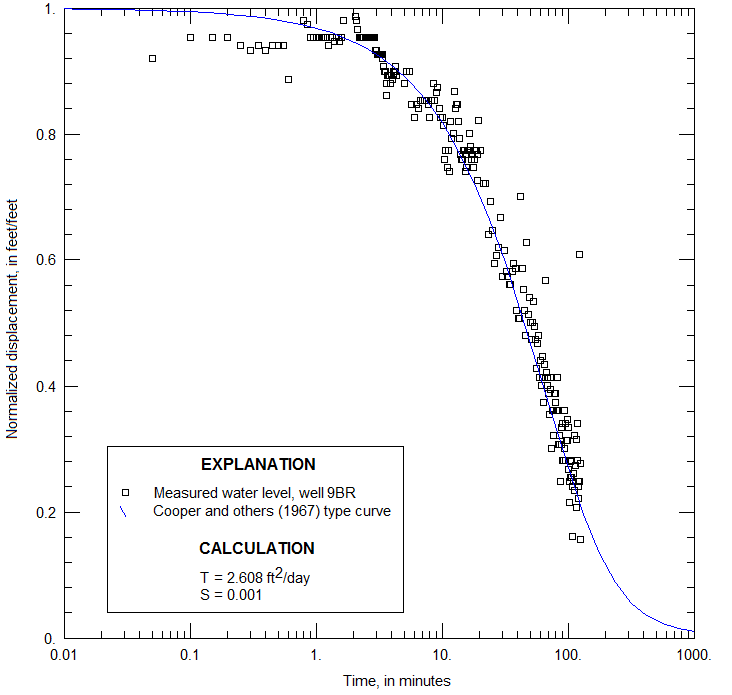
Figure 7. Normalized water-level displacement as a function of time for well 09BR, Naval Air Warfare Center, West Trenton, New Jersey, with best-fit Cooper type curve. (T, transmissivity; ft2/day, square feet per day; S, storage coefficient) |
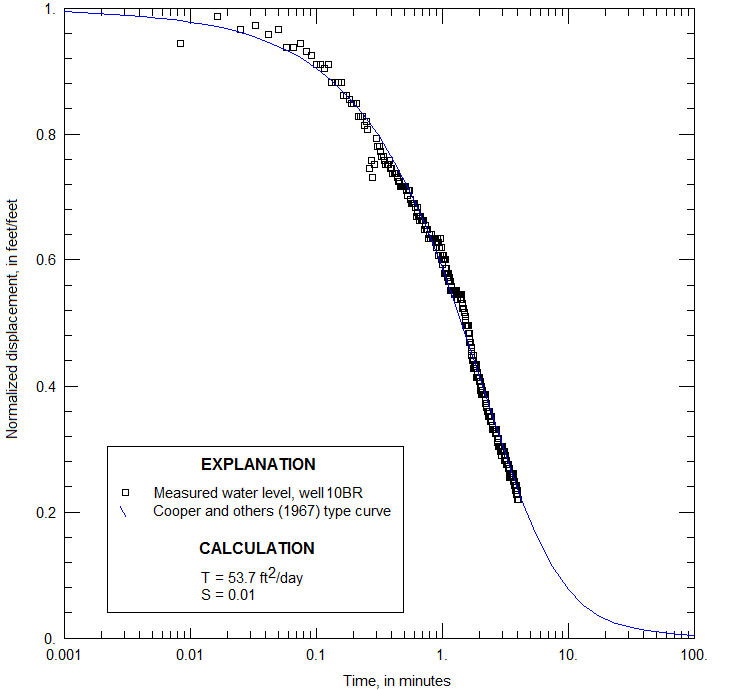
Figure 8. Normalized water-level displacement as a function of time for well 10BR, Naval Air Warfare Center, West Trenton, New Jersey, with best-fit Cooper type curve. (T, transmissivity; ft2/day, square feet per day; S, storage coefficient) |
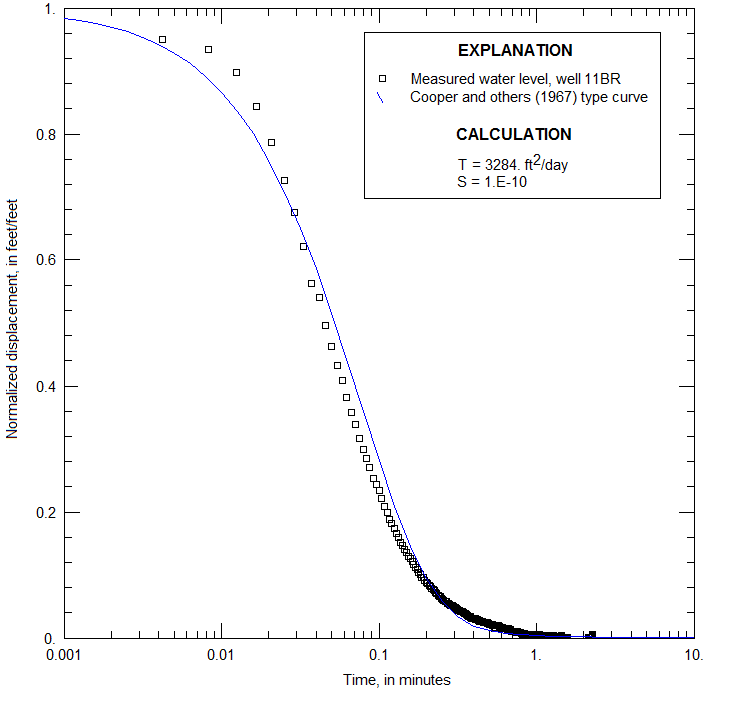
Figure 9. Normalized water-level displacement as a function of time for well 11BR, Naval Air Warfare Center, West Trenton, New Jersey, with best-fit Cooper type curve. (T, transmissivity; ft2/day, square feet per day; S, storage coefficient) |
|

