|
|
Figures 30–39
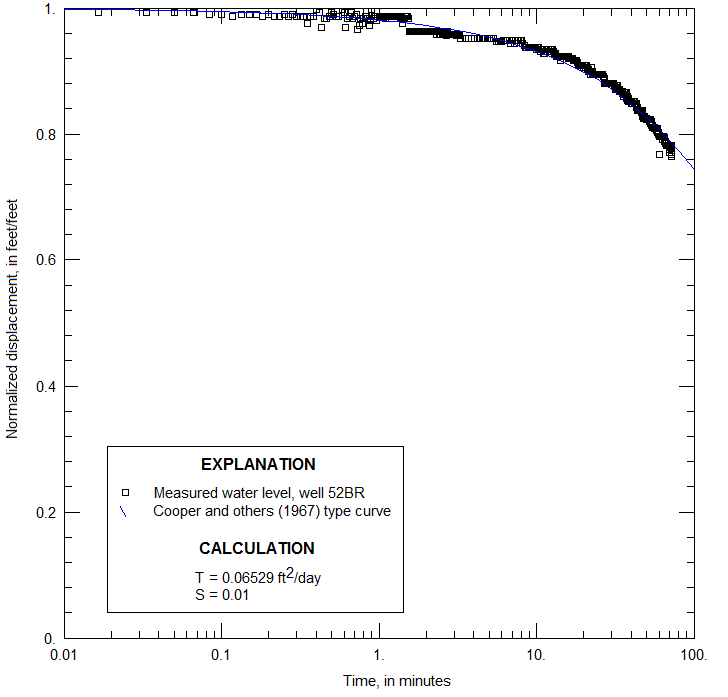
Figure 30. Normalized water-level displacement as a function of time for well 52BR, Naval Air Warfare Center, West Trenton, New Jersey, with best-fit Cooper type curve. (T, transmissivity; ft2/day, square feet per day; S, storage coefficient) |
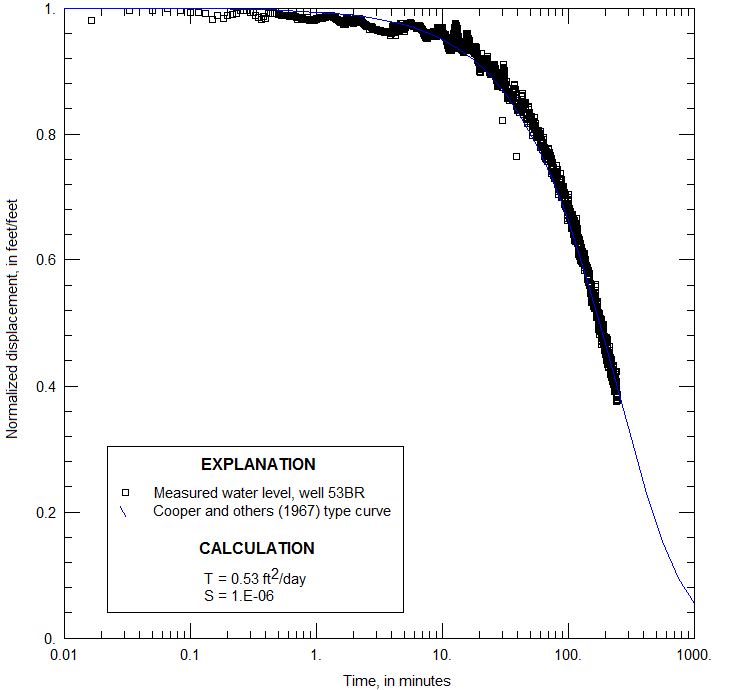
Figure 31. Normalized water-level displacement as a function of time for well 53BR, Naval Air Warfare Center, West Trenton, New Jersey, with best-fit Cooper type curve. (T, transmissivity; ft2/day, square feet per day; S, storage coefficient) |
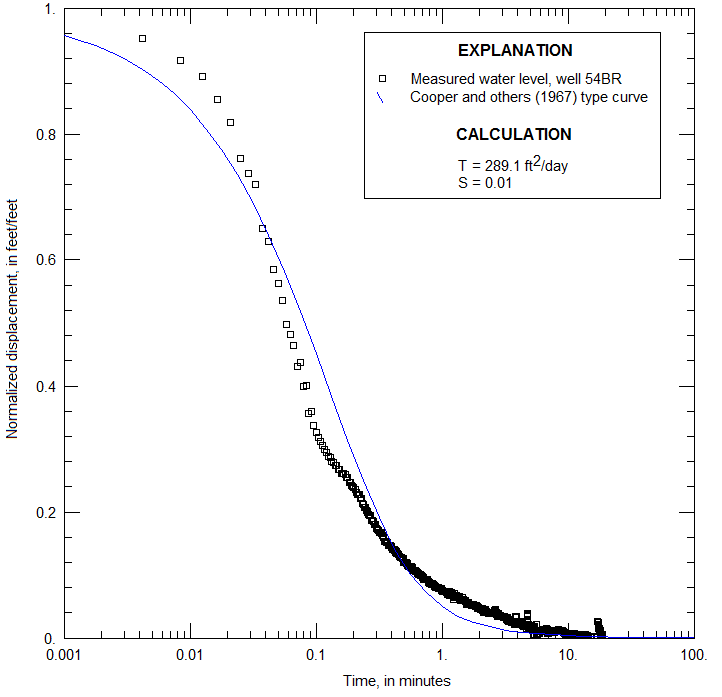
Figure 32. Normalized water-level displacement as a function of time for well 54BR, Naval Air Warfare Center, West Trenton, New Jersey, with best-fit Cooper type curve. (T, transmissivity; ft2/day, square feet per day; S, storage coefficient) |
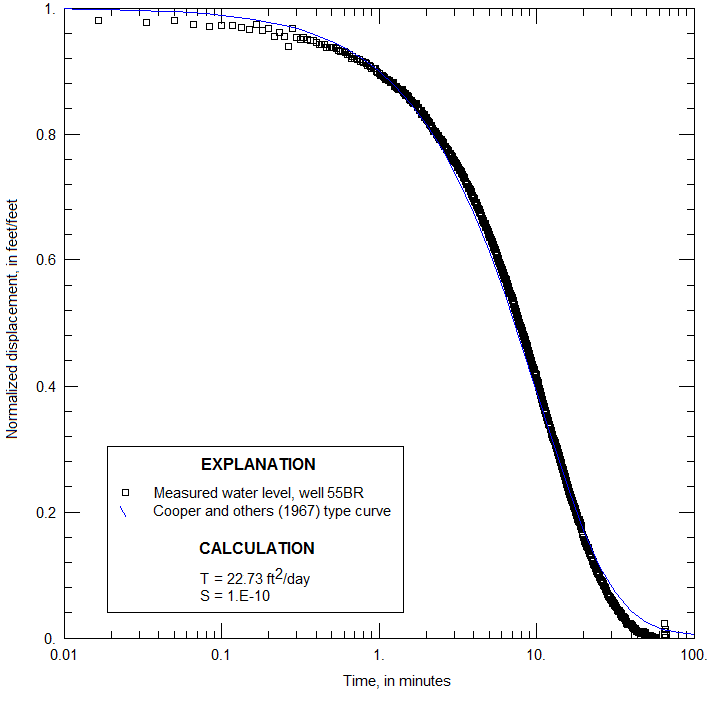
Figure 33. Normalized water-level displacement as a function of time for well 55BR, Naval Air Warfare Center, West Trenton, New Jersey, with best-fit Cooper type curve. (T, transmissivity; ft2/day, square feet per day; S, storage coefficient) |
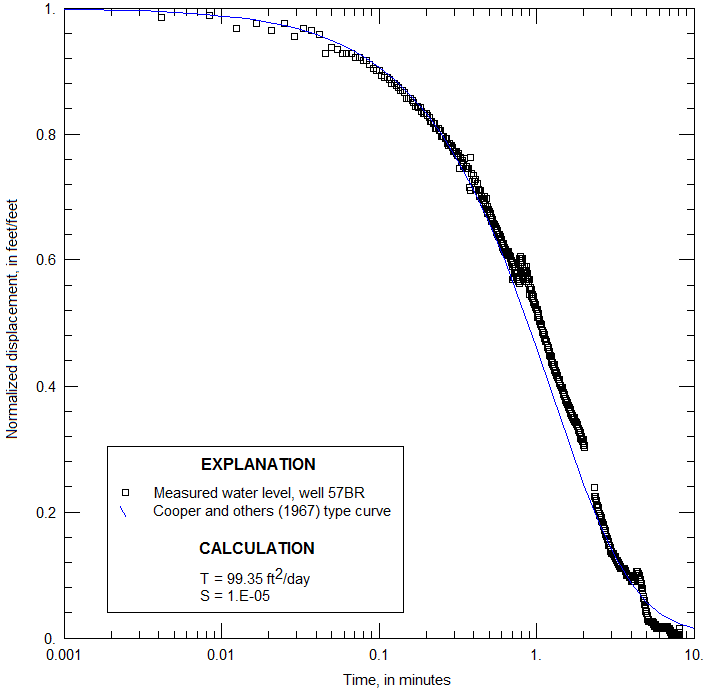
Figure 34. Normalized water-level displacement as a function of time for well 57BR, Naval Air Warfare Center, West Trenton, New Jersey, with best-fit Cooper type curve. (T, transmissivity; ft2/day, square feet per day; S, storage coefficient) |
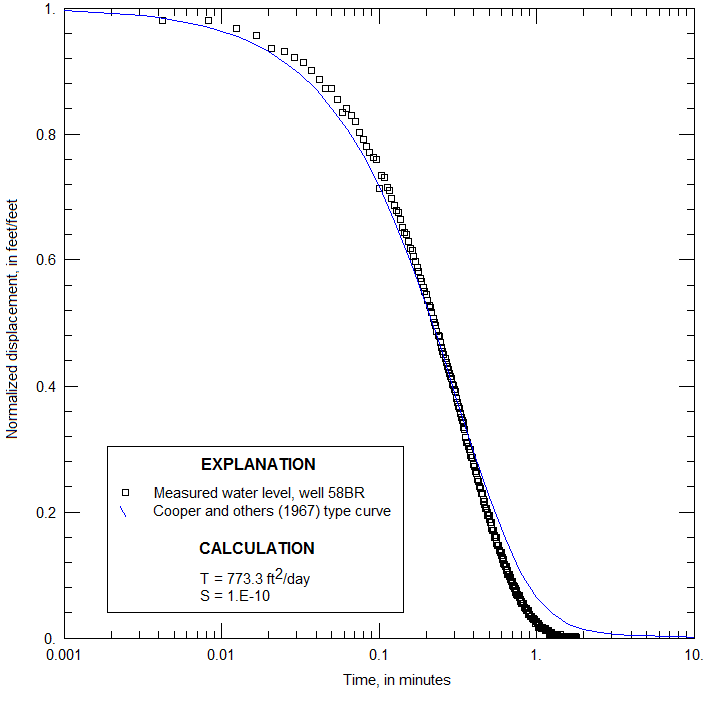
Figure 35. Normalized water-level displacement as a function of time for well 58BR, Naval Air Warfare Center, West Trenton, New Jersey, with best-fit Cooper type curve. (T, transmissivity; ft2/day, square feet per day; S, storage coefficient) |
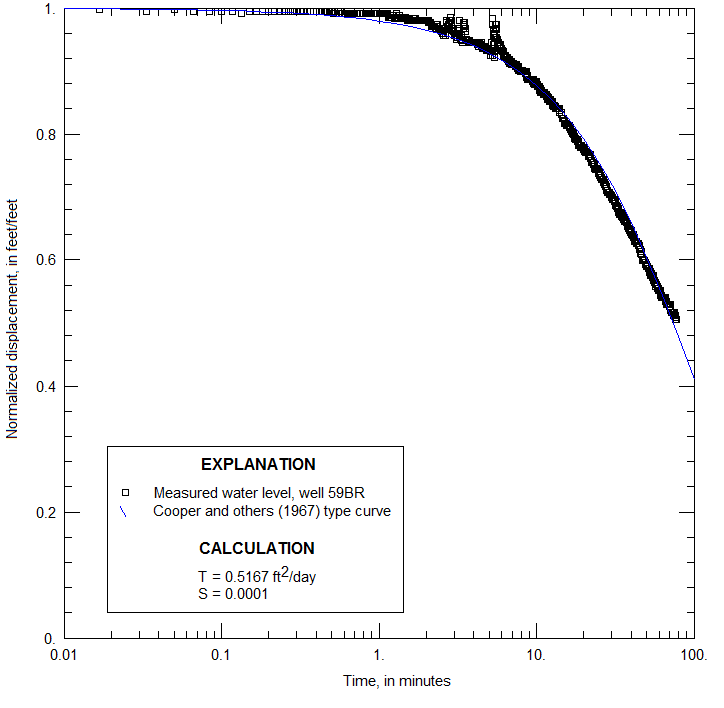
Figure 36. Normalized water-level displacement as a function of time for well 59BR, Naval Air Warfare Center, West Trenton, New Jersey, with best-fit Cooper type curve. (T, transmissivity; ft2/day, square feet per day; S, storage coefficient) |
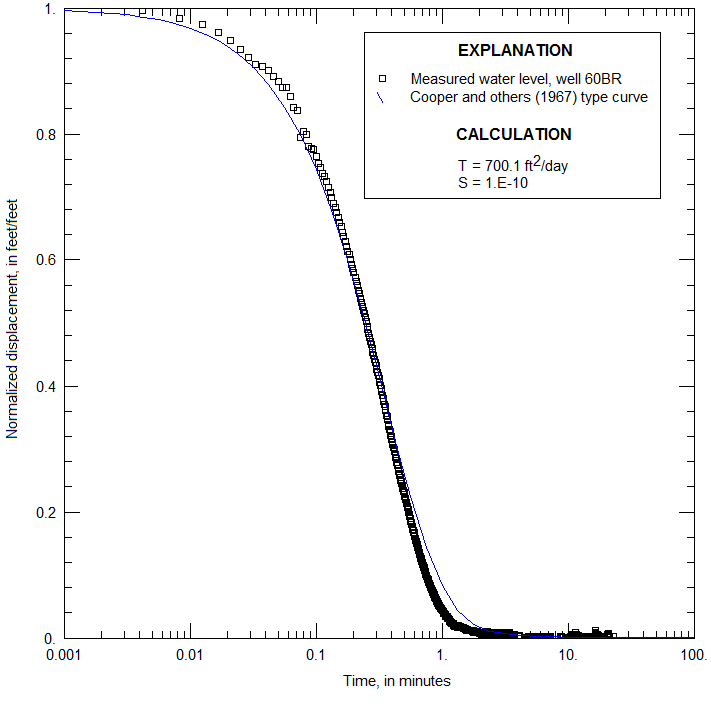
Figure 37. Normalized water-level displacement as a function of time for well 60BR, Naval Air Warfare Center, West Trenton, New Jersey, with best-fit Cooper type curve. (T, transmissivity; ft2/day, square feet per day; S, storage coefficient) |
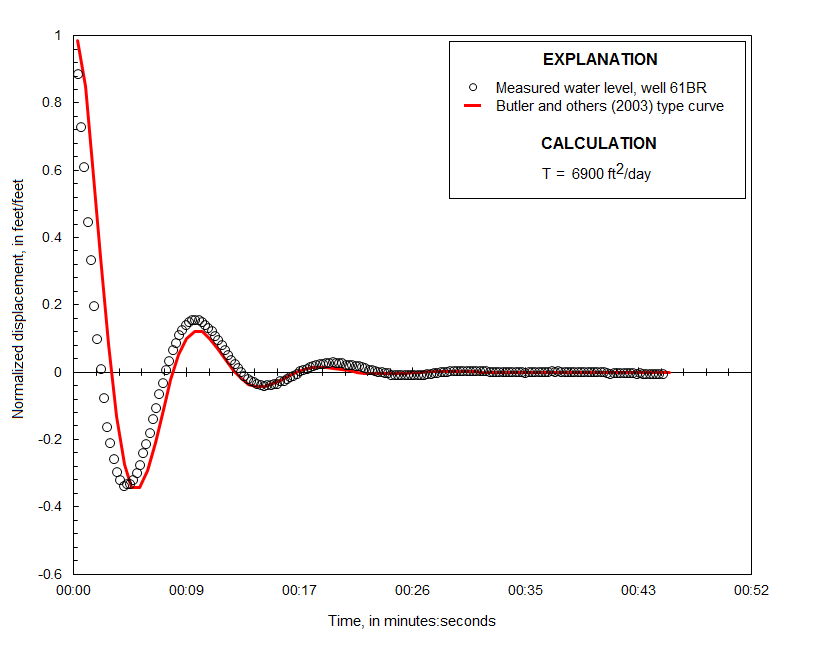
Figure 38. Normalized water-level displacement as a function of time for well 61BR, Naval Air Warfare Center, West Trenton, New Jersey, with best-fit Butler type curve. (T, transmissivity; ft2/day, square feet per day) |
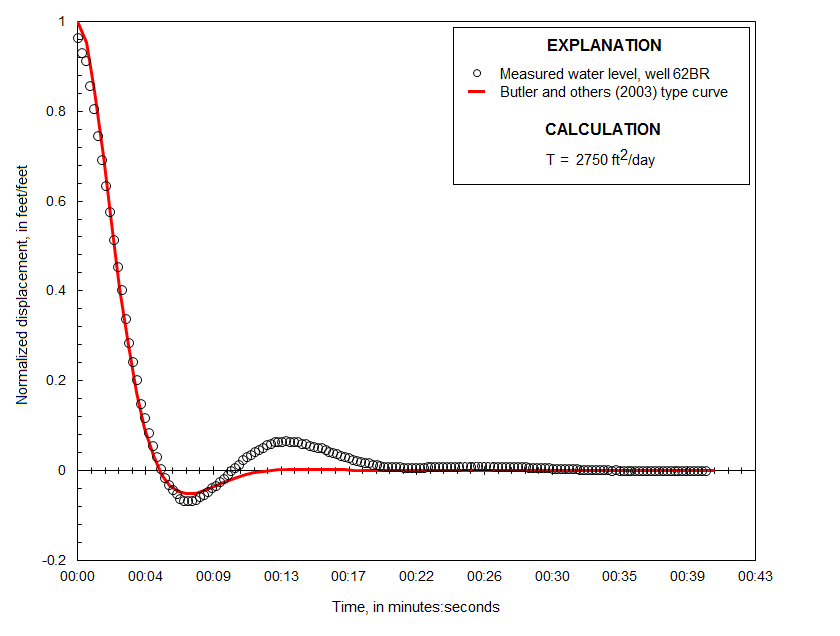
Figure 39. Normalized water-level displacement as a function of time for well 62BR, Naval Air Warfare Center, West Trenton, New Jersey, with best-fit Butler type curve. (T, transmissivity; ft2/day, square feet per day) |
|

