|
|
Figures 40–46
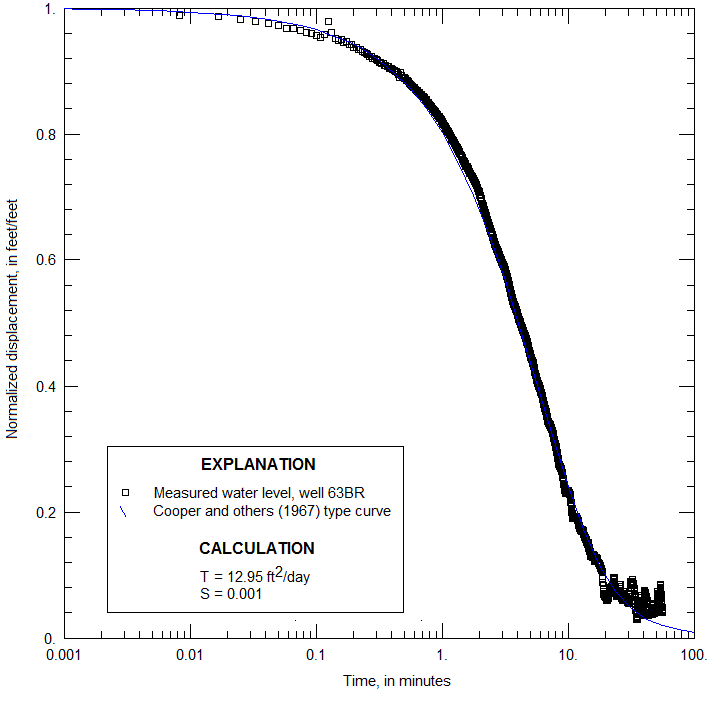
Figure 40. Normalized water-level displacement as a function of time for well 63BR, Naval Air Warfare Center, West Trenton, New Jersey, with best-fit Cooper type curve. (T, transmissivity; ft2/day, square feet per day; S, storage coefficient) |
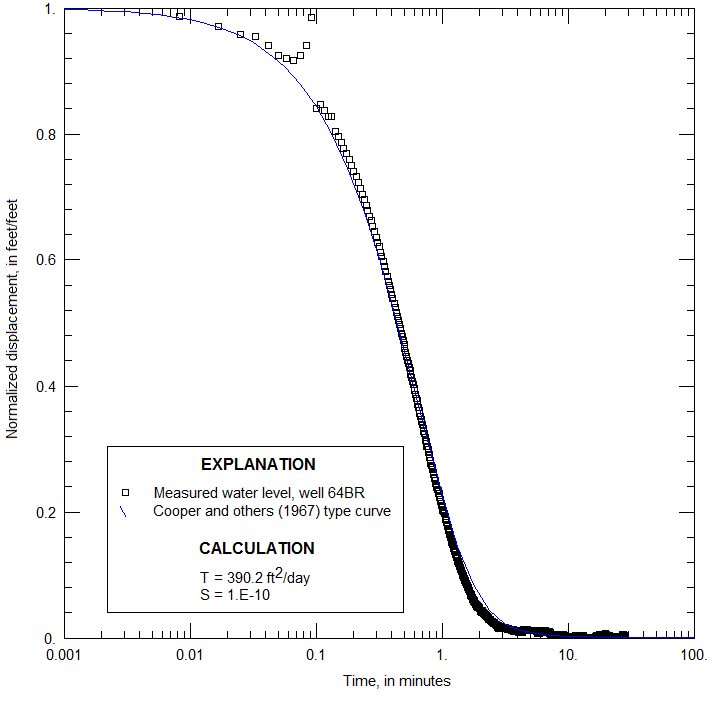
Figure 41. Normalized water-level displacement as a function of time for well 64BR, Naval Air Warfare Center, West Trenton, New Jersey, with best-fit Cooper type curve. (T, transmissivity; ft2/day, square feet per day; S, storage coefficient) |
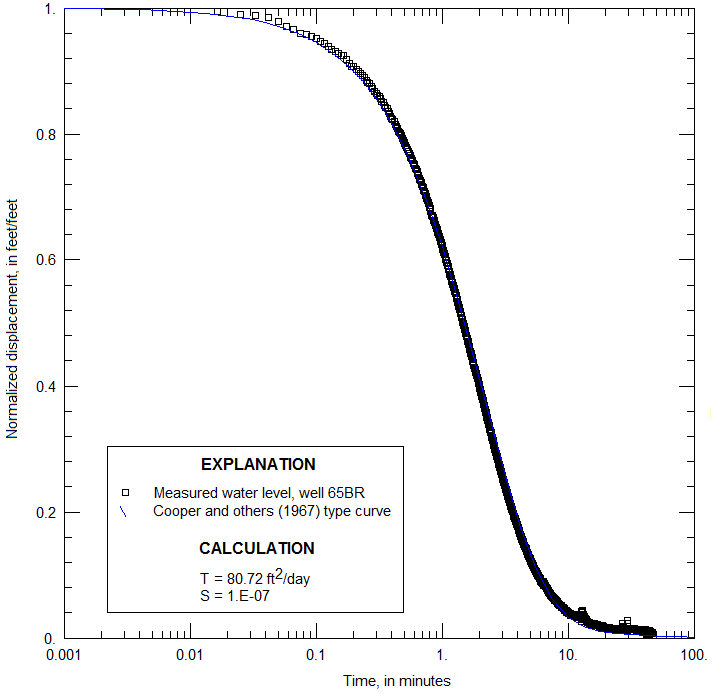
Figure 42. Normalized water-level displacement as a function of time for well 65BR, Naval Air Warfare Center, West Trenton, New Jersey, with best-fit Cooper type curve. (T, transmissivity; ft2/day, square feet per day; S, storage coefficient) |
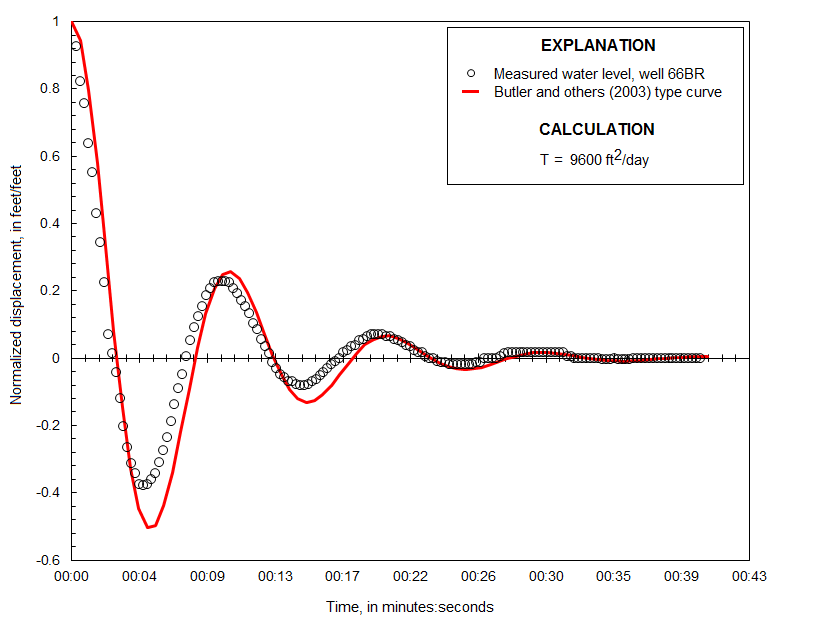
Figure 43. Normalized water-level displacement as a function of time for well 66BR, Naval Air Warfare Center, West Trenton, New Jersey, with best-fit Butler type curve. (T, transmissivity; ft2/day, square feet per day) |
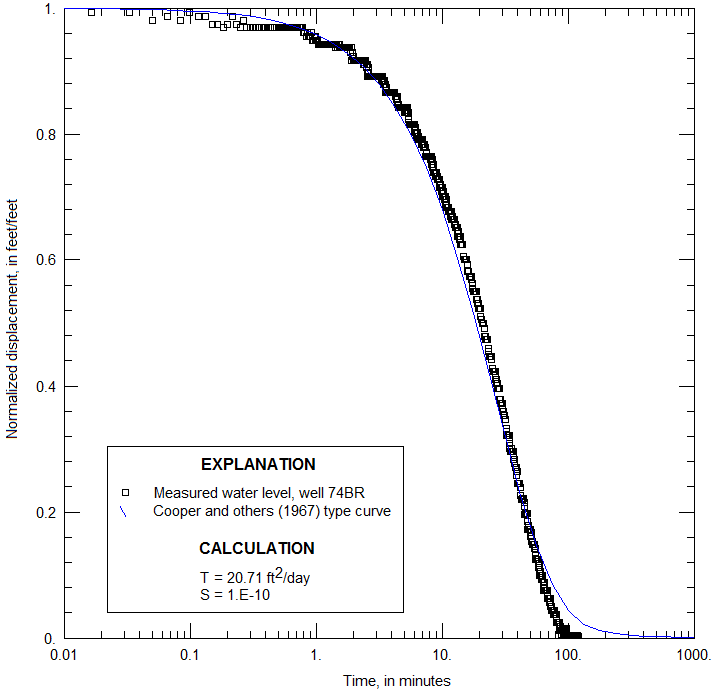
Figure 44. Normalized water-level displacement as a function of time for well 74BR, Naval Air Warfare Center, West Trenton, New Jersey, with best-fit cooper type curve. (T, transmissivity; ft2/day, square feet per day; S, storage coefficient) |
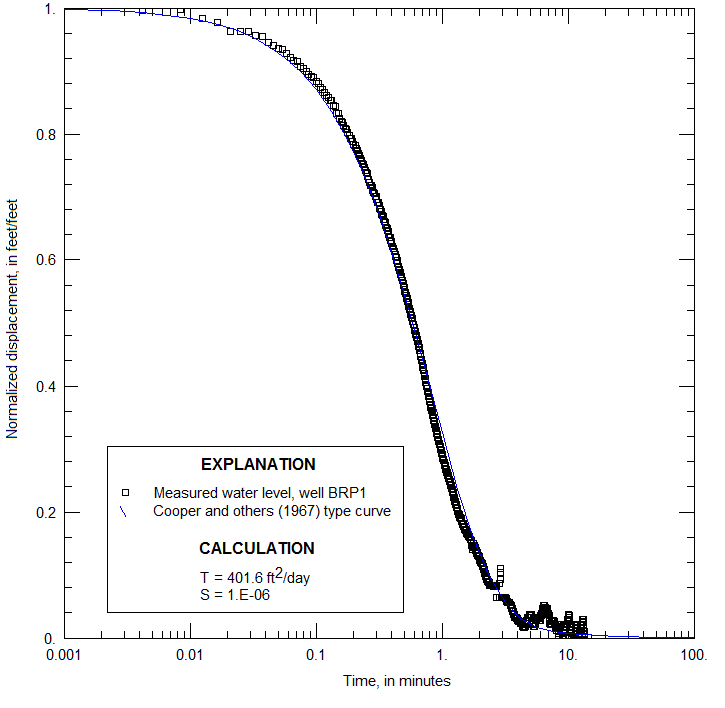
Figure 45. Normalized water-level displacement as a function of time for well BRP1, Naval Air Warfare Center, West Trenton, New Jersey, with best-fit Cooper type curve. (T, transmissivity; ft2/day, square feet per day; S, storage coefficient) |
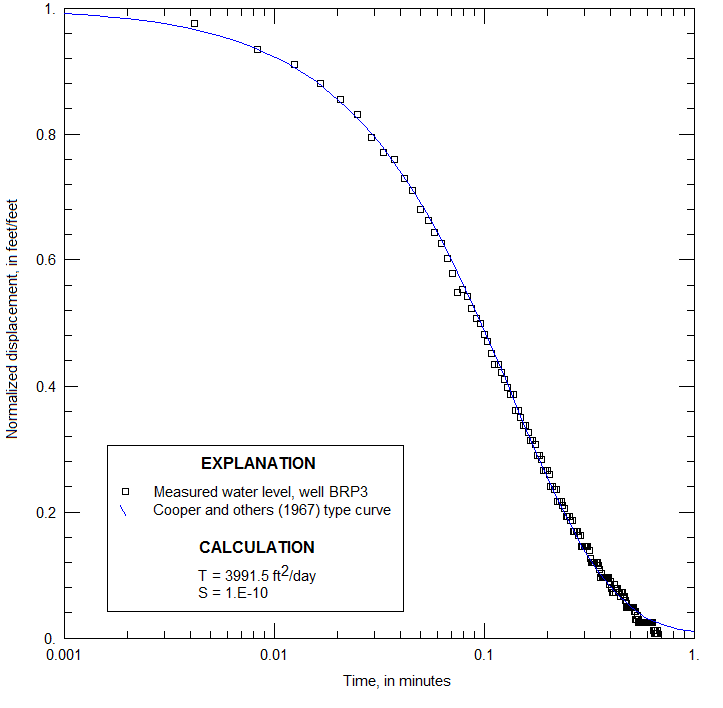
Figure 46. Normalized water-level displacement as a function of time for well BRP3, Naval Air Warfare Center, West Trenton, New Jersey, with best-fit Cooper type curve. (T, transmissivity; ft2/day, square feet per day; S, storage coefficient) |
|

