Interpretation of sea floor geologic units for Buzzards Bay, Massachusetts (BuzzardsBay_surfgeol, polygon shapefile; Geographic WGS 84)

Metadata also available as - [Outline] - [XML]

Frequently anticipated questions:


What does this data set describe?

Title:
Interpretation of sea floor geologic units for Buzzards Bay, Massachusetts (BuzzardsBay_surfgeol, polygon shapefile; Geographic WGS 84)
Abstract:
Geologic, sediment texture, and physiographic zone maps characterize the sea floor of Buzzards Bay, Massachusetts. These maps were derived from interpretations of seismic-reflection profiles, high-resolution bathymetry, acoustic-backscatter intensity, bottom photographs, and surficial sediment samples. The interpretation of the seismic stratigraphy and mapping of glacial and Holocene marine units provided a foundation on which the surficial maps were created. This mapping is a result of a collaborative effort between the U.S. Geological Survey and the Massachusetts Office of Coastal Zone Management to characterize the surface and subsurface geologic framework offshore of Massachusetts.
  1. How might this data set be cited?
    Foster, David S., 2014, Interpretation of sea floor geologic units for Buzzards Bay, Massachusetts (BuzzardsBay_surfgeol, polygon shapefile; Geographic WGS 84): Open-File Report 2014-1220, U.S. Geological Survey, Coastal and Marine Geology Program, Woods Hole Coastal and Marine Science Center, Woods Hole, MA.

    Online Links:

    This is part of the following larger work.

    Foster, David S., Baldwin, Wayne E., Barnhardt, Walter A., Schwab, William C., Ackerman, Seth D., Andrews, Brian D., and Pendleton, Elizabeth A., 2014, Shallow Geology, Sea-Floor Texture, Physiographic Zones of Buzzards Bay, Massachusetts: Open-File Report 2014-1220, U.S. Geological Survey, Reston, VA.

    Online Links:

  2. What geographic area does the data set cover?
    West_Bounding_Coordinate: -71.122296
    East_Bounding_Coordinate: -70.615957
    North_Bounding_Coordinate: 41.692179
    South_Bounding_Coordinate: 41.369363
  3. What does it look like?
    https://pubs.usgs.gov/of/2014/1220/GIS_catalog/SurficialGeology/surfgeo_browse.png (PNG)
    Image of the surficial geology shapefile for Buzzards Bay
  4. Does the data set describe conditions during a particular time period?
    Beginning_Date: 28-May-2009
    Ending_Date: 31-Aug-2011
    Currentness_Reference:
    ground condition of the source data that this interpretation is based on
  5. What is the general form of this data set?
    Geospatial_Data_Presentation_Form: vector digital data
  6. How does the data set represent geographic features?
    1. How are geographic features stored in the data set?
      This is a Vector data set. It contains the following vector data types (SDTS terminology):
      • G-polygon (671)
    2. What coordinate system is used to represent geographic features?
      Horizontal positions are specified in geographic coordinates, that is, latitude and longitude. Latitudes are given to the nearest 0.000001. Longitudes are given to the nearest 0.000001. Latitude and longitude values are specified in Decimal degrees. The horizontal datum used is D_WGS_1984.
      The ellipsoid used is WGS_1984.
      The semi-major axis of the ellipsoid used is 6378137.000000.
      The flattening of the ellipsoid used is 1/298.257224.
  7. How does the data set describe geographic features?
    BuzzardsBay_surfgeol
    Surficial geologic shapefile for Buzzards Bay (Source: U.S. Geological Survey)
    FID
    Internal feature number. (Source: ESRI) Sequential unique whole numbers that are automatically generated.
    Shape
    Feature geometry. (Source: Esri)
    Formal codeset
    Codeset Name:Polygon
    Codeset Source:Esri
    Coordinates defining the features.
    Geology
    Surficial geologic unit (Source: Seismic interpretations)
    Formal codeset
    Codeset Name:Qdt - Pleistocene glacial till and ice contact deposits (Qdt) are drift composed of poorly sorted mud, sand, gravel and boulders (typically 10 to 30 m thick, exceeds 60 m along the Buzzards Bay moraine). Seismic penetration is limited in chirp profiles. Boomer profiles locally penetrate Qdt. Internal reflections are irregular or parabolic. Underlies the transgressive (Ut) and regressive (Ur) unconformities and overlies the top of bedrock, the U1 unconformity. Qdt crops out at the sea-floor forming ridges and ledges, which are composed of sand, gravel, and in places, boulders.
    Codeset Source:U.S. Geological Survey
    Formal codeset
    Codeset Name:Qdm - Pleistocene Buzzards Bay end moraine (Qdm) composed of poorly sorted mud, sand, gravel and boulders (typically 10 to 30 m thick, exceeds 60 m along the Buzzards Bay moraine). Seismic penetration is limited in chirp profiles. Similar to Qdt, boomer profiles locally penetrate Qdm. Internal reflections are irregular or parabolic. Underlies the transgressive (Ut) and regressive (Ur) unconformities and overlies the top of bedrock, the U1 unconformity. Qdm crops out at the sea-floor forming ridges and ledges, which are composed of sand, gravel, and in places, boulders.
    Codeset Source:U.S. Geological Survey
    Formal codeset
    Codeset Name:Qdl - Pleistocene glaciolacustrine (glaciodeltaic and lake floor) is stratified drift composed of mud and sand (locally up to 30 m thick). Produces strong to weak vertically laminated and horizontal to dipping reflections. Underlies the transgressive (Ut) and regressive (Ur) unconformities and typically drapes Qdt/Qdm.
    Codeset Source:U.S. Geological Survey
    Formal codeset
    Codeset Name:Qdf - Pleistocene glaciofluvial (outwash and glaciodeltaic) is stratified drift composed of sand and gravel (typically 5 to 10 m thick). Contains vertically laminated, roughly horizontal to broadly undulating reflectors, cut and fill structures and zones of acoustic transparency. Underlies Ut and Ur. Typically overlies Qdl or Qdt and may locally incise Qdl.
    Codeset Source:U.S. Geological Survey
    Formal codeset
    Codeset Name:Qfe/Qmn- Holocene nearshore marine unit (Qmn is mostly muddy deposits in the deeper basins and becoming sandy along the shallower margins of the survey area. Dredge spoil deposits are excluded. Generally acoustically transparent with faint, flat-lying reflections locally. Overlies transgressive unconformity (Ut).Holocene fluvial and estuarine unit is fluvial sands and gravels, and estuarine sands and muds (Qfe) that, together with Qmn, fill incised fluvial valleys (up to >20 m thick). Produces vertically laminated, horizontal to concave-up reflections and zones of acoustic transparency; local indications of cut-and-fill. Bounded above and below by transgressive (Ut) and regressive (Ur) unconformities, respectively. Qfe is often associated with acoustic attenuation from gas, which obscures this unit and the Ur unconformity and underlying units. Qfe/Qmn are thickest where they fill fluvial incised valleys.
    Codeset Source:U.S. Geological Survey
    Area_SqKm
    Geologic unit outcrop area in square kilometers (UTM, zone 19, WGS84) (Source: seismic interpretations)
    Range of values
    Minimum:0.000513
    Maximum:199.203575
    Units:Square Kilometers
    Resolution:0.000001
    Entity_and_Attribute_Overview:
    Three major seismic stratigraphic units, Proterozoic bedrock (Z), glacial drift (Qd), and postglacial deposits (Qfe/Qmn), are separated by two regional unconformities (reflectors) defined by reflections U1, Ur (fig. 13). In addition, glacial drift (Qd) is divided into subunits based on seismic facies and Qfe/Qmn is divided into subunits by a regional unconformity defined by the reflection at Ut.
    Z, inferred to be undifferentiated Proterozoic bedrock based on what has been mapped onshore (Zen and others, 1984), was the deepest unit, and where the upper surface was iinterpreted as an erosional unconformity, where the reflection at U1 is highly irregular and diffracted. U1 is overlain by glacial till and ice-contact deposits (Qdt or Qdm) or stratified drift (Qdl and Qdf). Z only occurs at the sea floor outside of the seismic survey area.
    Qdt includes Pleistocene glacial till and ice contact deposits and Qdm includes till and ice contact deposits of the Buzzards Bay moraine. Irregular reflections and hyperbolic diffractions within Qdt and Qdm and where these units intersect the sea floor, were interpreted as acoustic signatures of boulders.
    Pleistocene stratified glacial drift includes the units Qdl, Pleistocence glaciolacustine and Qdf, glaciofluvial that were deposited by glacial meltwater. Qdf typically overlies Qdl and in places a local glaciofluvial erosional unconformity at the base of Qdf dissects Qdl. The discontinuous and undulation reflections within Qdf are cut-and-fill features that have eroded Qdl in places.
    Ur is the late Wisconsinan to early Holocene regressive unconformity, which was initially formed by proglacial lake drainage and by ice-distal meltwater fluvial erosion and was later modified by continued subaerial fluvial erosion until the early Holocene. This postglacial drainage surface shows a single main channel originating from points at the head of the bay and associated tributary channels. Towards the mouth of the bay, this channel appears to bifurcate, having branches that flowed through breaches in the complex topography formed by glacial drift. Ur is a composite unconformity because it merges with Ut primarily at the interfluves
    Qfe was deposited within fluvial and later in estuarine environments with the onset of the marine transgression. Qfe fills the fluvial valleys incised by Ur into the surface of Pleistocene glacial deposits. Qfe is thickest in the thalwegs of the fluvial cut valleys and is thin to absent on interfluves. The maximum thickness of Qfe could not be determined where biogenic gas within Qfe attenuates the seismic reflections.
    Ut , a continuous and flat horizon was interpreted to be a transgressive erosional unconformity formed by waves based erosion during the Holocene transgression. Ut is not well defined above Qfe within the fluvial valleys, with some exceptions (fig. 16), and therefore the thickness and distribution of Qfe was not mapped. Data quality and resolution were limiting factors, but also because much the seismic signal within and just above Qfe and the reflection at Ut were attenuated by gas. Ur and where Ur merges with Ut separates glacial from postglacial units. This unconformity marks the surface of glacial deposits.
    Qmn is a post-transgressive Holocene nearshore marine unit overlying Ut and older stratigraphic units (figs. 14-16). Qmn deposits are predominantly muddy within the deeper areas of the basin and are sandier close to shore or where paleoshorelines existed.
    We mapped the total thickness and distribution of postglacial sediment (Qfe and Qmn), which includes fluvial, estuarine, and marine deposits and are bounded by the Ur/Ut composite unconformity and the sea floor. The thickness ranges from 0 to 21 meters. The thicknesses of dredge spoil deposits, which range from 0 to 4 meters thick, were not included in the total postglacial sediment thickness. All thicknesses were calculated using a seismic velocity of 1,500 m/s.
    The postglacial sediment thickness (fig. 19), including thickness of dredge spoil, was subtracted from a regional swath-bathymetry DEM to produce a structure surface of the top of glacial deposits relative to NAVD 88 (fig. 18).
    Entity_and_Attribute_Detail_Citation:
    The seismic stratigraphic units used here as attributes for surficial geology were first described by Rob and Oldale (1977) and O'Hara and Oldale (1980). The interpretation of the surficial extent of these units have been refined in this study using the dense, high resolution, seismic surveys of Pendleton and others (2012), Turecek and others (2012), Ackerman and others (2013) and Pendleton and others (2014).

Who produced the data set?

  1. Who are the originators of the data set? (may include formal authors, digital compilers, and editors)
  2. Who also contributed to the data set?
  3. To whom should users address questions about the data?
    David S. Foster
    U.S. Geological Survey
    Geologist
    U.S. Geological Survey
    Woods Hole, MA
    USA

    508-548-8700 x2271 (voice)
    508-457-2310 (FAX)
    dfoster@usgs.gov

Why was the data set created?

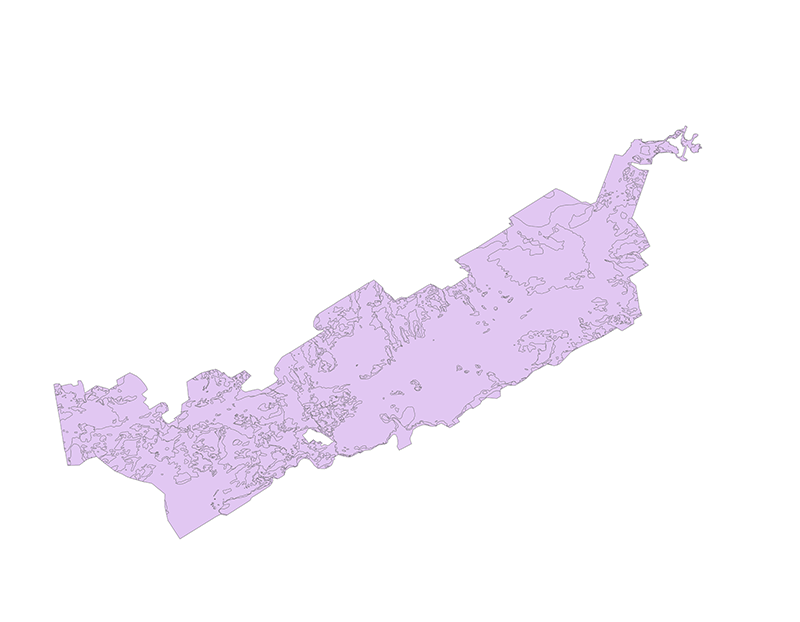
This data set describes sea-floor geology of Buzzards Bay. Polygons are used to indicate the areal distribution of sea-floor outcrop for sub-surface stratigraphic units interpreted in high-resolution seismic reflection data. These data are useful for assessing relations between geologic framework, sea-bed morphology, and sediment textural trends.

How was the data set created?

  1. From what previous works were the data drawn?
    Pendleton and others, 2012 (source 1 of 5)
    Pendleton, E.A., Twichell, D.C., Foster, D.S., Worley, C.R, Irwin, B.J., and Danforth, W.W., 2012, High-resolution geophysical data from the sea floor surrounding the Western Elizabeth Islands, Massachusetts: Open-File Report 2011-1184, U.S. Geological Survey, Reston, VA.

    Online Links:

    Type_of_Source_Media: online
    Source_Contribution:
    This report provided source geophysical (sidescan, bathymetry, and seismic-reflection profiles) for the area of Buzzards Bay surrounding the western Elizabeth Islands. High-resolution chirp seismic-reflection profiles were collected during U.S. Geological Survey field activity 2010-003-FA using an EdgeTech Geo-Star full spectrum sub-bottom (FSSB) system and SB-424 towfish. Thorough descriptions of acquisition and processing parameters for the survey are provided by Pendleton and others (2012) in the methods section and seismic-reflection metadata. Shallow geologic framework and surficial geology were interpreted from post-processed chirp seismic-reflection profiles.
    Turecek and others, 2012 (source 2 of 5)
    Turecek, A.M., Danforth, W.W., Baldwin, W.E., and Barnhardt, W.A., 2012, High-resolution geophysical data collected within Red Brook Harbor, Buzzards Bay, Massachusetts, in 2009: Open-File Report 2010-1091, U.S. Geological Survey, Reston, VA.

    Online Links:

    Type_of_Source_Media: online
    Source_Contribution:
    This report provided the source geophysical (sidescan, bathymetry, and seismic-reflection profiles), sediment sample and bottom photograph data for Buzzards Bay in the area of Red Brook Harbor. Surveying was conducted aboard the R/V Rafael during U.S. Geological Survey field activity 2009-018-FA. Seismic reflection profiles were collected with a Knudsen Engineering, Ltd. (KEL) Chirp 3202 dual-frequency (centered at 3.5- and 200-kHz) Chirp system. Thorough descriptions of acquisition and processing parameters for the survey are provided by Turecek and others (2012) in the methods section and seismic-reflection metadata. Shallow geologic framework and surficial geology were interpreted from post-processed chirp seismic-reflection profiles
    Ackerman and others, 2013 (source 3 of 5)
    Ackerman, S.D., Andrews, B.D., Foster, D.S., Baldwin, W.E., and Schwab, W.C., 2013, High-Resolution Geophysical Data from the Inner Continental Shelf: Buzzards Bay, Massachusetts: Open-File Report 2012-1002, U.S. Geological Survey, Reston, VA.

    Online Links:

    Type_of_Source_Media: online
    Source_Contribution:
    This report provided the source geophysical (sidescan, bathymetry, and seismic-reflection profiles) for Buzzards Bay. The mapping was conducted onboard the Megan T. Miller (2009, 2010) and the Scarlett Isabella (2011) during U.S. Geological Survey field activities 2009-002-FA , 2010-004-FA, and 2011-004-FA. Chirp seismic-reflection data were collected in the Buzzards Bay survey area using an EdgeTech Geo-Star FSSB subbottom profiling system and an SB-0512i towfish. Thorough descriptions of acquisition and processing parameters for each survey are provided by Ackerman and others (2013) in the methods section and seismic-reflection metadata. Shallow geologic framework and surficial geology were interpreted from post-processed chirp seismic-reflection profiles
    Pendleton and others, 2014 (source 4 of 5)
    Pendleton, E.A., Andrews, B.D., Danforth, W.W., and Foster, D.S., 2014, High-resolution geophysical data collected aboard the U.S. Geological Survey research vessel Rafael to supplement existing datasets from Buzzards Bay and Vineyard Sound, Massachusetts: Open-File Report 2013-1020, U.S. Geological Survey, Reston, VA.

    Online Links:

    Type_of_Source_Media: online
    Source_Contribution:
    This report provided the source geophysical (sidescan, bathymetry, and seismic-reflection profiles) for Buzzards Bay in the area of Naushon Island and seismic reflection profiles in northeast Buzzards Bay. These areas were surveyed with the RV Rafael in 2010 and 2011 during U.S. Geological Survey field activities 2010-047-FA and 2011-013. In 2010, seismic-reflection data were acquired with a boomer source and GeoEel 8-channel streamer. In 2011, high-resolution chirp seismic data were collected using a dual frequency (3.5 and 200 kHz) Knudsen Engineering Limited (KEL) Chirp 3202 system. Thorough descriptions of acquisition and processing parameters for each survey are provided by Pendleton and others (2014) in the methods section and seismic-reflection metadata. Shallow geologic framework and surficial geology were interpreted from post-processed chirp seismic-reflection profiles
    Ackerman and others, 2014 (source 5 of 5)
    Ackerman, S.D., Pappal, A.L., Huntley, E.C., Blackwood, D.S., and Schwab, W.C., 2014, Geological Sampling Data and Benthic Biota Classification: Buzzards Bay and Vineyard Sound, Massachusetts: Open File Report 2014-1220, U.S. Geological Survey, Reston, VA.

    Online Links:

    Type_of_Source_Media: online
    Source_Contribution:
    This report provided high-resolution digital photographs of the Buzzards Bay sea floor. At each station, the USGS SEABOSS was towed approximately one meter off the bottom at speeds of less than one knot. Because the recorded position is actually the position of the GPS antenna on the survey vessel, not the SEABOSS sampler, the estimated horizontal accuracy of the sample location is ± 30 meters (m). Photographs were obtained using a Konica-Minolta DiMAGE A2 digital still camera, and continuous video was collected from a Kongsberg Simrad OE1365 high-resolution color video camera, usually for 5 to 15 minutes. These data were important in defining rocky zones where sediment samples do not exist.
  2. How were the data generated, processed, and modified?
    Date: 2012 (process 1 of 4)
    Chirp and boomer seismic-reflection data were interpreted using Landmark SeisWorks 2D (R5000) seismic interpretation software. Interpretation consisted of identifying and digitizing erosional unconformities defining the boundaries between Holocene, Pleistocene, and pre-Quaternary seismic units, and digitizing the extent over which each of the defined sub-surface seismic units crops out on the sea floor. The digitized Sea-floor outcrop extents for each seismic unit were sampled at a 10-meter along track interval and exported from SeisWorks as ASCII text. The resultant text file was imported into ArcMap (9.3.1) as point features (easting, northing, seismic unit) using the 'Add XY data' function, then saved as a point shapefile (UTM, Zone 19N, WGS84). Person who carried out this activity:
    David S. Foster
    U.S. Geological Survey
    Geologist
    U.S. Geological Survey
    Woods Hole, MA
    USA

    508-5488700 x2271 (voice)
    508-457-2310 (FAX)
    dfoster@usgs.gov
    Data sources used in this process:
    • All
    Date: 2013 (process 2 of 4)
    A feature dataset was generated inside a File Geodatabase (ArcCatalog version 9.3.1), and new topology rules were established to make sure that there were no overlapping polygons or accidental gaps between adjacent polygons. A polygon feature class of the seismic-reflection survey area was created by digitizing around a polyline shapefile of the profile tracklines (file > new > shapefile in ArcCatalog 9.3.1, then editor >'create new feature' in ArcMap 9.3.1). A new attribute field named 'Geology' was added to the feature class attribute table. The point shapefile containing the along track extents of seismic unit outcrop was then used to guide division of the larger survey area polygon into smaller polygons representative of individual seismic unit outcrop areas (using editor processes 'cut polygon feature', 'intersect', 'merge', and 'clip' in ArcMap 9.3.1). As each new polygon area was created, the 'Geology' attribute field was populated with the appropriate geologic unit label. Polygon editing was done at scales between 1:5,000 and 1:20,000, depending on the size of the outcrop area. The topology error inspector (ArcMap version 9.3.1) was used to find topology errors and fix them. Overlapping polygon errors and gaps were fixed. Area fields were generated automatically for all polygons in the File Geodatabase. Person who carried out this activity:
    David S. Foster
    U.S. Geological Survey
    Geologist
    U.S. Geological Survey
    Woods Hole, MA
    USA

    508-548-8700 x2271 (voice)
    508-457-2310 (FAX)
    dfoster@usgs.gov
    Data sources used in this process:
    • All
    Date: 2013 (process 3 of 4)
    The surficial geology polygon feature class was exported back to a shapefile and the 'Shape_Area' and 'Shape_Length' fields were deleted from its attribute table (ArcCatalog and ArcMap 9.3.1). XTools Pro (7.1.0) was then used to add and populate a new attribute field containing polygon area in square kilometers based on UTM, zone 19, WGS84. Finally, the shapefile was reprojected from UTM zone 19 N, WGS 84 to GCS WGS84 using ArcToolbox. Person who carried out this activity:
    David S. Foster
    U.S. Geological Survey
    Geologist
    U.S. Geological Survey
    Woods Hole, MA
    USA

    508-548-8700 x2271 (voice)
    508-457-2310 (FAX)
    dfoster@usgs.gov
    Data sources used in this process:
    • All
    Date: 13-May-2016 (process 4 of 4)
    Edits to the metadata were made to fix any errors that MP v 2.9.32 flagged. This is necessary to enable the metadata to be successfully harvested for various data catalogs. In some cases, this meant adding text "Information unavailable" or "Information unavailable from original metadata" for those required fields that were left blank. Other minor edits were probably performed (title, publisher, publication place, etc.). Empty fields were deleted. Links to the data were fixed. The metadata date (but not the metadata creator) was edited to reflect the date of these changes. The metadata available from a harvester may supersede metadata bundled within a download file. Compare the metadata dates to determine which metadata file is most recent. Person who carried out this activity:
    U.S. Geological Survey
    Attn: VeeAnn A. Cross
    Marine Geologist
    384 Woods Hole Rd.
    Woods Hole, MA

    508-548-8700 x2251 (voice)
    508-457-2310 (FAX)
    vatnipp@usgs.gov
  3. What similar or related data should the user be aware of?
    Robb, James M., and Oldale, Robert N., 1977, Preliminary geologic maps, Buzzards Bay, Massachusetts: U.S. Geological Survey Miscellaneous Field Studies Map MF-889, U.S. Geological Survey, Reston, VA.

    Online Links:

    Other_Citation_Details: 2 sheets
    O'Hara, Charles J., and Oldale, Robert N., 1980, Maps showing geology and shallow structure of eastern Rhode Island Sound and Vineyard Sound, Massachusetts: U.S. Geological Survey Miscellaneous Field Studies Map MF-1186, U.S. Geological Survey, Reston, VA.

    Online Links:

    Other_Citation_Details: 5 sheets

How reliable are the data; what problems remain in the data set?

  1. How well have the observations been checked?
  2. How accurate are the geographic locations?
    Navigational accuracy of the seismic-reflection data used for this interpretation was assumed to be ± 10 to 20 meters. Refer to seismic trackline metadata in Pendleton and others (2012; 2014), Turecek and others (2012,and Ackerman and others (2013) for specific seismic data acquisition parameters and accuracy reports. Additional navigational uncertainty in this interpretation arises from subjective digitizing of the seismic reflectors, sampling of the interpreted horizons at 10-m along track intervals prior to export from the seismic interpretation package, and heads up digitizing of the polygons defining individual areas of geologic unit outcrop. Considering these limitations, the boundaries between geologic outcrop units are considered to be accurate to within approximately ± 50 meters.
  3. How accurate are the heights or depths?
  4. Where are the gaps in the data? What is missing?
    All chirp and boomer seismic-reflection data collected during USGS Woods Hole Coastal and Marine Science Center field activities 2009-002-FA, 2010-003-FA, 2010-004-FA, 2010-047-FA, 2010-100-FA, 2011-004-FA, and 2011-013-FA were used to interpret the surficial geologic units.
  5. How consistent are the relationships among the observations, including topology?
    Chirp seismic-reflection data collected during USGS Woods Hole Coastal and Marine Science Center field activities 2009-002-FA, 2010-003-FA, 2010-004-FA, 2011-004-FA, and 2011-047-FA and boomer seismic-reflection data during USGS Woods Hole Coastal and Marine Science Center field activities 2010-047-FA and 2010-100-FA were used to interpret the surficial geology. These data were drawn and vetted for accuracy using the source input point sample data described in the processing steps and source contributions. Overlapping features and unintentional gaps within the survey area were identified using the topology checker in ArcMap (version 9.3.1) and corrected or removed.

How can someone get a copy of the data set?

Are there legal restrictions on access or use of the data?
Access_Constraints: None
Use_Constraints:
Not to be used for navigation. Public domain data from the U.S. Government are freely redistributable with proper metadata and source attribution. Please recognize the U.S. Geological Survey (USGS) as the source of this information. Additionally, there are limitations associated with qualitative sediment mapping interpretations. Because of the scale of the source geophysical data and the spacing of samples, not all changes in sea floor texture are captured. The data were mapped between 1:5,000 and 1:20,000, but the recommended scale for application of these data is 1:25,000. Not all digitized sea floor features contained sample information, so often the sea floor texture is characterized by the nearest similar feature that contains a sample. Conversely, sometimes a digitized feature contained multiple samples and not all of the samples within the feature were in agreement (of the same texture). In these cases the dominant sediment texture was chosen to represent the primary texture for the polygon. Samples from rocky areas often only consist of bottom photographs, because large particle size often prevents the recovery of a sediment sample. Bottom photo classification can be subjective, such that determining the sediment type that is greater than 50% of the view frame is estimated by the interpreter and may differ among interpreters. Bottom photo transects often reveal changes in the sea floor over distances of less than 100 m and these changes are often not observable in acoustic data. Heterogeneous sea floor texture can change very quickly, and many small-scale changes will not be detectable or mappable at a scale of 1:25,000. The boundaries of polygons are often inferred based on sediment samples, and even boundaries that are traced based on amplitude changes in geophysical data are subject to migration. Polygon boundaries should be considered an approximation of the location of a change in texture.
  1. Who distributes the data set? (Distributor 1 of 1)
    David S. Foster
    U.S. Geological Survey
    Geologist
    384 Woods Hole Rd.
    Woods Hole, MA
    USA

    508-548-8700 x2271 (voice)
    508-457-2310 (FAX)
    dfoster@usgs.gov
  2. What's the catalog number I need to order this data set? Downloadable Data
  3. What legal disclaimers am I supposed to read?
    Neither the U.S. Government, the Department of the Interior, nor the USGS, nor any of their employees, contractors, or subcontractors, make any warranty, express or implied, nor assume any legal liability or responsibility for the accuracy, completeness, or usefulness of any information, apparatus, product, or process disclosed, nor represent that its use would not infringe on privately owned rights. The act of distribution shall not constitute any such warranty, and no responsibility is assumed by the U.S. Geological Survey in the use of these data or related materials. Any use of trade, product, or firm names is for descriptive purposes only and does not imply endorsement by the U.S. Government
  4. How can I download or order the data?
  5. What hardware or software do I need in order to use the data set?
    These data are available in Environmental Systems Research Institute (Esri) shapefile format. The user must have software capable of importing and processing this data type.

Who wrote the metadata?

Dates:
Last modified: 13-May-2016
Metadata author:
U.S. Geological Survey
Attn: David S. Foster
Geologist
384 Woods Hole Rd.
Woods Hole, MA
USA

508-548-8700 x2271 (voice)
508-457-2310 (FAX)
dfoster@usgs.gov
Metadata standard:
FGDC Content Standards for Digital Geospatial Metadata (FGDC-STD-001-1998)

Generated by mp version 2.9.32 on Wed May 25 16:26:21 2016