Interpretation of sea floor geologic units for Vineyard and western Nantucket Sounds, Massachusetts (polygon shapefile; Geographic, WGS 84)

Metadata also available as - [Outline] - [Parseable text] - [XML]

Frequently anticipated questions:


What does this data set describe?

Title:
Interpretation of sea floor geologic units for Vineyard and western Nantucket Sounds, Massachusetts (polygon shapefile; Geographic, WGS 84)
Abstract:
Geologic, sediment texture, and physiographic zone maps characterize the sea floor of Vineyard and western Nantucket Sounds, Massachusetts. These maps were derived from interpretations of seismic-reflection profiles, high-resolution bathymetry, acoustic-backscatter intensity, bottom photographs, and surficial sediment samples. The interpretation of the seismic stratigraphy and mapping of glacial and Holocene marine units provided a foundation on which the surficial maps were created. This mapping is a result of a collaborative effort between the U.S. Geological Survey and the Massachusetts Office of Coastal Zone Management to characterize the surface and subsurface geologic framework offshore of Massachusetts.
  1. How should this data set be cited?

    Baldwin, Wayne, 2016, Interpretation of sea floor geologic units for Vineyard and western Nantucket Sounds, Massachusetts (polygon shapefile; Geographic, WGS 84): Open-File Report 2016-1119, U.S. Geological Survey, Coastal and Marine Geology Program, Woods Hole Coastal and Marine Science Center, Woods Hole, MA.

    Online Links:

    This is part of the following larger work.

    Baldwin, Wayne E. , Foster, David S. , Pendleton, Elizabeth A. , Barnhardt, Walter A. , Schwab, William C. , Andrews, Brian D. , and Ackerman, Seth D. , 2016, Shallow Geology, Sea-Floor Texture, and Physiographic Zones of Vineyard and western Nantucket Sounds, Massachusetts: Open-File Report 2016-1119, U.S. Geological Survey, Reston, VA.

    Online Links:

  2. What geographic area does the data set cover?

    West_Bounding_Coordinate: -71.028732
    East_Bounding_Coordinate: -70.431894
    North_Bounding_Coordinate: 41.539837
    South_Bounding_Coordinate: 41.321217

  3. What does it look like?

    <https://pubs.usgs.gov/of/2016/1119/GIS_catalog/SurficialGeology/VineyardNantucketSound_surfgeol.png> (PNG)
    Image of the surficial geology shapefile for Vineyard and western Nantucket Sounds

  4. Does the data set describe conditions during a particular time period?

    Beginning_Date: 02-Jun-2009
    Ending_Date: 31-Aug-2011
    Currentness_Reference:
    ground condition of the source data that this interpretation is based on

  5. What is the general form of this data set?

    Geospatial_Data_Presentation_Form: vector digital data

  6. How does the data set represent geographic features?

    1. How are geographic features stored in the data set?

      This is a Vector data set. It contains the following vector data types (SDTS terminology):

      • G-polygon (671)

    2. What coordinate system is used to represent geographic features?

      Horizontal positions are specified in geographic coordinates, that is, latitude and longitude. Latitudes are given to the nearest 0.000001. Longitudes are given to the nearest 0.000001. Latitude and longitude values are specified in Decimal degrees.

      The horizontal datum used is D_WGS_1984.
      The ellipsoid used is WGS_1984.
      The semi-major axis of the ellipsoid used is 6378137.000000.
      The flattening of the ellipsoid used is 1/298.257224.

  7. How does the data set describe geographic features?

    VineyardNantucketSound_surfgeol
    Surficial geologic shapefile for Vineyard and western Nantucket Sounds (Source: U.S. Geological Survey)

    FID
    Internal feature number. (Source: ESRI)

    Sequential unique whole numbers that are automatically generated.

    Shape
    Feature geometry. (Source: Esri)

    Formal codeset
    Codeset Name:Polygon
    Codeset Source:Esri

    Coordinates defining the features.

    Geology
    Surficial geologic unit (Source: Seismic interpretations)

    Formal codeset
    Codeset Name:Qdt - Pleistocene glacial till and ice contact deposits - Drift composed of poorly sorted mud, sand, gravel, and boulders, that produce rugged topography where they crop out at the seafloor. While seismic penetration is typically limited, these units produce chaotic reflectors with common diffraction hyperbolae. Underlies Ut and Ur, and in places overlie the fluvial unconformity U1, and the tops of older Pleistocene till and drift and Cretaceous and Tertiary coastal plain deposits (QTKu?).
    Codeset Source:U.S. Geological Survey

    Formal codeset
    Codeset Name:Qdm - Pleistocene Martha's Vineyard and Buzzards Bay end moraine deposits - Drift composed of poorly sorted mud, sand, gravel, and boulders that produce rugged topography where they crop out at the seafloor. Seismic penetration is limited in chirp profiles. Similar to Qdt, boomer profiles locally penetrate Qdm. Internal reflections are irregular or parabolic. Underlies the transgressive (Ut) and regressive (Ur) unconformities and in places overlies the U1 unconformity, and the tops of older Pleistocene till and drift (Qpw?) and Cretaceous and Tertiary coastal plain deposits (TKu?). Qdm crops out at the sea-floor forming ridges and ledges, which are composed of sand, gravel, and in places, boulders.
    Codeset Source:U.S. Geological Survey

    Formal codeset
    Codeset Name:Qdl - Pleistocene glaciolacustrine (glaciodeltaic and lake floor) - Stratified drift composed of mud and sand that produce strong to weak, vertically laminated, horizontal to gently dipping reflectors. Underlies Ut and Ur, and typically drapes glacial till (Qdt) and moraine (Qdm).
    Codeset Source:U.S. Geological Survey

    Formal codeset
    Codeset Name:Qdf - Pleistocene glaciofluvial (outwash) - Stratified drift composed of sand and gravel that produce vertically laminated, roughly horizontal to broadly undulating reflectors, cut and fill structures, and zones of acoustic transparency. Underlies Ut and Ur, and typically overlies glaciolacustrine (Qdl) and glacial till (Qdt).
    Codeset Source:U.S. Geological Survey

    Formal codeset
    Codeset Name:Qfe - Holocene fluvial and estuarine - Fluvial sands and gravels, and estuarine sands and muds (locally > 11 m thick) that fill incised fluvial valleys. Produces vertically laminated, horizontal to concave-up reflectors and zones of acoustic transparency; local indications of cut-and-fill. Bounded above and below by Ut and the regressive unconformity (Ur), respectively.
    Codeset Source:U.S. Geological Survey

    Formal codeset
    Codeset Name:Qmd - Holocene deepwater marine - Sandy muds and muddy sands (locally > 6 m thick) that blanket westernmost Vineyard Sound in water > 30 m deep. Generally acoustically transparent with faint, flat-lying reflectors locally. Overlies the transgressive unconformity (Ut).
    Codeset Source:U.S. Geological Survey

    Formal codeset
    Codeset Name:Qmn - Holocene nearshore marine - Mostly sandy deposits (typically <2 m but up to 17 m thick) that form tidal shoals and sand waves in central portions of the sounds, and beaches and bars locally along their nearshore margins. Generally acoustically transparent with faint, flat-lying reflectors, except within the tidal shoals, where internal reflectors are indicative of morphologic evolution. Overlies transgressive unconformity (Ut) and grades to Qmd westward toward Rhode Island Sound.
    Codeset Source:U.S. Geological Survey

    Area_km
    Geologic unit outcrop area in square kilometers (UTM, zone 19, WGS84) (Source: seismic interpretations)

    Range of values
    Minimum:0.001786
    Maximum:112.109448
    Units:Square Kilometers
    Resolution:0.000001

    Entity_and_Attribute_Overview:
    Four primary seismic stratigraphic units, undifferentiated Late Cretaceous(?), Tertiary(?), and (or) early Pleistocene(?) age coastal plain and continental shelf deposits and possibly late Pleistocene (pre-Wisconsinan?) age glacial drift (QTKu?), late Pleistocene glacial drift (Qd), Holocene age postglacial fluvial and estuarine (Qfe) deposits, and Holocene age postglacial marine (Qm) deposits are separated by three regional unconformities (reflectors) defined by reflections U1, Ur, and Ut (fig. 9). In addition, glacial drift (Qd) and postglacial marine (Qm) are each divided into subunits on the basis of seismic facies, stratigraphic position, and spatial distribution. For detailed descriptions of the interpreted seismic units and unconformities, please refer to the "Seismic Stratigraphy" and "Geologic Interpretation and Seismic Stratigraphic Mapping" sections of the "Results" in the larger work.
    Entity_and_Attribute_Detail_Citation:
    The seismic stratigraphic units used here as attributes for surficial geology were first described by O'Hara and Oldale (1980 and 1987). The interpretation of the surficial extent of these units have been refined in this study using the dense, high resolution, seismic surveys of Pendleton and others (2012), Andrews and others (2014), and Pendleton and others (2014).


Who produced the data set?

  1. Who are the originators of the data set? (may include formal authors, digital compilers, and editors)

  2. Who also contributed to the data set?

  3. To whom should users address questions about the data?

    Wayne Baldwin
    U.S. Geological Survey
    Geologist
    384 Woods Hole Rd.
    Woods Hole, MA 02543
    USA

    508-548-8700 x2226 (voice)
    508-457-2310 (FAX)
    wbaldwin@usgs.gov


Why was the data set created?

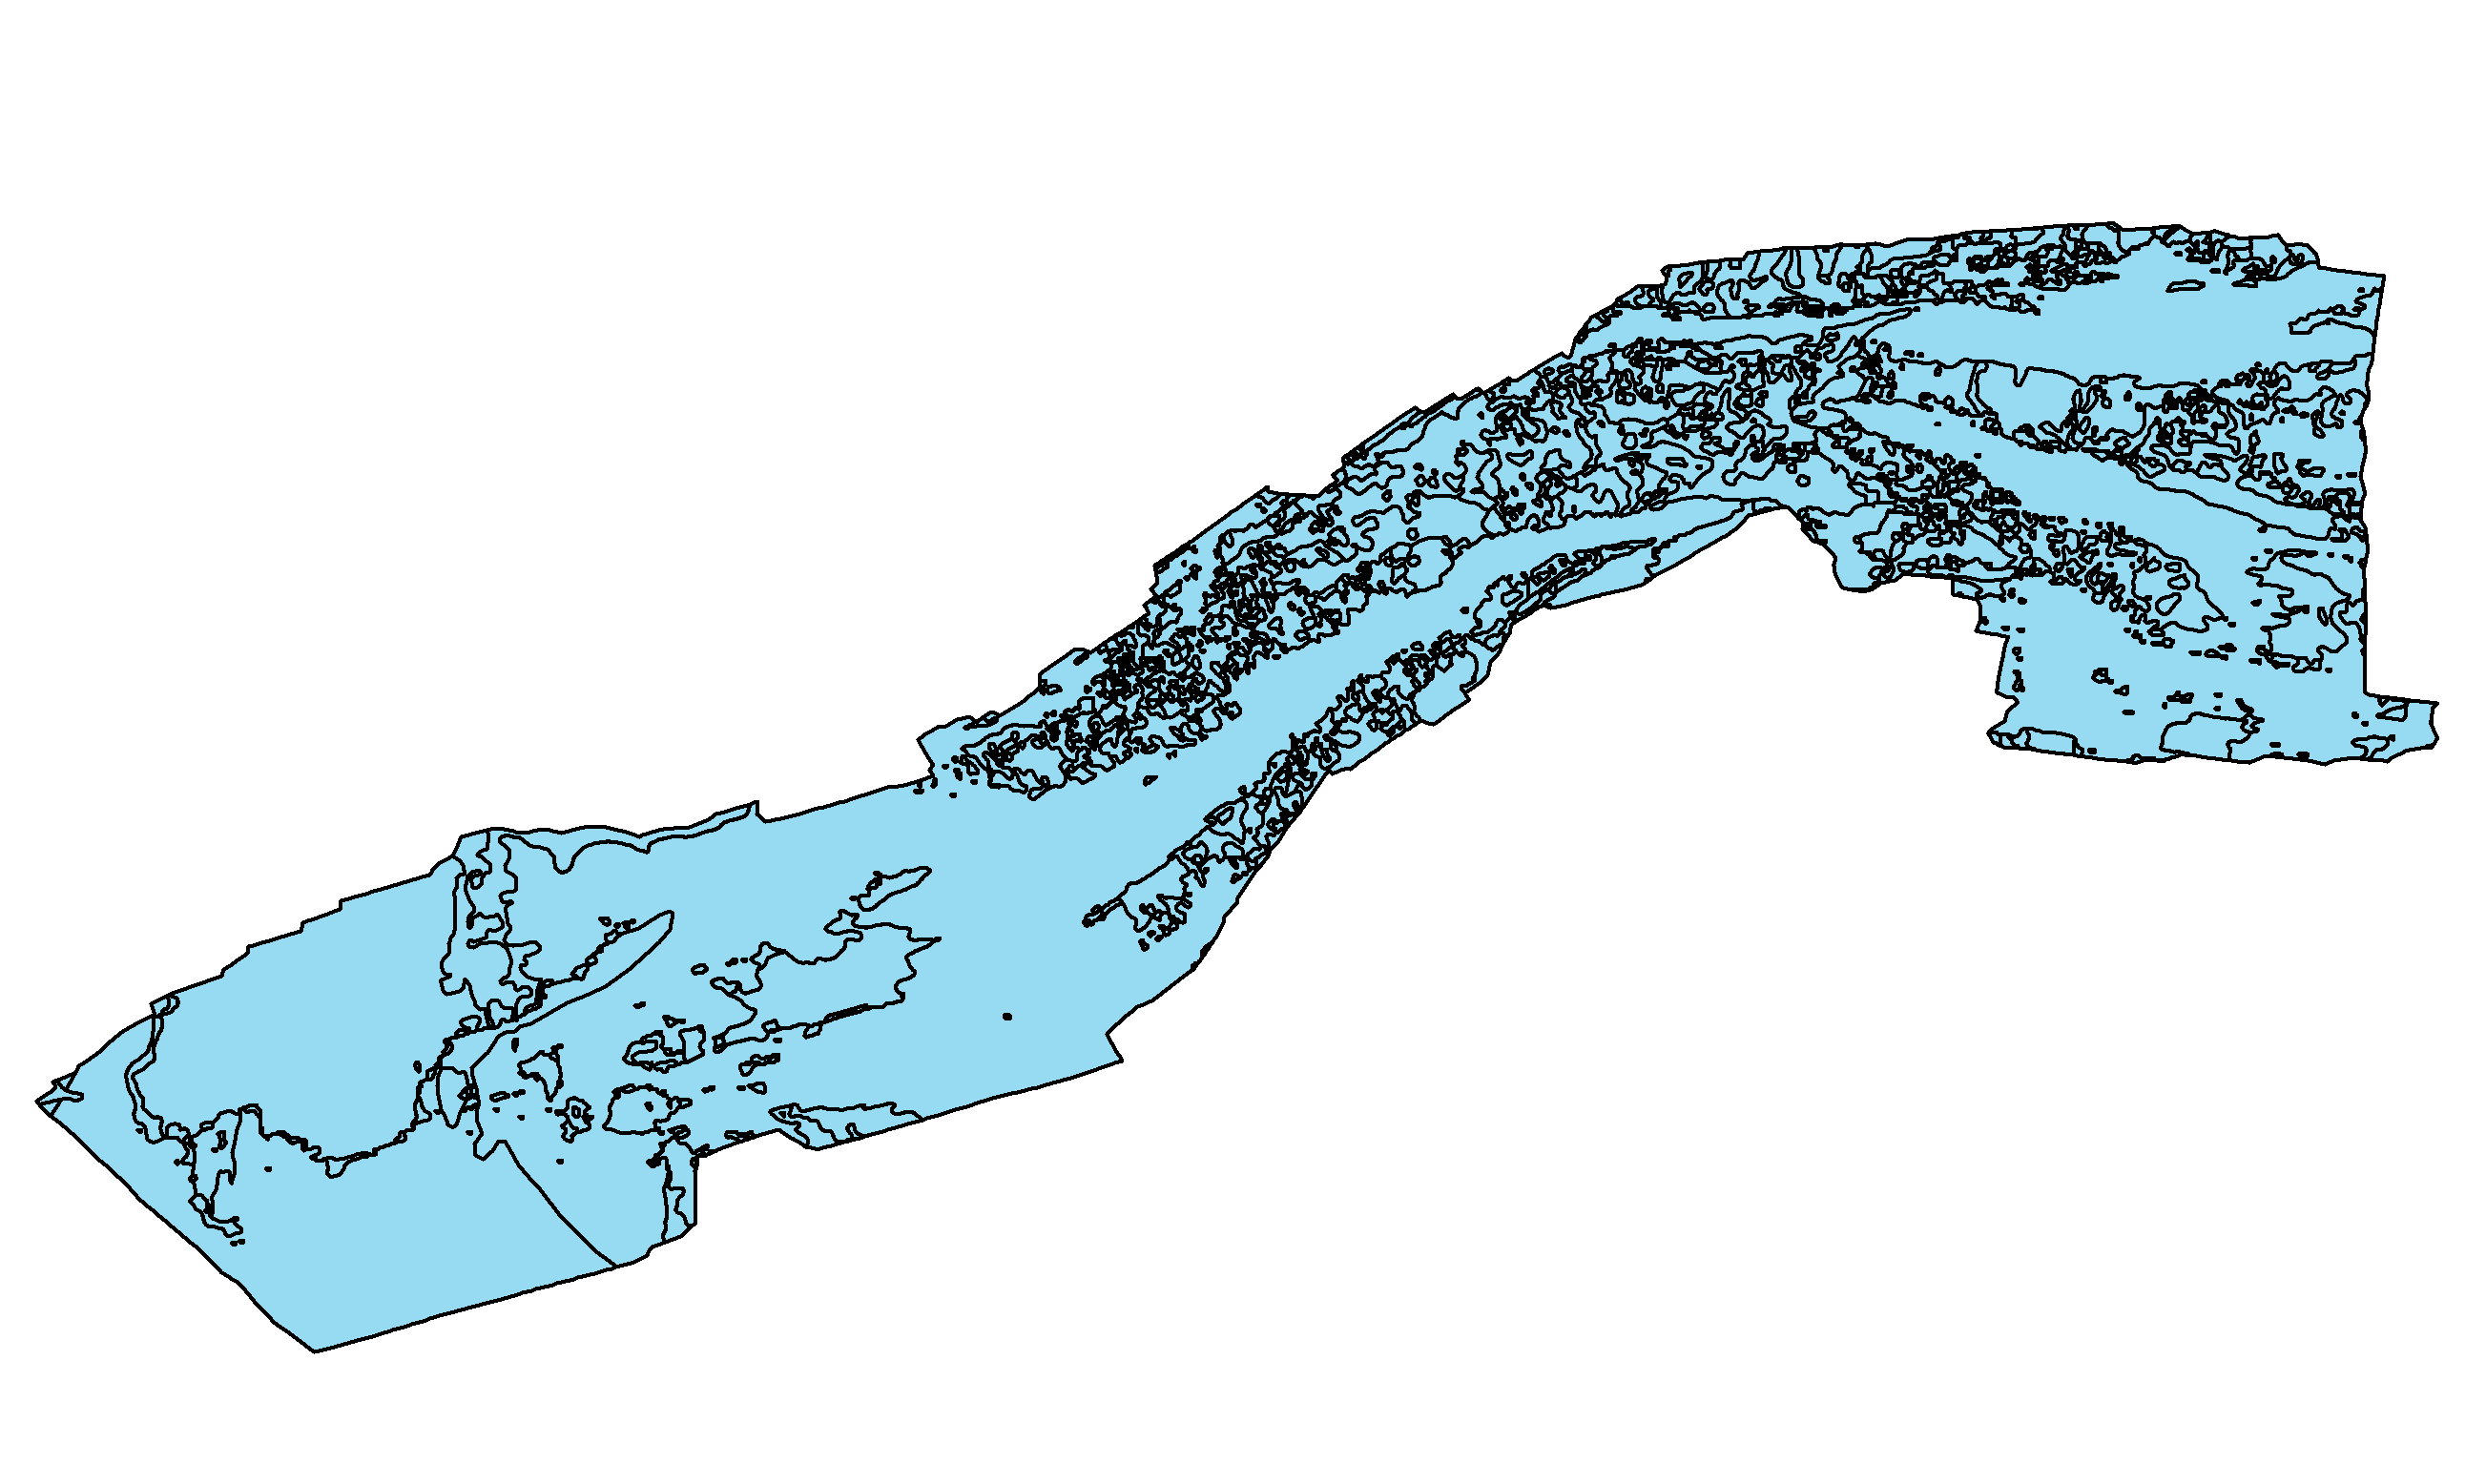
This data set describes sea-floor geology of Vineyard and western Nantucket Sounds. Polygons are used to indicate the areal distribution of sea-floor outcrop for sub-surface stratigraphic units interpreted in high-resolution seismic reflection data. These data are useful for assessing relations between geologic framework, sea-bed morphology, and sediment textural trends.


How was the data set created?

  1. From what previous works were the data drawn?

    Pendleton and others, 2012 (source 1 of 3)
    Pendleton, E.A., Twichell, D.C., Foster, D.S., Worley, C.R, Irwin, B.J., and Danforth, W.W., 2012, High-resolution geophysical data from the sea floor surrounding the Western Elizabeth Islands, Massachusetts: Open-File Report 2011-1184, U.S. Geological Survey, Reston, VA.

    Online Links:

    Type_of_Source_Media: online
    Source_Contribution:
    This report provided source geophysical data (sidescan, bathymetry, and seismic-reflection profiles) for the area of Vineyard Sound surrounding the western Elizabeth Islands. High-resolution chirp seismic-reflection profiles were collected during U.S. Geological Survey field activity 2010-003-FA using an EdgeTech Geo-Star full spectrum sub-bottom (FSSB) system and SB-424 towfish. Thorough descriptions of acquisition and processing parameters for the survey are provided by Pendleton and others (2012) in the methods section and seismic-reflection metadata. Shallow geologic framework and surficial geology were interpreted from post-processed chirp seismic-reflection profiles.

    Andrews and others, 2014 (source 2 of 3)
    Andrews, B.D., Ackerman, S.D., Baldwin, W.E., Foster, D.S., and Schwab, W.C., 2014, High-Resolution Geophysical Data from the Inner Continental Shelf: Vineyard Sound, Massachusetts: Open-File Report 2012-1006, U.S. Geological Survey, Reston, VA.

    Online Links:

    Type_of_Source_Media: online
    Source_Contribution:
    This report provided source geophysical data (sidescan, bathymetry, and seismic-reflection profiles) for most of the Vineyard and western Nantucket Sound Study area. The mapping was conducted onboard the Megan T. Miller (2009, 2010) and the Scarlett Isabella (2011) during U.S. Geological Survey field activities 2009-002-FA , 2010-004-FA, and 2011-004-FA. Chirp seismic-reflection data were collected using an EdgeTech Geo-Star FSSB subbottom profiling system and an SB-0512i towfish. Thorough descriptions of acquisition and processing parameters for each survey are provided by Andrews and others (2014) in the methods section and seismic-reflection metadata. Shallow geologic framework was interpreted from post-processed chirp seismic-reflection profiles

    Pendleton and others, 2014 (source 3 of 3)
    Pendleton, E.A., Andrews, B.D., Danforth, W.W., and Foster, D.S., 2014, High-resolution geophysical data collected aboard the U.S. Geological Survey research vessel Rafael to supplement existing datasets from Buzzards Bay and Vineyard Sound, Massachusetts: Open-File Report 2013-1020, U.S. Geological Survey, Reston, VA.

    Online Links:

    Type_of_Source_Media: online
    Source_Contribution:
    This report provided source geophysical data (sidescan, bathymetry, and seismic-reflection profiles) for several of the shallowest areas of Vineyard and Nantucket Sounds, across Middleground, L'Hommedieu, and Hedge Fence shoals, as well as several supplemental boomer seismic-reflection profiles. These areas were surveyed with the RV Rafael in 2010 and 2011 during U.S. Geological Survey field activities 2010-047-FA, 2010-100-FA, and 2011-013-FA. In 2010, seismic-reflection data were acquired with a boomer source and GeoEel 8-channel streamer. In 2011, high-resolution chirp seismic data were collected using a dual frequency (3.5 and 200 kHz) Knudsen Engineering Limited (KEL) Chirp 3202 system. Thorough descriptions of acquisition and processing parameters for each survey are provided by Pendleton and others (2014) in the methods section and seismic-reflection metadata. Shallow geologic framework and surficial geology were interpreted from post-processed chirp and boomer seismic-reflection profiles.

  2. How were the data generated, processed, and modified?

    Date: 2015 (process 1 of 4)
    Chirp and boomer seismic-reflection data were interpreted using Landmark SeisWorks 2D (R5000) seismic interpretation software. Interpretation consisted of identifying and digitizing erosional unconformities defining the boundaries between Holocene, Pleistocene, and pre-Quaternary seismic units, and digitizing the extent over which each of the defined sub-surface seismic units crops out on the sea floor. The digitized Sea-floor outcrop extents for each seismic unit were sampled at a 10-meter along track interval and exported from SeisWorks as ASCII text. The resultant text file was imported into ArcMap (9.3.1) as point features (easting, northing, seismic unit) using the 'Add XY data' function, then saved as a point shapefile (UTM, Zone 19N, WGS84).

    Person who carried out this activity:

    Wayne Baldwin
    U.S. Geological Survey
    Geologist
    384 Woods Hole Rd.
    Woods Hole, MA 02543
    USA

    508-548-8700 x2226 (voice)
    508-457-2310 (FAX)
    wbaldwin@usgs.gov

    Data sources used in this process:
    • Seisworks horizons representing the sea-floor outcrop extents of interpreted geologic units

    Date: 2014 (process 2 of 4)
    A polygon shapefile of the seismic-reflection survey area was created by digitizing around a polyline shapefile of the profile tracklines (file > new > shapefile in ArcCatalog 9.3.1, then editor >'create new feature' in ArcMap 9.3.1). A new attribute field named 'Geology' was added to the shapefile attribute table. The point shapefile containing the along track extents of seismic unit outcrop was then used to guide division of the larger survey area polygon into smaller polygons representative of individual seismic unit outcrop areas (using editor processes 'cut polygon feature', 'intersect', 'merge', and 'clip' in ArcMap 9.3.1). As each new polygon area was created, the 'Geology' attribute field was populated with the appropriate geologic unit label. Polygon editing was done at scales between 1:8,000 and 1:20,000, depending on the size of the outcrop area.

    Person who carried out this activity:

    Wayne Baldwin
    U.S. Geological Survey
    Geologist
    384 Woods Hole Rd.
    Woods Hole, MA 02543
    USA

    508-548-8700 x2226 (voice)
    508-457-2310 (FAX)
    wbaldwin@usgs.gov

    Data sources used in this process:
    • shapefile of profile tracklines and point shapefile containing the along track extents of seismic unit outcrop

    Date: 2014 (process 3 of 4)
    Polygon shapefile containing the surficial geologic units was imported as a feature class within a file geodatabase feature dataset, and topological rules were established (ArcCatalog 9.3.1). Topological errors, primarily overlaps and gaps, were identified and remedied using the topology toolbar in ArcMap (9.3.1).

    Person who carried out this activity:

    Wayne Baldwin
    U.S. Geological Survey
    Geologist
    384 Woods Hole Rd.
    Woods Hole, MA 02543
    USA

    508-548-8700 x2226 (voice)
    508-457-2310 (FAX)
    wbaldwin@usgs.gov

    Data sources used in this process:
    • Polygon shapefile containing the surficial geologic units

    Date: 2014 (process 4 of 4)
    The surficial geology polygon feature class was exported back to a shapefile and the 'Shape_Area' and 'Shape_Length' fields were deleted from its attribute table (ArcCatalog and ArcMap 9.3.1). XTools Pro (7.1.0) was then used to add and populate a new attribute field containing polygon area in square kilometers based on UTM, zone 19, WGS84. Finally, the shapefile was reprojected from UTM zone 19 N, WGS 84 to GCS WGS84 using ArcToolbox > Data Management Tools > Projections and Transformations > Feature > Project.

    Person who carried out this activity:

    Wayne Baldwin
    U.S. Geological Survey
    Geologist
    384 Woods Hole Rd.
    Woods Hole, MA 02543
    USA

    508-548-8700 x2226 (voice)
    508-457-2310 (FAX)
    wbaldwin@usgs.gov

    Data sources used in this process:
    • Polygon feature class containing the surficial geologic units

  3. What similar or related data should the user be aware of?

    O'Hara, Charles J. , and Oldale, Robert N. , 1980, Maps showing geology and shallow structure of eastern Rhode Island Sound and Vineyard Sound, Massachusetts: U.S. Geological Survey Miscellaneous Field Studies Map MF-1186, U.S. Geological Survey, Reston, VA.

    Online Links:

    Other_Citation_Details: 5 sheets
    O'Hara, Charles J. , and Oldale, Robert N. , 1987, Maps showing geology, shallow structure, and bedforms of Nantucket Sound, Massachusetts: U.S. Geological Survey Miscellaneous Field Studies Map MF-1911, U.S. Geological Survey, Reston, VA.

    Online Links:

    Other_Citation_Details: 4 sheets


How reliable are the data; what problems remain in the data set?

  1. How well have the observations been checked?

  2. How accurate are the geographic locations?

    Navigational accuracy of the seismic-reflection data used for this interpretation was assumed to be ± 10 to 20 meters. Refer to seismic trackline metadata in Pendleton and others (2012; 2014), and Andrews and others (2014) for specific seismic data acquisition parameters and accuracy reports. Additional navigational uncertainty in this interpretation arises from subjective digitizing of the seismic reflectors, sampling of the interpreted horizons at 10-m along track intervals prior to export from the seismic interpretation package.

  3. How accurate are the heights or depths?

  4. Where are the gaps in the data? What is missing?

    All chirp and boomer seismic-reflection data collected within the study area during USGS Woods Hole Coastal and Marine Science Center field activities 2009-002-FA, 2010-003-FA, 2010-004-FA, 2010-047-FA, 2010-100-FA, 2011-004-FA, and 2011-013-FA were used to interpret the subsurface geologic units.

  5. How consistent are the relationships among the observations, including topology?

    Chirp seismic-reflection data collected during USGS Woods Hole Coastal and Marine Science Center field activities 2009-002-FA, 2010-003-FA, 2010-004-FA, 2011-004-FA, and 2011-013-FA and boomer seismic-reflection data during USGS Woods Hole Coastal and Marine Science Center field activities 2010-047-FA and 2010-100-FA were used to interpret the geologic framework of Vineyard and western Nantucket Sounds. Because of the scale (polygon editing was done at scales between 1:8,000 and 1:20,000, depending on the size of the outcrop area) and line spacing of the source seismic profiles, not all changes in seafloor geology are captured. The boundaries of polygons are inferred between seismic lines, and polygon boundaries should be considered an approximation of the location of a change in geology. Further, a constant seismic velocity of 1,500 m/s was assumed for all profiles, through water and all sediment types, which may result in inaccurate depths of stratigraphic units.


How can someone get a copy of the data set?

Are there legal restrictions on access or use of the data?

Access_Constraints: None
Use_Constraints:
Public domain data from the U.S. Government are freely redistributable with proper metadata and source attribution. Please recognize the U.S. Geological Survey (USGS) as the source of this information. Additionally, there are limitations associated with qualitative geologic mapping interpretations. Polygon editing was done at scales between 1:8,000 and 1:20,000, depending on the size of the outcrop area, but the recommended scale for application of these data is 1:25,000.

  1. Who distributes the data set? (Distributor 1 of 1)

    Wayne Baldwin
    U.S. Geological Survey
    Geologist
    384 Woods Hole Rd.
    Woods Hole, MA 02543
    USA

    508-548-8700 x2226 (voice)
    508-457-2310 (FAX)
    wbaldwin@usgs.gov

  2. What's the catalog number I need to order this data set?

    VineyardNantucketSound_surfgeol.zip from USGS Open File report 2016-1119. WinZip version 14.5 file contains qualitatively derived polygons that define the sea-floor geology of Vineyard and western Nantucket Sound, MA and the associated metadata.

  3. What legal disclaimers am I supposed to read?

    Neither the U.S. Government, the Department of the Interior, nor the USGS, nor any of their employees, contractors, or subcontractors, make any warranty, express or implied, nor assume any legal liability or responsibility for the accuracy, completeness, or usefulness of any information, apparatus, product, or process disclosed, nor represent that its use would not infringe on privately owned rights. The act of distribution shall not constitute any such warranty, and no responsibility is assumed by the U.S. Geological Survey in the use of these data or related materials. Any use of trade, product, or firm names is for descriptive purposes only and does not imply endorsement by the U.S. Government

  4. How can I download or order the data?

  5. What hardware or software do I need in order to use the data set?

    These data are available in Environmental Systems Research Institute (Esri) shapefile format. The user must have software capable of importing and processing this data type.


Who wrote the metadata?

Dates:
Last modified: 05-Aug-2015
Last Reviewed: 2016
Metadata author:
Wayne Baldwin
U.S. Geological Survey
Geologist
384 Woods Hole Rd.
Woods Hole, MA 02543
USA

508-548-8700 x2226 (voice)
508-457-2310 (FAX)
wbaldwin@usgs.gov

Metadata standard:
FGDC Content Standards for Digital Geospatial Metadata (FGDC-STD-001-1998)


Generated by mp version 2.9.12 on Mon Jul 25 12:02:48 2016