FISC - St. Petersburg
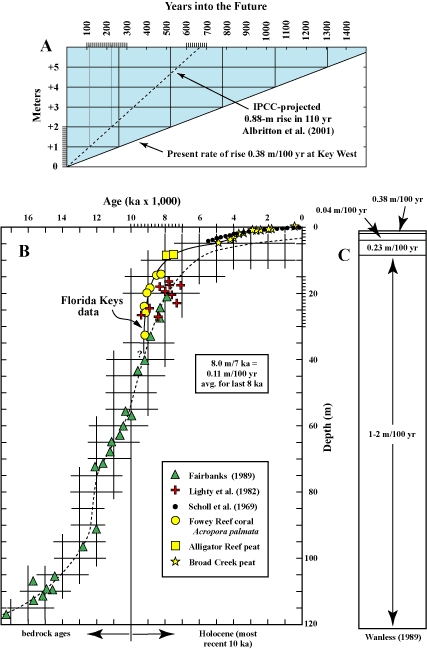
Figure 102. (A) Diagram shows time that it will take for sea level to inundate the Florida Keys at its present measured rate of rise (solid diagonal). Dashed line represents predicted rise in mean global sea level from 1990 to 2100 (Albritton et al., 2001) extrapolated to +1-m mark (~110 years) and +2-m mark (~225 years) and beyond. Most dry land in the keys will disappear with a rise in sea level of 1 to 2 m (figure modified from Lidz and Shinn, 1991). IPCC = Intergovernmental Panel on Climate Change. (B) The sea-level curve for the Florida reef tract is well constrained by local proxy data (in conventional 14C ages) as modified (Lidz and Shinn, 1991) from the curve of Robbin (1984). Data from 8 ka to the present are considered reliable. Question mark indicates lack of reliable local data older than ~8 ka. (C) Rates of sea-level rise. Upper part of figure shows rise as measured since 1932 by tide gauges at Key West. There is some disagreement as to whether rate of rise has accelerated in Key West, as is shown by Wanless (1989), or has remained relatively uniform, as stated by Hanson and Maul (1993).
|
Can't see the printable PDF version? Get the free Adobe Acrobat® Reader. |
