Professional Paper 1386–A
Select image for high resolution and Save to download 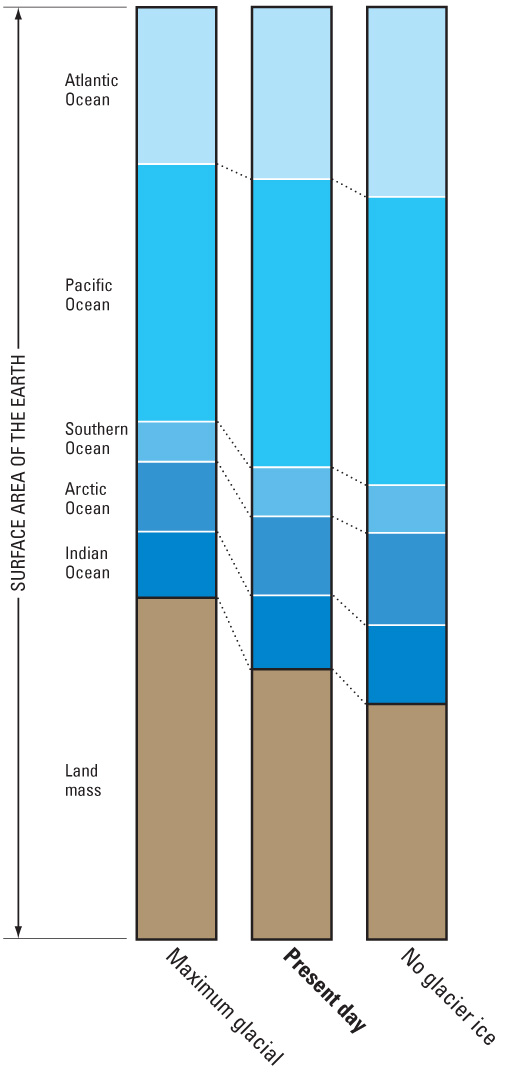 Figure 9. Three bar graphs showing percentages of land mass versus 5 major oceans at maximum glacial (land, about 37 percent), present day (land, 29.1 percent), and no glacier ice on land (land, about 25 percent). Between maximum glacier ice on land and no glacier ice on Earth, the land area fluctuates between 37 percent and, 25 percent, respectively. |

![]() U.S. Department of the Interior |
U.S. Geological Survey
U.S. Department of the Interior |
U.S. Geological Survey
URL: http://pubsdata.usgs.gov/pubs/pp/p1386a/gallery1-fig09.html
Page Contact Information: GS Pubs Web Contact
Page Last Modified: Thursday, 01-Dec-2016 16:24:46 EST
