Professional Paper 1386–A
Select image for high resolution and Save to download 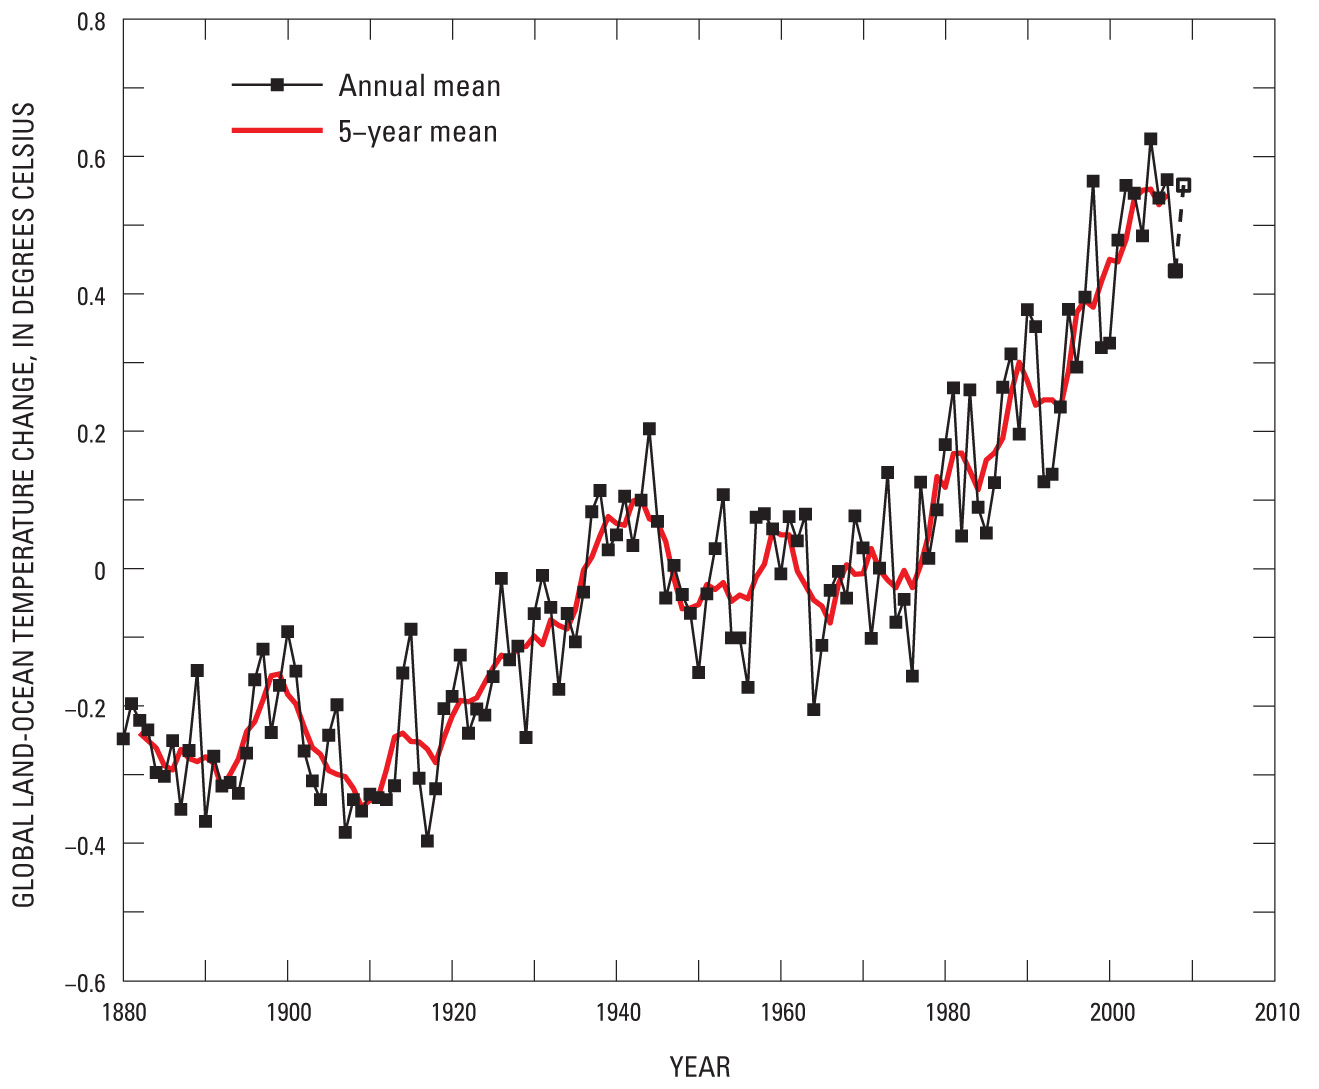 Figure 15. Graph of global annual surface temperatures from 1880 to 2007, relative to the annual mean temperature and 5-year mean temperature. Graph is based on data compiled by National Aeronautics and Space Administration Goddard Institute for Space Studies at http://data.giss.nasa.gov/gistems/graphs/ (see also McCarthy, 2008, p. 60). |

![]() U.S. Department of the Interior |
U.S. Geological Survey
U.S. Department of the Interior |
U.S. Geological Survey
URL: http://pubsdata.usgs.gov/pubs/pp/p1386a/gallery1-fig15.html
Page Contact Information: GS Pubs Web Contact
Page Last Modified: Thursday, 01-Dec-2016 16:24:48 EST
