Professional Paper 1386–A
Select image for high resolution and Save to download 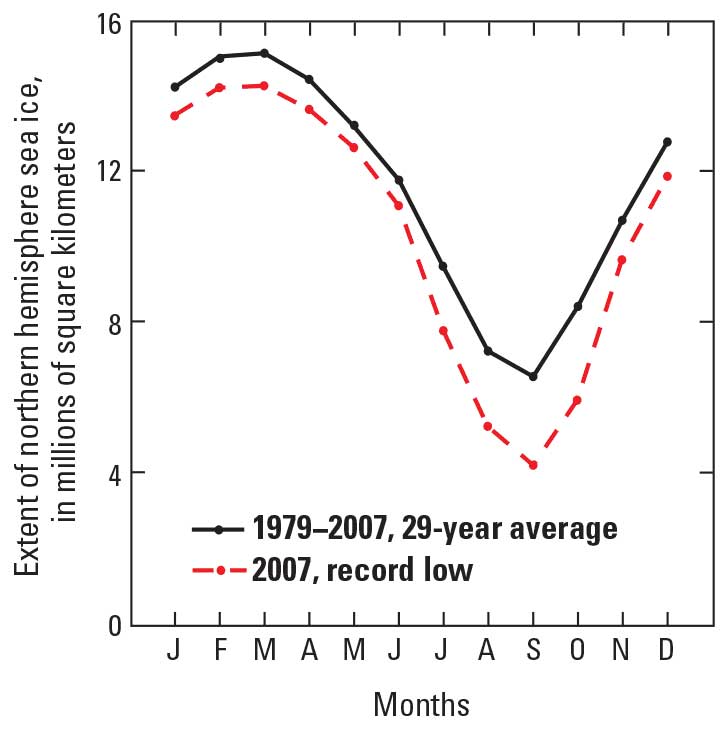 Figure 5–2. Graph showing a 29-year average (1979–2007) (black line), seasonal variation of sea ice extent in the Arctic Ocean and environs. The red dashed line shows seasonal variation for 2007, a record low. |

![]() U.S. Department of the Interior |
U.S. Geological Survey
U.S. Department of the Interior |
U.S. Geological Survey
URL: http://pubsdata.usgs.gov/pubs/pp/p1386a/notes-fig5-2.html
Page Contact Information: GS Pubs Web Contact
Page Last Modified: Thursday, 01-Dec-2016 16:26:28 EST
