Professional Paper 1386–A
Select image for high resolution and Save to download 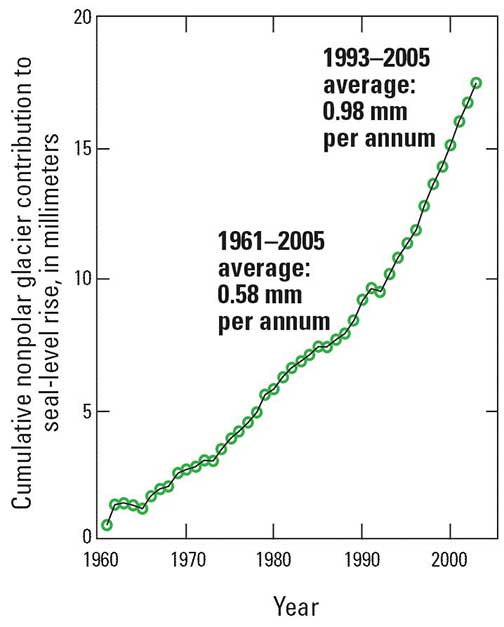 Figure 7–1. Rise in global sea level from meltwater from mountain glaciers and subpolar ice caps, 1961 to 2005. Although the average increase in global sea level was 0.58 mm per annum from 1961 to 2005, the rate of sea-level rise increased to 0.98 mm per annum from 1993 to 2005. Graph prepared by Mark Dyurgerov, University of Colorado, Institute of Arctic and Alpine Research, Boulder, Colorado. |

![]() U.S. Department of the Interior |
U.S. Geological Survey
U.S. Department of the Interior |
U.S. Geological Survey
URL: http://pubsdata.usgs.gov/pubs/pp/p1386a/notes-fig7-1.html
Page Contact Information: GS Pubs Web Contact
Page Last Modified: Thursday, 01-Dec-2016 16:26:32 EST
