Through the development of analytical techniques using vertical aerial photographs and more recently using satellite images, a new era in glacier studies began. The use of these two technologies means that no glacierized regions in Bolivia should remain unknown to us today. The analysis of satellite images provided, for the first time, an assessment of glacier distribution in the different cordilleras. Although the quantitative results are not as accurate as those derived from precise photogrammetric measurements of aerial photographs (table 1), satellite imagery provides the capability for more accurately monitoring Bolivia's glaciers. The frequently acquired satellite data will give more up-to-date information and permit observation of the substantial recession of these tropical glaciers.
The first aerial mapping surveys using photogrammetric quality metric cameras were begun by the U.S. Army Air Force in 1942 and employed trimetrogon aerial photography. The aerial surveys were continued until 1948. After World War II, aerial navigation and photographic technologies improved rapidly. Beginning in 1952, at the Government of Bolivia's request, a new series of aerial surveys acquired vertical aerial photographs for use in various photogrammetric plotting instruments (for example, Multiplex and Kelsh) to compile modern maps of Bolivia. It was 1975, however, before all glacierized regions in Bolivia were covered by vertical aerial photographs (fig. 16). The quality of the photographs ranges from good to satisfactory, but a number of disadvantages is inherent in the available data. A major disadvantage is the fact that several different organizations carried out a variety of aerial surveys, using different cameras, lenses, and survey altitudes during different seasons over an extended period of years. Therefore, synoptic comparisons of glaciers are not possible. Because some areas covered by the different surveys overlap, it is sometimes possible to quantify the disappearance of glaciers during the intervals of aerial photographic coverage.
The available aerial photographic scales for Bolivia range from 1:30,000 to 1:80,000. On the basis of the aerial photographs, official maps of Bolivia are being compiled by IGM. During the past several years, most of the surveys have been carried out by the Fuerza Aérea Boliviana (Bolivian Air Force). The new maps compiled under the direction of Finsterwalder (1987, 1990) by using modern cartographic techniques are good examples of maps that give more precise information about the location and size of glaciers.
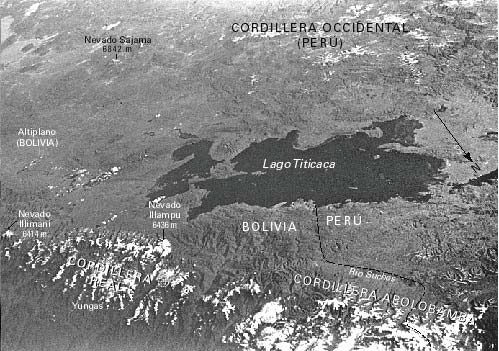
The first significant photograph of Bolivian glaciers from space comes from the Gemini 9 manned space flight in early June 1966. It is an oblique photograph that shows Lago Titicaca in the center; in the foreground are the glaciers of the Cordillera Apolobamba and the entire Cordillera Real as far as Illimani, the majestic panoramic massifs around the capital city La Paz (fig. 17).
Figure 17.--Annotated oblique satellite photograph taken from the Gemini 9 spacecraft looking west at the glacierized Cordillera Oriental. The photograph, which originally was in color, shows Lago Titicaca in the center, Cordillera Apolobamba in the right foreground, and the Cordillera Real to the left. In the immediate foreground, above the escarpment to the lowland, are some clouds. Photograph taken June 1966 by using a Zeiss-Biogon 1:4.5/38 mm Hasselblad camera. Approximate scale, 1:1,800,000.
Earlier polar-orbiting meteorological satellites, and even the more advanced ones operating at present, have virtually no value for analysis of tropical glaciers because the spatial resolution is far too coarse. Picture elements (pixels) are generally 1 km, so the imagery vaguely suggests the mountain topography and the regional snow cover when no cloud cover interferes. Their only advantage lies in the frequent orbital passage that permits monitoring of general variations in the temporal and seasonal snow cover and elevation of the snowline in the glacierized regions of the tropics. However, with the first of the series of Earth Resources Technology Satellites (ERTS-1, later renamed Landsat 1) launched on 22 July 1972, it became possible to analyze images that had a pixel resolution of 79 m and were suitable for glacier studies on a scale suited to tropical glaciers. Because of the 18-day repeat cycle of the Landsat 1, 2, and 3 satellites (16-day cycle for Landsats 4 and 5), a large number of satellite images have been acquired, although most of the images either are not suited for glaciological studies or have only limited value because of persistent cloudiness. The images found to be useful are listed in table 2, and their locations are shown in figure 18. Specialized studies using advanced techniques for analyzing satellite images of glaciers have not been done on Bolivian glaciers yet, but general observations of glaciological applications will be discussed in the following section, which also includes discussion of the interpretation of glaciological features on Landsat images acquired in different seasons using different spectral bands. Remote sensing systems that have higher resolution sensors, such as Landsat 4 and 5 Thematic Mapper (TM) (30 m), Satellite Pour l'Observation de la Terre (SPOT) (10-20 m), and Modular Optoelectronic Multispectral Scanner (MOMS) (up to 5 m), have limitations, even though the satellites allow more detailed observation of the small tropical glaciers. Landsat data and SPOT data are quite expensive. The MOMS system has the disadvantage that it is still not an operational system; it has only been tested on Space Transportation System (Shuttle) flights. However, SPOT and MOMS have the advantage of stereoscopic interpretation capability.
Figure 18.--Optimum Landsat 1, 2, and 3 images of the glaciers of Bolivia.
Table 2.--Optimum Landsat 1, 2, and 3 images of the glaciers of Bolivia
[See fig.18 for explanation of symbols used in "code" column]
|
Path-Row |
Nominal scene center |
Landsat identification number |
Date |
Solar elevation angle |
Solar azimuth angle |
Code |
Cloud cover |
Remarks |
|---|---|---|---|---|---|---|---|---|
|
249-74 |
20°11'S. |
2148-13415 |
19 Jun 75 |
30 |
44 |
|
0 |
No Holocene, only Pleistocene glacier areas; image used for figure 9 |
|
249-75 |
21°38'S. |
2418-13382 |
15 Mar 76 |
42 |
71 |
|
0 |
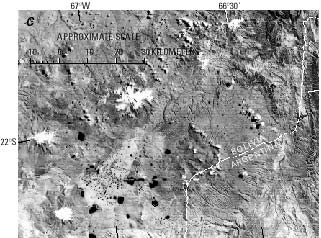
Bolivia-Argentina; no Holocene, only Pleistocene glacier areas; moderate snow cover; image used for figure 20C |
|
249-75 |
21°38'S. |
2148-13421 |
19 Jun 75 |
29 |
44 |
|
0 |
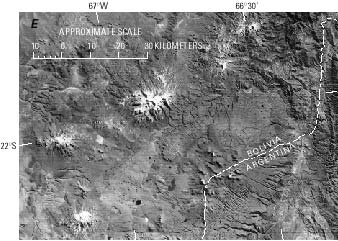
Bolivia-Argentina; no Holocene, only Pleistocene glacier areas; moderate snow cover; image used for figure 20E, F |
|
249-75 |
21°38'S. |
2310-13401 |
28 Nov 75 |
54 |
96 |
|
0 |
Bolivia-Argentina; no Holocene, only Pleistocene glacier areas; minimal snow cover; image used for figure 20A, B |
|
249-76 |
23°04'S. |
2256-13411 |
05 Oct 75 |
48 |
69 |
|
0 |
Argentina-Bolivia-Chile; no Holocene, only Pleistocene glacier areas; minimal snow cover |
|
250-72 |
17°19'S. |
2149-13464 |
20 Jun 75 |
33 |
45 |
|
0 |
Cordilleras Tres Cruces - Nevado Santa Vera Cruz; moderate snow cover |
|
250-74 |
20°11'S. |
1243-13595 |
23 Mar 73 |
46 |
65 |
|
0 |
Bolivia-Chile, Cordillera Occidental |
|
250-75 |
21°38'S. |
1243-14001 |
23 Mar 73 |
45 |
64 |
|
0 |
Bolivia-Chile, Cordillera Occidental; minimal snow cover; image used for figure 19 |
|
250-76 |
23°04'S. |
2401-13450 |
27 Feb 76 |
44 |
78 |
|
0 |
Chile-Bolivia; moderate snow cover |
|
250-76 |
23°04'S. |
1243-14004 |
23 Mar 73 |
44 |
63 |
|
0 |
Excellent with minimal snow cover on mountain peaks; no Holocene glaciers |
|
250-76 |
23°04'S. |
2257-13470 |
06 Oct 75 |
48 |
70 |
|
0 |
Excellent but with considerable snow cover in the cordillera; no Holocene glaciers |
|
251-71 |
15°52'S. |
2168-13520 |
09 Jul 75 |
34 |
47 |
|
0 |
Cordillera Real; minimal snow cover, image used for figure 8 |
|
251-72 |
17°19'S. |
2276-13505 |
25 Oct 75 |
54 |
86 |
|
0 |
Southern Cordilleras Real and Tres Cruces, and Nevado Santa Vera Cruz; moderate snow cover; image used for figures 7 and 8 |
|
251-72 |
17°19'S. |
1100-14041 |
31 Oct 72 |
58 |
89 |
|
0 |
Southern Cordilleras Real and Tres Cruces and Nevado Santa Vera Cruz; minimal snow cover |
|
251-73 |
18°45'S. |
1100-14043 |
31 Oct 72 |
57 |
87 |
|
0 |
Bolivia-Chile, Cordillera Occidental; minimal snow cover; image used for figure 2A, B |
|
251-74 |
20°11'S. |
1244-14053 |
24 Mar 73 |
46 |
65 |
|
0 |
Chile-Bolivia, Cordillera Occidental |
|
1-70 |
14°26'S. |
2223-13561 |
02 Sep 75 |
44 |
62 |
|
0 |
Bolivia-Perú, Cordillera Apolobamba; substantial snow cover; image used for figure 5A |
|
1-70 |
14°26'S. |
2187-13565 |
28 Jul 75 |
37 |
51 |
|
0 |
Bolivia-Perú, Cordillera Apolobamba; minimal snow cover; image used for figure 8 |
|
1-70 |
14°26'S. |
277108-133941 |
18 Apr 77 |
39 |
62 |
|
10 |
Bolivia-Perú, Cordillera Apolobamba; marginal cloud cover; excellent glacier without snow cover; image source: Brazil |
|
1-71 |
15°52'S. |
277108-134006 |
18 Apr 77 |
38 |
61 |
|
10 |
Bolivia-Perú, Northern Cordillera Real, Lake Titicaca; excellent glacier; image source: Brazil |
|
1-72 |
17°19'S. |
1065-14091 |
26 Sep 72 |
52 |
69 |
|
0 |
Perú-Bolivia-Chile, Cordillera Occidental; minimal snow cover |
|
1-72 |
17°19'S. |
277108-134031 |
18 Apr 77 |
38 |
60 |
|
0 |
Perú-Bolivia-Chile, Cordillera Occidental; image source: Brazil |
|
1-73 |
18°45'S. |
2061-13583 |
24 Mar 75 |
44 |
68 |
|
0 |
Chile-Bolivia-Perú, Cordillera Occidental; glaciers masked by snow cover |
The following discussion is limited to the manual-optical analysis of 1:1,000,000-scale satellite images from the Landsat series. Because of the scanning element (pixel) size of 79x79 m in Landsat multispectral scanner (MSS) images, certain limits are set for interpretation. Yet these limits are not only determined by the pixel resolution but also by the discrimination of various materials within the spectral ranges of the images, by the seasonal and climatic conditions during imaging, and finally, by the characteristics of tropical glaciers. In this section, the occurrence of the Bolivian glaciers will be examined, including a discussion of the limitations just mentioned. The facts are essentially the same for the increased resolution of Landsat TM, SPOT, and MOMS images.
Initial difficulties emerge in the general determination of glacier distribution. Distinguishing between ice and snow and salt areas, and also cloud cover, is difficult. It is made easier with the proper selection of the available multispectral images, especially by using MSS spectral band 7.
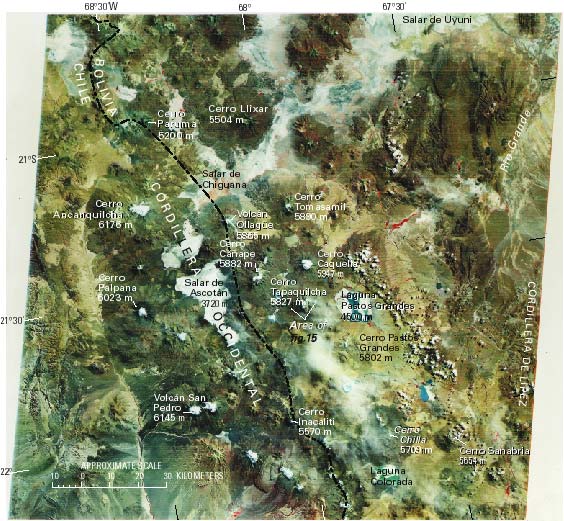
The glaciers of the Cordillera Occidental have a spectral reflectance that is similar to salt efflorescences and salars (figs. 2, 3, and 19). As a rule, the latter are located in intermontane basins, whereas snow and glaciers cover the volcanic peaks. Stereoscopic observation capability, therefore, makes differentiation possible with absolute certainty. Since 1986, SPOT has provided this capability, as have the 1983-84 and 1993 MOMS test series images. Landsat imagery does not have true stereoscopic quality. However, the azimuth and orientation of the Sun at the time of imaging give the terrain the appearance of substantial relief so that, except for some borderline cases, it is possible to differentiate between ice and snow and salt areas with fair certainty.
Figure 19.--Annotated Landsat 1 MSS false-color composite image of the Cordillera Occidental in southern Bolivia and northeastern Chile. The image shows a large number of snow-capped volcanic peaks. However, none of the high mountains has a glacier, and the white snow patches were caused by the abundant precipitation during the just completed rainy season. The snow patches as a rule disappear again at the end of the dry season, mostly through sublimation. The concentration of red color in the lowlands and middle slope regions of the volcanoes, which indicates a strong spectral response in the near-infrared part of the electromagnetic spectrum, also documents the abundant precipitation in the year that the image was acquired. The red coloration in this case represents good plant growth and intensive formation of chlorophyll. The abundant precipitation is further attested to by the extended surface water in the region of the salars. The location of figure 15 is shown. Landsat image (1243-14001; 23 March 1973; Path 250, Row 75) is from the EROS Data Center, Sioux Falls, S. Dak.
On the other hand, the difficulty of spectrally separating and therefore delineating areas of snow, firn, glacier ice, and glacier ice covered with snow and firn is much more important. For example, snow cover gives the false impression that many of the volcanic cones of the Cordillera Occidental and the Cordillera de Lípez are covered by glaciers (figs. 2, 19, and 20). However, only a few volcanoes (table 1) are actually capped by ice; all the others have only a temporary firn cap, which may persist, in part, for several years, with an especially strong definition after the rainy season in March and April (see fig. 20).
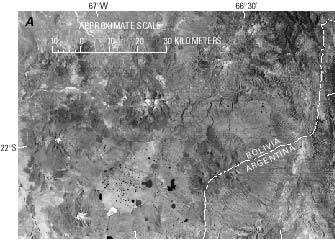
Figure 20.--Parts of six 1:1,000,000-scale Landsat 2 MSS images showing the seasonal cycle of snow and firn fields in the Cordillera de Lípez.
|

|
A, Landsat image 2310-13401, band 5; 28 November 1975; Path 249, Row 75. |
B, Landsat image 2310-13401, band 7; 28 November 1975; Path 249, Row 75. |
|

|
C, Landsat image 2418-13382, band 7; 15 March 1976; Path 249, Row 75. |
D, Landsat image 2058-13421, band 7; 21 March 1975; Path 249, Row 75.
|
|

|
E, Landsat image 2148-13421, band 5; 19 June 1975; Path 249, Row 75.
|
F, Landsat image 2148-13421, band 7; 19 June 1975; Path 249, Row 75. |
The satellite images show a section of the Cordillera de Lípez in the extreme south of Bolivia at the boundary with Argentina. The area encompasses the highest peaks of southern Bolivia, which, according to official survey data, include several peaks more than 5,000 m high and one peak, in the Uturunco massif, that exceeds 6,000 m in elevation. In spite of these high elevations, no recent glacierization exists, only some firn patches, which can be seen in A and B acquired 28 November toward the end of the dry season. Beginning in November, snowfields normally increase in size and reach their greatest extent toward the end of the rainy season in March and April, as shown in C and D. At this time, the snow cover may completely cover the high peaks and upper basins for several days. Below 5,000 m, the temperatures are high enough so that the snow cover melts quickly. At the greater elevation of the higher peaks, the ablation process proceeds very slowly because of decreasing temperatures during the dry season, as can be seen in an image acquired in June (E and F).
The snow patches show their smallest extent at the beginning of the rainy season in early summer. This is the time of formation of the most pronounced penitent forms. Residual firn patches often can be found at the highest elevations or in sheltered areas. The snow completely disappears in all locations only during irregular cycles of about 3-10 years' duration. The great variability of precipitation in the individual years is naturally reflected by a variability of snow thickness and snow cover extent, as documented by the comparison of the two March images of 1975 and 1976 (C and D). The results of the annual radiation cycle at this location a little north of the Tropic of Capricorn (lat 23.5°S.) can also be distinguished on the images. A comparison of the November images (A and B) near the annual zenith position of the Sun with the June images (E and F), taken at the astronomically lowest angle of solar radiation, shows that the greater effect of shadowing of the June image is quite pronounced. This, naturally, favors snow preservation in southern exposures. The varying response of the surface materials in spectral bands 5 and 7 is noticeable in several areas, including the location of the numerous lakes. Also, particularly in the November image, the white snow-capped peak appears larger in band 5 than in band 7; however, without knowledge of the local conditions (ground truth), one cannot distinguish whether one is looking at wet snow, which responds differently in bands 5 and 7, at old "dirty" snow, or possibly at sulfur efflorescence of craters in volcanically active regions.
In the case of extratropical glaciers, definite accumulation and ablation phases exist, and in the fall, the highest snow and firn lines can be noted. In the tropics, these phases cannot be so clearly defined (fig. 20). Thus, a specific time of year cannot be selected for the optimum analysis of glacier areas. Therefore, analysis of satellite images of Bolivia is always accompanied by the uncertainty of having included in the peripheral areas some large firn and snow-covered areas--as has obviously happened with the "Mapa de cobertura y uso actual de la tierra Bolivia" (Brockmann, 1978).
A further difficulty in analyzing satellite images results from the size of the glaciers. The total extent of the glaciers, about 600 km2, is substantial. However, the glacierized area includes many small glaciers, strongly segmented recharge areas, fragmented glaciers, and steep cliff glaciers and glacier tongues. As a rule, these small glacier areas are generally less than 1 km2 in size. Because of the limitation of the resolution of Landsat imagery, these areas are hard to delineate.
The abundance of small, steep glaciers is also difficult to discern owing to the strong shadows on the slopes oriented toward the southwest (figs. 2 and 8). The shadows are caused by the low, early morning position of the Sun at the time of imaging because of the Equatorial crossing time of 0930 h. On the northern and eastern sides of the slopes, the casting of shadows has an advantage when differentiating between snow or glaciers and clouds. The clouds can be more easily distinguished under certain conditions from similarly reflective materials because of the presence of a cloud shadow. Of course, this ability to distinguish clouds and ice is more difficult if the cloud level itself is located at the height of the glacier and snow fields.
The shadows resulting from the low Sun angle also cause a systematic faulty evaluation of the actual glacier area, especially during the southern winter. The shadows at these latitudes, which are especially dark because of the small diffuse amount of radiation at the tropical heights, cause primarily the steep west to southwest mountain slopes to appear very dark. As a result, their glacierization is partially obscured, whereas the glaciers on the east side, which are lit up in the sunlight, are especially well illuminated. On the other hand, the early time of imaging gives the impression that the west side of the Cordillera Oriental is the preferred snowfall region because the snow that fell in the afternoon and night hours on this side of the cordillera has not yet thawed. This is because of the daily climate cycle that includes cloud cover that protects the snowfields on the western slopes from the Sun's radiation in the afternoon (figs. 5 and 8).
Small-scale glacier surface phenomena are seldom visible on Landsat imagery. These include glacier-flow structures and ablation forms of all kinds, such as penitents, old snow areas, and bare ice surfaces, as well as changes in proglacial lake levels. The same lack of visibility is true for the small, short-term advance and recession of glaciers, which result in small surges that are climatically conditioned response mechanisms. However, historic and Pleistocene glacier fluctuations can be interpreted by clearly identifiable moraine stands on the satellite images.
Landsat 1, 2, and 3 MSS images, and more recently Landsat 4 and 5 TM, SPOT, and finally MOMS images, have proved to be useful for glaciological studies in Bolivia. However, the development in the direction of higher resolution satellite imaging systems will continue to provide significant improvements for the observation and surveillance of these semitropical glaciers in the future. The availability of a wide variety of remotely sensed data will make it possible to select particular sensors or wavelengths of the electromagnetic spectrum depending on the specific glaciological application.
| Home | Next |
U.S. Geological Survey, U.S.Department of the Interior