By Louis Lliboutry3
From a glaciological perspective, the Dry Andes can be divided into the Desert Andes north of latitude 31° South and the Central Andes between latitude 31° and 35° South. Because of lower precipitation and elevations, only permanent snow patches and glacierets are present in the Desert Andes. Large glaciers are situated in the Central Andes because of higher mountains and greater amounts of precipitation. In the Desert Andes, the glaciation level is variable and depends on the amount and source direction of the precipitation. At latitude 27° South, it lowers eastward from 6,200 meters to 5,500 meters or less. At latitude 29° South, it rises eastward from below 5,600 meters to about 6,000 meters. Glaciers of the Central Andes cover about 2,200 square kilometers and can be as much as 14 kilometers in length. Their lower ends are partly or completely covered with morainic debris and are indistinguishable from rock glaciers. Some surging glaciers are present. The Río del Plomo has been dammed at least three times historically by a surge of Glaciar Grande del Nevado. An ephemeral lake was created that eventually drained rapidly and caused a destructive flood downstream of the failed ice dam. During the "Ice Age," a significant expansion of the glaciers in the Central Andes took place. The lowering of the Equilibrium Line Altitude (ELA) should have been about 1,000 meters from today's ELA. The lowering of the mean annual temperature should have been small. The main factor was an increase of the annual precipitation, caused by a 200- to 250-kilometer shift northward of the wetter climate to the south.
The very high, semiarid plateau, known in southern Perú and western Bolivia as the Altiplano, extends southward into Chile and Argentina to lat 28°S. The plateau has an elevation of about 4,000 m above sea level and becomes narrower as it extends to the south. In Chile and Argentina, it is called la Puna (puna also means mountain sickness). At its west border, near the Chilean desert, are a series of Quaternary volcanoes, often reaching elevations of more than 6,000 m, an extension of the Cordillera Occidental in Bolivia. Mountain ranges, running in a north-south direction, exist on the east side of the Puna. The Cordillera de los Andes (the Andes Mountains) is a set of more or less parallel mountain ranges, not a single one. In Spain, a range is called sierra; in South America, it is called cordón or cordillera.
South of lat 28°S., isolated volcanoes do not exist. The main range is both the drainage divide between the rivers that flow into the Pacific and Atlantic Oceans and the international border between Chile and Argentina. The Tratado de Límites (Boundary Treaty) officially delimited the border between both countries as "the water divide," which, they thought, was a line connecting the highest mountain peaks. The existence of mountain ranges between drainage basins was, at the time, a very popular theory among military geographers to the extent that, in France, an imaginary mountain range was drawn between the Seine and the Loire (rivers), a region that is, in fact, completely flat. The nonsensical theory of such "natural frontiers" led to many border controversies in Patagonia up to recent times, but at the same time, it has been the motivation behind many useful expeditions to explore the region.
Glaciologists and geographers should not trust any elevation that is indicated on maps of the Andes Mountains. The sources of their elevation data are never indicated, and these sources may differ from one another by several hundred meters. The critical work of a historian is often necessary to judge accuracy.
Considerable ground geodesy was done at the beginning of the 20th century by an Argentine-Chilean Comisión de Límites, which was charged to delimit the international border. The first edition in 1915 of the Carta Nacional de Chile (CNC), a set of maps at a scale of 1:500,000, used these data. Its last edition, with little modification, was published in 1945. Up to recent times, it was the best source for geographic place-names and for elevations north of lat 41°30'S. on the Chilean side and near the border. Near Santiago, Chile, the CNC was improved (more details and place-names, without modifying the elevations) in 1929 by W. Klatt and F. Fickenscher (KF). Their map at a scale of 1:250,000 was used by Chilean andinistas (mountaineers) up to 1956. On the Argentine side, very accurate maps at a scale of 1:25,000 of the Aconcagua group (lat 32°30'-32°50'S.) and of the glaciers in the Río del Plomo drainage basin (lat 32°55'-33°20'S.) were made by terrestrial photogrammetry (Helbling, 1919). Elsewhere, cartography of the Argentine Andes remained very poor up to recent times.
From April 1944 to April 1945, at the request of the Chilean Government, a Trimetrogon aerial survey of all of Chile was done by the U.S. Army Air Force and was compiled in Panama by the Army Map Service. Very few place-names were indicated, and glaciers of the Central Andes were not represented. (This region had been surveyed in winter, and the plotter's cartographic technicians did not recognize or discriminate glaciers in snow-covered areas.) The Instituto Geográfico Militar de Chile (IGMC) sold this preliminary chart (Carta Prelimínar, CP), at a scale of 1:250,000, in the 1950's without making changes other than metric conversions. At the same time, I drew a more detailed map at a scale of 1:150,000, extending from lat 32°30' to 34°30'S., long 69°40' to 70°30'W. (Lliboutry, 1956). For the first time, glaciers of this area were represented. The contour lines came from the CP (with some corrections near the border); the elevations came from CNC, KF, and Argentine maps.
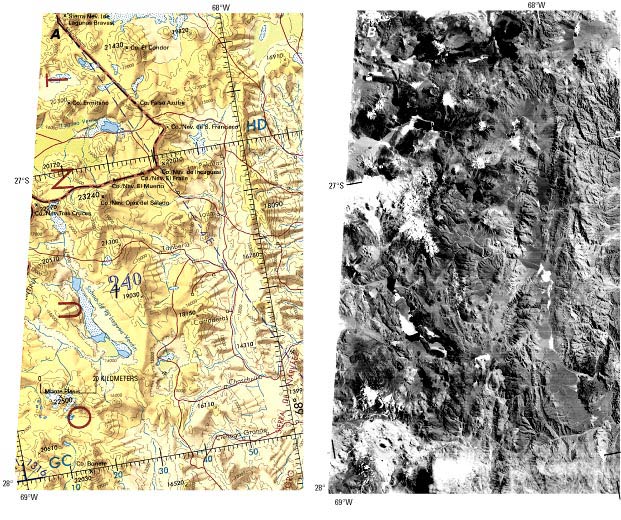
Vertical aerial photographs that are suitable for accurate cartography were taken in 1955 and 1956 in Chile and in 1963, 1974, and 1980-81 in Argentina. They have been used, together with modern geodetic-control networks, for compilation of maps at scales of 1:50,000 in Chile (denoted IGMC) and at 1:100,000 in Argentina. Today all of these photographs and maps are on sale without restrictions in both countries. Nevertheless, many geographers still use the U.S. Operational Navigation Charts (ONC) at a scale of 1:1,000,000 (the same scale as the standard Landsat images), which were printed before the modern accurate maps became available (fig. 5). For Chile, the ONC is a reduction of the CP. For Argentina, the ONC reproduces the navigation chart Carta Aeronáutica Mundial (OAIC) made by the Instituto Geográfico Militar de Argentina (IGMA). In both cases, elevations were drawn from all the maps available at that time. Where the elevation of a given summit was not the same in the different maps, the highest elevation was kept, a logical choice for an aeronautical navigation chart. Many elevations, especially in the Argentine Andes, came from climbers who had reached a summit and merely read their pocket altimeters. They were calibrated in the early morning before the ascent, and the summit was reached in the afternoon, when atmospheric pressures are much lower. Therefore, their reported elevations are too high. For instance, Volcán San José (lat 33°45'S.) (5,830 m CNC, 5,856 m IGMC) is credited with 6,100 m on the ONC, and Cerro (Volcán) Tupungato (6,550 m CNC) is credited with 6,800 m on the ONC. The elevation of Cerro/Nevado Ojos del Salado (lat 27°07'S.) is 6,880 m on the CNC, 6,863 m according to a Polish triangulation in 1937, 6,937 m according to an Argentine one, 6,885+-3 m according to a U.S. Commission led by Adams Carter in 1956, and 6,900+-5 m according to Spedizione Condor (1989), whereas it is credited with 7,084 m on the ONC. This last elevation, which appears to make this summit shared by Chile and Argentina higher than the summit of Argentine Aconcagua, was obtained with a pocket altimeter by the official Chilean expedition of Captain Gajardo in 1956.
Figure 5.--Comparison between an older U.S. Operational Navigation Chart (ONC) and a Landsat 2 image. A, Reproduction of part of 1:1,000,000-scale ONC Q-27, Edition 3, compiled in 1973, published in April 1974. B, The same area seen on Landsat 2 MSS image 2418-13400, band 7 (15 March 1976; Path 249, Row 79) from the EROS Data Center, Sioux Falls, S. Dak. Although valuable for basic reference, note that the ONC contains many geographic errors. For example, (1) the elevations are incorrect by about 180 m; (2) the boundary between Chile and Argentina is incorrect (The international border lies on the water divide between the two closed drainage basins of Laguna Verde (Chile) and Salina de la Laguna Verde (Argentina)); (3) a white tongue of sand just south of Cerro Solo (between Cerro/Nevado Tres Cruces and Cerro/Nevado Ojos del Salado) has been mismapped as a salar (blue dots); and (4) a caldera about 5 km in diameter northwest of Cerro Bonete is not shown.
The elevation of Aconcagua has been often determined because it is the highest summit of the Americas and of the Southern Hemisphere. The first results were:
| 6,970 m | (Güssfeldt in 1887) |
| 6,960 m | (Comisión de Límites in 1897) |
| 7,035 m | (Fitz-Gerald Expedition of 1897, which reached the summit) |
| 6,960 and 6,946 m | (two distinct triangulations by Schrader in 1904) |
| 6,954 m | (IGMA, unpublished; verbal commun. in 1951) |
In spite of this last result, an elevation of 7,021 m was chosen by the Director of the IGMA for the maps published in the 1950's. In 1956, a very precise determination was made by the University of Buenos Aires, Argentina, which used 2,100 km of geodetic leveling from the Atlantic coast and direct triangulation for only the last 18 km (Baglietto, 1957). It yielded 6,959.75+-1.18 m, exactly the old value of Comisión de Límites, which made its leveling from the Pacific coast, a distance of only 120 km. Therefore, on the OAIC and ONC, a correct value, 6,959 m, has been reestablished. An elevation determined by satellite geodesy, 6,962+-1 m (Spedizione Condor, 1989) is less trustworthy because the geoid model OSU 89, which is used in the Global Positioning System (GPS), may well be inaccurate by 2 m in this region. For the same reason, the elevation of Cerro/Nevado Ojos del Salado should be about 6,885 m rather than about 6,900 m.
The following information on geographic place-names will assist in interpreting place-names found on Andean maps. In Spanish, the double ell (ll) is pronounced as the English y. In Chile, the popular pronunciation of hua/hue is gua/gue. As a result, Oyahue and Ollague are identical (both are given in table 6). Monte in Spanish denotes a hilly and forested terrain rather than a mountain. The Spanish word pico (beak) has a second meaning, peak; in Chile (but not in Argentina), it has a sexual meaning and is almost taboo. Therefore, Chilean mountains are called cerros (in Spain, a cerro is only a hill). If it holds permanent snow or glaciers, it is called nevado, a word usually abbreviated to nvdo. on maps. The abbreviation of nvdo. on maps explains the incorrect name of nudo (knot) given to some nevados by foreign geographers.
The high elevations in the Dry Andes cause all precipitation to fall as snow. Cold powder snow is blown from the mountain summits. Glacierets in the Desert Andes may be found only on the leeward side of summits, in more or less well-pronounced cirques (glaciers eroded some of the cirques during the "Ice Age"). In the Desert Andes, precipitation is accompanied during local storms by a great deal of lightning. By comparison, lightning is almost unknown in the Chilean Central Valley and in Patagonia. The transient snowline may, therefore, differ from one mountain to another. Large glaciers of the Central Andes are found at the heads of high valleys. Glaciers are most commonly oriented to the southeast and their elevation increases from west to east (fig. 6). Thus, the concept of a snowline as a function of elevation, or the lower limit of glacierization, cannot be applied in the Dry Andes. Only a glaciation level may be defined (elevation of the lowest summits that have permanent snow patches), and even this concept must be handled with care, given the greater importance of local topography (fig. 2). For instance, the young Volcán Maipo (5,290 m) (lat 34°10'S.) has only a few permanent snow patches in gullies, although the glaciation level is about 4,500 m in this area.
Figure 6.--West-east cross section through the Central Andes at Portezuelo de/Paso Piuquenes (lat 33°38'S.), the lowest pass east of Santiago, showing mountains and glaciers just to the north. The most common orientation of glaciers is to the southeast; their elevation rises to the east. The westernmost glacier is Glaciar Echaurren, which is monitored by Dirección General de Aguas (Santiago) (modified from Lliboutry, 1956).
As in all semiarid and arid regions, the range of annual precipitation is very large. For example, in Santiago (lat 33°30'S.) between 1846 and 1948, the minimum precipitation was 66 mm in 1924, and the maximum was 820 mm in 1901. The distribution of annual precipitation is distinctly bimodal. Instead of saying that the mean annual precipitation in Santiago is 370 mm, it is better to say that, 4 years out of 5, it fluctuates around 300 mm, and 1 year out of 5, around 660 mm. (These years of high precipitation will be called thereafter as "wet years.") At the town of Los Andes (about lat 33°S.), 70 km north of Santiago, the annual precipitation is about 300 mm. In Rancagua (about lat 34°S.), 80 km to the south, it is always about 660 mm a-1. Clearly, Santiago is on the boundary between two climatic subregions.
Air temperatures at high elevations have been published only for Paso de la Cumbre/de Uspallata (3,837 m) (lat 32°50'S.). In table 2, unpublished data from the Observatorio del Infiernillo (4,320 m) (lat 33°10'S.) are presented (Professor Gabriel Alvial, written commun., 1966). An interesting fact is that air temperature depends mainly on weather conditions. The range of mean daily temperatures within a given month is slightly larger than the range of monthly temperatures for the entire year (11°C). However, both are generally considerably larger than the daily range. The preceding refers only to air temperatures. Because of elevation and low humidity, diurnal oscillations of temperatures at the ground surface may be quite large.
Table 2.--Summary of air temperatures (°C) recorded every 2 hours at the Observatorio del Infiernillo, 1962-65
[Lat 33°10'S., long 70°17'W., 4,320 m; --, no data. Source: Professor Gabriel Alvial (written commun., 1966)]
| Date | Maximum in the month |
Maximum of daily means |
Monthly mean | Minimum of daily means |
Minimum in the month |
|
| DRY SEASON |
Nov 1962 | 8.2 | 3.7 | -2.1 | -11.1 | -12.2 |
| Mar 1963 | 7.9 | 2.3 | -1.4 | -7.0 | -11.4 | |
| Apr 1963 | 7.8 | 4.0 | -0.5 | -6.5 | -10.7 | |
| Jul 1963 | 4.6 | 1.1 | -10.3 | -16.3 | -17.8 | |
| Aug 1963 | -0.8 | -3.7 | -10.6 | -17.8 | -12.1 | |
| DRY SEASON |
Dec 1963 | 9.8 | 5.3 | 0.26 | -8.7 | -10.1 |
| Jan 1964 | 12.1 | 8.2 | 1.3 | -4.7 | -6.6 | |
| Apr 1964 | 5.3 | -0.3 | -3.8 | -11.4 | -14.7 | |
| May 1964 | 6.0 | 1.9 | -2.7 | -7.9 | -10.6 | |
| Jun 1964 | -3.7 | -7.2 | -11.5 | -19.6 | -22.7 | |
| Aug 1964 | 1.5* | -2.5* | -9.7* | -17.4* | -19.4* | |
| Sep 1964 | 7.0* | 1.4* | -5.6* | -15.1* | -18.0* | |
| Oct 1964 | 5.9 | 0.7 | -5.8 | -12.7 | -14.4 | |
| DRY SEASON |
Nov 1964 | 6.9 | 1.3 | -3.8 | -9.5 | -13.2 |
| Dec 1964 | 5.9 | 3.1 | -2.8 | -9.1 | -15.0 | |
| Jan 1965 | 7.5* | 4.1* | 0.3* | -4.9* | -8.0* | |
| Feb 1965 | 9.0 | 4.4 | -2.4 | -5.2 | -10.1 | |
| Mar 1965 | 9.5 | 6.0 | 1.3 | -4.7 | -8.8 | |
| Apr 1965 | 6.0 | 2.1 | -5.8 | -10.9 | -13.3 | |
| May 1965 | 0.3 | -1.5 | -8.6 | -20.1 | -22.2 | |
| Jun 1965 | 4.0* | 1.9* | -6.5* | -12.4 | -14.9* | |
Table 3.--Mean air temperatures at the Observatorio del Infiernillo (4,320 m) and at Paso de la Cumbre/de Uspallata (3,827 m)
[Lat 32°50'S., long 70°05'W.]
|
Mean temperature |
||
|---|---|---|---|
|
Snowy season |
Dry season |
Entire year |
|
Infiernillo (4,320 m) |
-8.01°C |
-1.05°C |
-4.53°C |
|
La Cumbre/de Uspallata (3,827 m) |
-5.23°C |
3.33°C |
-.95°C |
|
Vertical gradient (adiabatic lapse rate per 100 m) |
.56°C |
.89°C |
.73°C |
Mean air temperatures and the vertical gradient given in table 3 show that at 4,400 m, which is the elevation of the ELA on the glaciers of this area, the mean air temperature during the dry season should be about -1.8°C, and for the entire year about -5.1°C. Thus, the glaciers are cold and all the more so throughout the Dry Andes, where glaciers are found at higher elevations.
Since 1968, the Dirección General de Aguas (Santiago, Chile) has maintained a meteorological station and has carried out mass-balance measurements of Glaciar Echaurren Norte (lat 33°33'S., long 70°08'W., 3,650 to 3,880 m above sea level (asl), drainage basin of Río Maipo (Peña, Vidal, and Escobar, 1984)) (see location in fig. 6 (Cerro Echaurren)). Summer is cloudless most of the time. Ice melt is about 2.4 cm per day in January and about 1.7 cm in May (water equivalent). During the night, the surface temperature of the glacier drops to -5.0°C to -7.0°C, and the cold wave penetrates to 40 cm. Consequently, a large amount of meltwater refreezes. In late spring, until all the firn reaches melting point, ice lenses form. Later, superimposed ice is accreted to cold glacier ice. Owing to this melting-refreezing process, any layer of newly fallen summer snow has a density of 0.4-0.6 after 3 weeks, independent of its thickness, and must be called firn. In January, the snow from the previous winter has a density of 0.63.
Because the nourishment of glaciers is by superimposed ice, the usual concept that the highest position of the transient snowline is the equilibrium line is wrong in the Dry Andes. This highest position is well above the ELA. In fact, because the annual variability of precipitation is quite large, at the end of the melt season in normal years, only patches of firn (where local factors have provided an abnormally thick winter snow) are found on the glaciers. In wet years, the whole glacier may be an accumulation area.
Although the monitoring of the ELA is recommended by the Permanent Service for the Fluctuation of Glaciers (a permanent service, now merged with the World Glacier Monitoring Service in Zürich, Switzerland, and sponsored by the International Council of Scientific Unions), this monitoring is impossible in the Dry Andes and would be a useless exercise. Only cores and snow-pit studies allow monitoring of mass balance in successive years (and with a poor accuracy because of penitents). Past mass balance in an actual accumulation area cannot be determined because of large gaps in the stratigraphy (Cabrera, 1984; Escobar and Vidal, 1992; Escobar and others, 1995).
Penitents (the name derives from a resemblance to religious brothers wearing cowls and walking during Holy Week) are irregular blades of firn or ice, oriented east-west and pointing toward the Sun; thus, they tilt toward the north in the Southern Hemisphere. They are created as the result of differential snow-ice evaporation-sublimation rates when the air and dew-point temperatures are below 0°C, and solar radiation is intense over a period of many weeks (Lliboutry, 1954b, 1964). The temperature of the blades of the penitents remains below the melting point, whereas in the depressions between the blades, trapped solar radiation and humid air combine to melt the firn or underlying glacier ice.
The formation of penitents is the rule in the Dry Andes, except in the wet years of central Chile. We may even define the southern limit of the Dry Andes by the disappearance of penitents. (In this case, on the Argentine side, the Dry Andes should extend to Volcán Domingo at lat 37°S.)
In the Andes Mountains near Santiago in normal years, small penitents about 10 cm high (micropenitents) can be observed as soon as late winter (Lliboutry, 1961). At 3,500 m, they reach about 50 cm tall in spring and 1 m in January (summer). The north-south dimension always remains 2 to 3.5 times smaller than the height of the blades as the blades melt. But at moderate elevations with the rise of the mean air temperature, the blades melt and penitents become mere "sun spikes." It is only at elevations higher than 4,500 m that penitents keep their shape indefinitely.
When the furrows of penitents reach bare soil, the penitents may be blown down; when the furrows reach glacier ice, the carving by local melting goes on into this ice (figs. 7, 8). Penitents on glaciers are, in general, 2-3 m high. Therefore, mountaineers (in Latin America, andinistas) avoid crossing any glacier, unless traveling in the east-west direction of the furrows. Nevertheless, the tallest penitents ever observed (5-8 m high) were not found on a glacier but on a snowdrift that had become firn. It was at 6,000 m on the north slope of Cerro/Nevado Ojos del Salado (lat 27°S.) in November 1949 (Belastín, verbal commun., 1952).
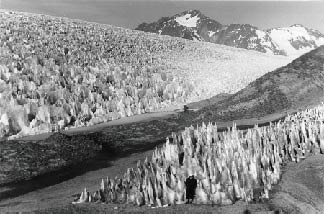
Figure 7.--Snow penitents (bottom) and ice penitents (left) on Glaciar Olivares Beta at 4,700 m. The highest mountain summit in the background is Nevado del/el Plomo (6,050 m) seen from the southwest. Man dressed in black in the foreground gives the scale. See figure 9 (number 11) for general location. Photograph by Louis Lliboutry taken on 28 January 1953.
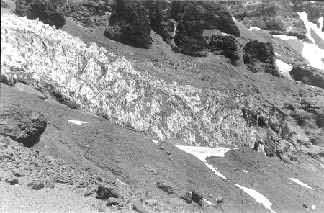
Figure 8.--Ice penitents on the lower part of Glaciar Marmolejo. Cerro Marmolejo, source of the glacier, is near the south edge of figure 9. It is not possible to monitor fluctuations of the glacier terminus on an annual basis. Photograph by Louis Lliboutry taken on 13 January 1953.
Heat-balance measurements in a field of penitents may be done at two scales: (1) "microscopic" balances in the furrow on the south wall of a blade (which is in the shadow in summer because of the decreasing elevation of the Sun at midday) and on the north, sunny wall; and (2) "macroscopic" balances, which consider a heat-transfer layer several meters thick. For the latter, albedo measurements have been published by Peña, Vidal, and Salazar (1984). Whereas the albedo of fresh summer snow is 0.75-0.82 the first day and 0.70-0.74 after 3 days, and the albedo of firn from the previous winter is 0.45-0.55, the albedo of a field of penitents carved in this firn is only 0.30-0.40.
The water that flows out from a field of penitents, even with negative air temperatures, cannot be predicted by the mathematical models in common use in snow hydrology. The large drainage basin discharges given in table 4 cannot be attributed to dew or melting of rime ice. The probable smallness of the deficit in outflow of cordilleran drainage basins (in the Dry Andes) comes from the lack of plant and tree cover and associated transpiration.
Table 4.--Area of drainage basin and discharge of mountain rivers in the Chilean Andes
Drainage basin and river (measurement point) |
Area of drainage basin (km2) |
|
Discharge1 (m3 s-1) |
Total annual discharge1 (106 m3 s-1) |
Specific discharge1 (mm) |
||||
|---|---|---|---|---|---|---|---|---|---|
|
Total1 |
Glacierized area2 |
|
Maximum |
Minimum |
||||
|
Río Aconcagua drainage basin: |
|
151.5=10.4 % |
|
|
|
|
|
|
|
|
Río Colorado Provincia de Aconcagua (confluence) |
830 |
|
|
31.45 |
(Dec) |
4.3 |
(Jun) |
399 |
480 |
|
Río Juncal (confluence) |
247.2 |
|
|
14.86 |
(Jan) |
1.9 |
(Aug) |
206 |
840 |
|
Río Blanco (Saladillo) |
384.6 |
|
|
27.62 |
(Jan) |
1.5 |
(Jul) |
308 |
800 |
|
|
|
|
|
|
|
|
|
|
|
|
Río Maipo drainage basin: |
|
422.1=11.5 % |
|
|
|
|
|
|
|
|
Río Colorado Provincia de Santiago (confluence) |
1,020 |
|
|
82 |
(Jan) |
11 |
(Jul) |
1,730 |
1,590 |
|
Río Yeso (confluence) |
573 |
|
|
25 |
(Dec/Jan) |
4.5 |
(May) |
379 |
660 |
|
Río El Volcán (Los Queltehues) |
546 |
|
|
37 |
(Jan) |
6 |
(Aug) |
505 |
920 |
|
Río Maipo superior |
1,540 |
|
|
-- |
|
-- |
|
950 |
620 |
|
|
|
|
|
|
|
|
|
|
|
|
Río Cachapoal: |
|
221.9=9.6 % |
|
|
|
|
|
|
|
|
(Coya) |
2,320 |
|
|
171.5 |
(Jan) |
41.9 |
(Jul) |
2,610 |
1,120 |
|
|
|
|
|
|
|
|
|
|
|
|
Río Tinguiririca: |
|
106.4=7.0 % |
|
|
|
|
|
|
|
|
(Los Briones) |
1,525 |
|
|
114.1 |
(Jan) |
24.8 |
(Apr) |
1,730 |
1,130 |
1 Data from Empresa Nacional de Electricidad, Sociedad Anónima (ENDESA) [National Electric Power Enterprise, Incorporated, Chile].
2 Data from Valdivia (1984).
3 3, Avenue de la Foy, 38700 Corenc, France.
| Home | Next |
U.S. Geological Survey, U.S.Department of the Interior