The Cordillera Huagaruncho, a 10-km long, east-trending range, lies between lat 10°14' and 10°19'S. and long 75°57' and 76°03'W. (fig. 2, table 1). The glacierized area, estimated from Landsat images, is 48 km2. It is drained by Río Huallaga into the Atlantic Ocean. The highest elevation is 5,879 m asl on Nevado Huagaruncho.
The Cordillera Urubamba, a glacierized mountain range within the eastern cordillera, is between lat 13°08' and 13°17'S. and long 71°58' and 72°16'W. It trends in a northwesterly direction for about 30 km (fig. 2, table 1). The glacierized area is estimated from Landsat images to be 23 km2. It drains to the Atlantic Ocean by Río Vilcanota and Río Yanatile. The highest peak is Nevado Veronica at 5,750 m asl.
The Cordillera de Vilcanota has the second largest concentration of glaciers in Perú; it extends in a northerly direction for about 80 km and then in a westerly direction for about 40 km between lat 13°39' and 14°29'S. and long 70°31' and 71°20'W. (fig. 2, table 1). The glacierized area is 539 km2, as estimated from Landsat images. Drainage is eastward to the Atlantic Ocean by Río Vilcanota, Río Paucartambo, Río Inambari, and Río Madre de Dios. The highest mountain is Nevado Auzangate at 6,384 m asl. Hollin and Schilling (1981, p. 191), referring to the work of Mercer and Palacios (1977), note that "on the north side of [Nevado] Auzangate (6,400 m) in the Upismayo Valley, the present glacier front is at about 4,600 m, while the late Wisconsin-Weichselian limit (sometime between 29,000 and 14,000 B.P.) was at about 4,200 m and the lowest Pleistocene limit at 3,650 m."
The Quelccaya ice cap (Zamora and Ames, 1977) is the largest single glacier in Perú (figs. 8 and 9). As previously mentioned, the Ohio State University's Institute of Polar Studies, in cooperation with the Government of Perú, carried out extensive paleoclimatic investigations from 1974 to 1984 of this low-latitude ice cap. In 1983, the project drilled two ice cores measuring 164 m and 154 m in length that contained a climatic record for the past 1,500 years. Figure 8 is a Landsat image of the Cordillera de Vilcanota area. Additional information about the Quelccaya ice cap is provided in the following separate section.
Figure 8.--Section of an annotated Landsat image of the Cordillera de Vilcanota. Quelccaya ice cap, the largest single glacier in Perú, is in this cordillera. Comparison of this image with figure 9 shows that the margin and structure of this ice cap are well represented here. Landsat 2 MSS image (2225-14074, band 5; 4 September 1975; Path 3, Row 70) from EROS Data Center, Sioux Falls, S. Dak.

By Stefan L. Hastenrath
The Quelccaya ice cap is situated in the Cordillera de Vilcanota in the eastern branch (Cordillera Oriental) of the Peruvian Andes. It is near the dropoff to the wet Amazon basin and is among the few large ice plateaus in the tropics (figs. 8, 9). It has an area of 54 km2 and reaches a summit elevation around 5,650 m. Its rim is mostly formed by steep ice cliffs; it feeds only a few outlet glaciers, the largest of which descends to about 5,000 m on the western side of the ice cap.
Figure 9.--Quelccaya ice cap (green) in the Cordillera de Vilcanota showing the margin of the ice cap and elevation contours in meters. Map modified from Thompson (1980).
The Quelccaya ice cap was the object of a multiyear field project aimed at the reconstruction of an estimated 1,500-year-long climatic record based on isotope and microparticle analysis of ice cores. Observations of the modern meteorological conditions and measurements related to the mass and heat budgets were also important components of the project. For additional details, refer to the work of Mercer and others (1975); Thompson and Dansgaard (1975); Hastenrath (1978); Thompson, Hastenrath, and Morales Arnao (1979); Thompson, Bolzan, and others (1982); Thompson, Mosley-Thompson, Grootes, and others (1984); Thompson, Mosley-Thompson, and Morales Arnao (1984); Thompson, Mosley-Thompson, Bolzan, and Koci (1985); Thompson, Mosley-Thompson, Dansgaard, and Grootes (1986); Thompson, Davis, and others (1988); Thompson (1980, 1988); Lyons and others (1985); Thompson and Mosley-Thompson (1987, 1989); and Grootes and others (1989).
The best map available of the Quelccaya ice cap, published in 1976, is at a scale of 1:25,000 and is based on 1962-63 aerial photography. It covers most of the ice cap except the highest parts (see table 5). Topographic contours on the summit plateau were completed in August 1976 and were based on traverses made with aneroid altimeters and a theodolite. In addition, an aerial photographic mosaic, based on the same aerial survey, was published in 1966 at a scale of 1:50,000 (table 6).
The Quelccaya ice cap and environs are clearly depicted on Landsat imagery (fig. 8). Comparison of the Landsat image and the map (fig. 9) shows that the margin and structure of this large ice body are remarkably well represented on the satellite image.
The Cordillera de Carabaya is in the Cordillera Oriental between lat 14°00' and 14°22'S. and long 69°38' and 70°19'W. It extends 75 km in a northwesterly direction (fig. 2, table 1). The glacierized area is estimated from Landsat images to extend for more than 100 km2. Drainage is into the Titicaca basin to the south and into the Atlantic Ocean to the east by the Río Inambari. The highest peak is Nevado Allincapac at 5,780 m asl.
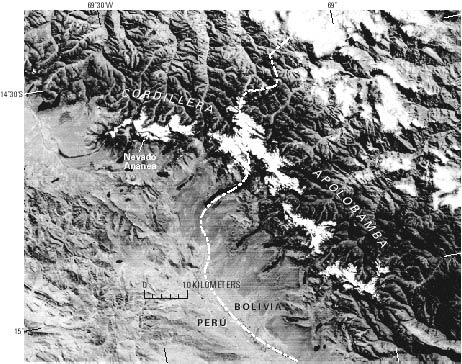
The Cordillera Apolobamba is at the northwestern end of the Bolivian Cordillera Real. In Perú, it extends about 35 km east between lat 14°35' and 14°45'S. and long 69°14' and 69°34'W. (fig. 2, table 1). The glacierized area, estimated from Landsat images, covers 102 km2. The highest peak, Nevado Ananea, is at 5,852 m asl. The drainage is both south into the Titicaca basin and north into the Atlantic Ocean by Río Inambari. Figure 10 shows this area on a Landsat image.
Figure 10.--Section of an annotated Landsat image of the Cordillera Apolobamba area. The glacierized area, estimated from Landsat images, is 102 km2. The cordillera continues into Bolivia as the Cordillera Real. Landsat 2 MSS image (2187-13565, band 7; 28 July 1975; Path 1, Row 70) from EROS Data Center, Sioux Falls, S. Dak.
| Home | Next |
U.S. Geological Survey, U.S.Department of the Interior