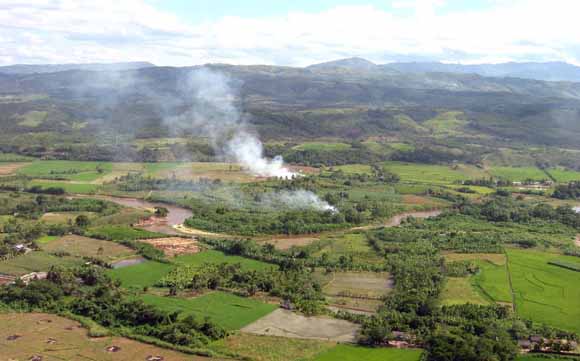
Land-cover changes such as these near Cordillera Azul National Park are addressed in this paper. Photograph by David Halsing
The first product of the Optimizing Design and Management of Protected Areas for Conservation Project is a land cover change detection analysis based on Landsat thematic mapper (TM) and enhanced thematic mapper plus (ETM+) imagery collected at intervals between 1989 and 2002. The goal of this analysis was to quantify and analyze patterns of forest clearing, land conversion, and other disturbances in and around the Cordillera Azul National Park in Peru. After removing clouds and cloud shadows from the imagery using a series of automatic and manual processes, a Tasseled Cap Transformation was used to detect pixels of high reflectance, which were classified as bare ground and areas of likely forest clearing. Results showed a slow but steady increase in cleared ground prior to 1999 and a rapid and increasing conversion rate after that time. The highest concentrations of clearings have spread upward from the western border of the study area on the Huallaga River. To date, most disturbances have taken place in the buffer zone around the park, not within it, but the data show dense clearings occurring closer to the park border each year. |
Download the pamphlet to accompany the six-sheet map set as a PDF file (SIM2879.pdf; 12 pages, 10.7 MB)
Five dates of Landsat TM data were used to determine the locations of forest disturbance. The accompanying map sheets plot the results of the disturbance mapping on a shaded relief image depicting the terrain of the region. Additional data layers have been added including transportation, hydrography, and boundaries. Sheet 2-5 are dedicated to showing a single-year worth of disturbances while sheet 1 displays the aggregated results of all years.
Download Sheet 1: Aggregated Disturbances as a PDF file (SIM2879-Sheet1.pdf; 24"x36", 38.1 MB)
Download Sheet 2: 1996 Disturbances as a PDF file (SIM2879-Sheet2.pdf; 24"x36", 27.4 MB)
Download Sheet 3: 1999 Disturbances as a PDF file (SIM2879-Sheet3.pdf; 24"x36", 27.4 MB)
Download Sheet 4: 2000 Disturbances as a PDF file (SIM2879-Sheet4.pdf; 24"x36", 27.3 MB)
Download Sheet 5: 2001 Disturbances as a PDF file (SIM2879-Sheet5.pdf; 24"x36", 27.3 MB)
Download Sheet 6: 2002 Disturbances as a PDF file (SIM2879-Sheet6.pdf; 24"x36", 27.3 MB)
For questions about the content of this report, contact Benjamin Sleeter
Download a current version of Acrobat Reader for free
| Help
| PDF help
| Western reports main page | Western Scientific Investigations Maps |
| Privacy
Statement | Disclaimer
| Accessibility |
| Geologic
Division | Geography Discipline
|
This map is also available in print from:
USGS Information Services, Box 25286,
Federal Center, Denver, CO 80225
telephone: 303-202-4210; e-mail: infoservices@usgs.gov