Astrogeology Research Program
The Magellan spacecraft orbited Venus from August 10, 1990, until it plunged into the Venusian atmosphere on October 12, 1994. Magellan Mission objectives included (1) improving the knowledge of the geological processes, surface properties, and geologic history of Venus by analysis of surface radar characteristics, topography, and morphology and (2) improving the knowledge of the geophysics of Venus by analysis of Venusian gravity.
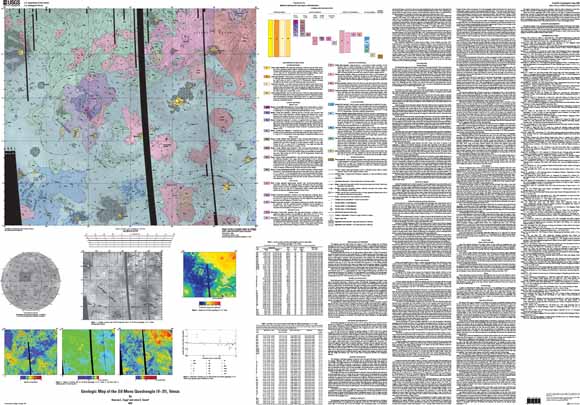
The Sif Mons quadrangle of Venus includes lat 0° to 25° N. and long 330° to 0° E.; it covers an area of about 8.10 x 10⁶ km2 (fig. 1). The data used to construct the geologic map were from the National Aeronautics and Space Administration (NASA) Magellan Mission. The area is also covered by Arecibo images, which were also consulted (Campbell and Campbell, 1990; Campbell and others, 1989). Data from the Soviet Venera orbiters do not cover this area.
All of the SAR products were employed for geologic mapping. C1-MIDRs were used for general recognition of units and structures; F-MIDRs and F-MAPs were used for more specific examination of surface characteristics and structures. Where the highest resolution was required or some image processing was necessary to solve a particular mapping problem, the images were examined using the digital data on CD-ROMs. In cycle 1, the SAR incidence angles for images obtained for the Sif Mons quadrangle ranged from 44° to 46°; in cycle 3, they were between 25° and 26°. We use the term “high backscatter” of a material unit to imply a rough surface texture at the wavelength scale used by Magellan SAR. Conversely, “low backscatter” implies a smooth surface. In addition, altimetric, radiometric, and rms slope data were superposed on SAR images. Figure 2 shows altimetry data; figure 3 shows images of ancillary data for the quadrangle; and figure 4 shows backscatter coefficient for selected units. The interpretation of these data was discussed by Ford and others (1989, 1993). For corrected backscatter and numerical ancillary data see tables 1 and 2; these data allow comparison with units at different latitudes on the planet, where the visual appearance may differ because of a different incidence angle. Synthetic stereo images, produced by overlaying SAR images and altimetric data, were of great value in interpreting structures and stratigraphic relations.
Download this map as an ~57" x 41" PDF document (sim2898.pdf; 15.3 MB)
For questions about the content of this report, contact Ken Tanaka
Suggested citation and version history
Download a current version of Adobe Reader for free
| Help
| PDF help
| Publications main page | Other Planetary Maps |
| Geologic
Division | Astrogeology Research Program
|
This report is also available in print from:
USGS Information Services, Box 25286,
Federal Center, Denver, CO 80225
telephone: 888 ASK-USGS; e-mail: infoservices@usgs.gov

![]() U.S. Department of the Interior | U.S. Geological Survey
U.S. Department of the Interior | U.S. Geological Survey
URL: https://pubs.usgs.gov/sim/2007/2898/
Page Contact Information: Michael Diggles
Page Last Modified: October 31, 2008