Scientific Investigations Map 3157
|
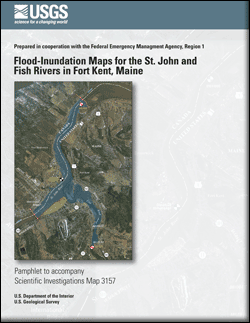
For this study, flood profiles were computed for the stream reach by means of a one-dimensional step-backwater model. The model was calibrated using gage height-discharge relations at USGS streamgages 01014000 and 01013500, and documented high water marks from a flood in April-May, 2008. The hydraulic model was then used to determine elevations throughout the study reaches for nine gage heights at streamgage 01014000, and for seven gage heights at streamgage 01013500. Flood-inundation maps for this report include 29 combinations of gage heights at the two streamgages. Gage heights are referenced to the streamgage datums and range from bankfull to approximately the highest recorded water level at the streamgages. The simulated water-surface profiles were then combined with a geographic information system (GIS) digital elevation model (derived from Light Detection and Ranging (LiDAR) data having a 0.6-ft vertical and 3.3-ft horizontal resolution) in order to delineate the area flooded at each water level. Flood inundation maps and current gage heights from USGS streamgages and forecasted stream gage heights from the NWS are all available on the internet. These data provide emergency management personnel and residents from Fort Kent with information that is critical for flood-response activities such as evacuations, road closures, emergency shelter location, disaster declarations and postflood recovery efforts. |
For additional information contact: Part or all of this report is presented in Portable Document Format (PDF); the latest version of Adobe Reader or similar software is required to view it. Download the latest version of Adobe Reader, free of charge. |
Lombard, P.J., 2011, Flood-inundation maps for the St. John and Fish Rivers in Fort Kent, Maine: U.S. Geological Survey Scientific Investigations Map 3157, 8 p. pamphlet, 29 sheets, scale 1:17,500.
Abstract
Introduction
Purpose and Scope
Study Area Description
Previous Studies
Methods
Constructing Water-Surface Profiles
Topographic/Bathymetric Data
Hydrologic and Steady Flow Data
Energy Loss Factors
Model Calibration and Performance
Development of Water-Surface Profiles
Flood-Inundation Maps
St. John and Fish Rivers, Fort Kent, Maine, Flood-Inundation Maps on the Internet
Uncertainty Associated with Inundation Maps
Acknowledgments
Summary
References Cited

![]() U.S. Department of the Interior |
U.S. Geological Survey
U.S. Department of the Interior |
U.S. Geological Survey
URL: http://pubsdata.usgs.gov/pubs/sim/3157/index.html
Page Contact Information: GS Pubs Web Contact
Page Last Modified: Thursday, 01-Dec-2016 17:22:35 EST