Figure 30. Graph showing specific capacity and estimated transmissivity of the Laredo aquifer and map showing well locations.

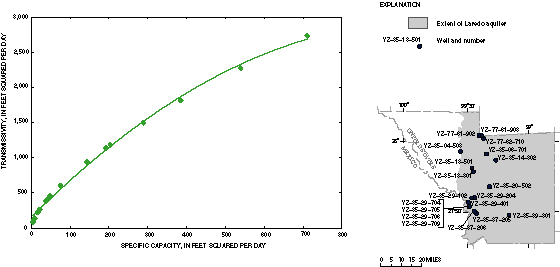
Figure 30.  Specific capacity and estimated transmissivity of the Laredo aquifer.

Back to Contents | Back to Text | Figure 31