Methods to Identify Changes in Background Water-Quality Conditions Using Dissolved-Solids Concentrations and Loads as Indicators, Arkansas River and Fountain Creek, in the Vicinity of Pueblo, Colorado
by Roderick F. Ortiz
Abstract
Effective management of existing water-storage capacity in the Arkansas River Basin is anticipated to help satisfy the need for water in southeastern Colorado. A strategy to meet these needs has been developed, but implementation could affect the water quality of the Arkansas River and Fountain Creek in the vicinity of Pueblo, Colorado. Because no known methods are available to determine what effects future changes in operations will have on water quality, the U.S. Geological Survey, in cooperation with the Southeastern Colorado Water Activity Enterprise, began a study in 2002 to develop methods that could identify if future water-quality conditions have changed significantly from background (preexisting) water-quality conditions. A method was developed to identify when significant departures from background (preexisting) water-quality conditions occur in the lower Arkansas River and Fountain Creek in the vicinity of Pueblo, Colorado. Additionally, the methods described in this report provide information that can be used by various water-resource agencies for an internet-based decision-support tool.
Estimated dissolved-solids concentrations at five sites in the study area were evaluated to designate historical background conditions and to calculate tolerance limits used to identify statistical departures from background conditions. This method provided a tool that could be applied with defined statistical probabilities associated with specific tolerance limits. Drought data from 2002 were used to test the method. Dissolved-solids concentrations exceeded the tolerance limits at all four sites on the Arkansas River at some point during 2002. The number of exceedances was particularly evident when streamflow from Pueblo Reservoir was reduced, and return flows and ground-water influences to the river were more prevalent. No exceedances were observed at the site on Fountain Creek. These comparisons illustrated the need to adjust the concentration data to account for varying streamflow. As such, similar comparisons between flow-adjusted data were done. At the site Arkansas River near Avondale, nearly all the 2002 flow-adjusted concentration data were less than the flow-adjusted tolerance limit which illustrated the effects of using flow-adjusted concentrations. Numerous exceedances of the flow-adjusted tolerance limits, however, were observed at the sites Arkansas River above Pueblo and Arkansas River at Pueblo. These results indicated that the method was able to identify a change in the ratio of source waters under drought conditions. Additionally, tolerance limits were calculated for daily dissolved-solids load and evaluated in a similar manner.
Several other mass-load approaches were presented to help identify long-term changes in water quality. These included comparisons of cumulative mass load at selected sites and comparisons of mass load contributed at the Arkansas River near Avondale site by measured and unmeasured sources.
Introduction
Effective management of existing water-storage capacity in the Arkansas River Basin is anticipated to help satisfy the need for water in southeastern Colorado. Additionally, the development of more water-storage capacity in the basin is anticipated as the population along the Arkansas River and Fountain Creek corridors increases over the next 40 years (fig. 1). An overall strategy to meet these needs has been developed by the Southeastern Colorado Water Activity Enterprise. The strategy is defined in the Preferred Storage Options Plan (PSOP) and sets a target of 122,100 acre-ft of new storage within the next 25 years (GEI Consultants, Inc., 2000). Elements of the PSOP include long-term contracts for water storage in excess capacity in Fryingpan-Arkansas Project space (by 2004), enlargement of Pueblo Reservoir (by 2013), enlargement of Turquoise Reservoir (by 2025), and various ongoing water-conservation measures.
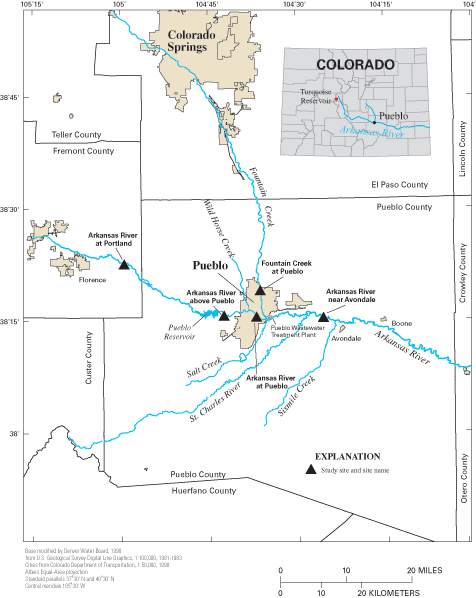
Figure 1. Location of study area and selected surface-water and water-quality sites.
Implementation of the PSOP could have an effect on the water quality of the Arkansas River and Fountain Creek in the vicinity of Pueblo, Colorado. A water-quality management program would be implemented if water quality was substantially degraded as a result of future changes in water operations. The management program would address these water-quality concerns by using best-management practices or other appropriate measures in a manner consistent with applicable water-supply needs and water-quality requirements (PSOP Implementation Committee, 2001). In 2002, a basic water-quality monitoring program was established in the basin to collect additional data needed to support the PSOP. Because no known methods are available to determine what effects future changes in operations will have on water quality, the U.S. Geological Survey (USGS), in cooperation with the Southeastern Colorado Water Activity Enterprise, began a study in 2002 to develop methods that could identify if future water-quality conditions have changed significantly from preexisting water-quality conditions (hereinafter referred to as "background conditions").
Purpose and Scope
This report presents the results of a study to develop methods to identify changes in background water-quality conditions using dissolved-solids concentrations and loads as indicators at selected sites in the Arkansas River and Fountain Creek in the vicinity of Pueblo, Colorado. Specifically, this report designates background conditions at selected sites in the study area with respect to estimated daily dissolved-solids concentration and load, establishes the use of tolerance limits to identify statistically significant future daily departures from a background condition, and presents other analysis techniques to help identify long-term changes in dissolved-solids load along selected reaches of the study area. Additionally, this report provides information that can be used by various water-resources agencies for an internet-based decision-support tool that can be used on a real-time basis to monitor dissolved-solids concentration and load as a surrogate for water-quality conditions in the study reaches and determine whether future water-quality conditions are significantly different from background conditions.
Five sites were selected for evaluation as part of this study (fig. 1 and table 1). The sites Arkansas River above Pueblo (07099400), Fountain Creek at Pueblo (07106500), and Arkansas River near Avondale (07109500) were of primary interest. The largest changes in water operations that could affect water quality are most likely to happen along the stream reaches represented by these three sites. Daily streamflow and specific conductance measurements have been collected for several years at all five study sites (table 1). Daily streamflow and specific conductance collected in 2002 were used to test the methodologies described in this report.
Table 1. Period of record for daily specific conductance and streamflow, years used to define background and test period, and percentage of background data reported as missing at selected sites in the Arkansas River and Fountain Creek in the vicinity of Pueblo, Colorado.
[P, primary site; S, secondary site]
Site name used in this report
(USGS station identification number) |
Site designation |
Period of record |
Calendar years to define
background period |
Calendar year as test period |
Percentage of data missing
during background period |
||
Daily specific conductance |
Daily streamflow |
Specific conductance |
Streamflow |
||||
| Arkansas River at Portland (07097000) | S | Nov. 1982 to Sept. 2002 | May 1939 to Sept. 1952; Oct. 1974 to Sept. 2002 | 1983-2001 | 2002 | 6 | 0 |
| Arkansas River above Pueblo (07099400) | P | Dec. 1985 to Sept. 2002 | Oct. 1965 to Sept. 2002 | 1986-2001 | 2002 | 4 | 1 |
| Arkansas River at Pueblo (07099970) | S | Oct. 1988 to Sept. 2002 | Oct. 1988 to Sept. 2002 | 1989-2001 | 2002 | 11 | 0 |
| Fountain Creek at Pueblo (07106500) | P | Dec. 1985 to Sept. 2002 | Jan. 1922 to Sept. 1925; Oct. 1940 to Sept. 1965; Feb. 1971 to Sept. 2002 | 1986-2001 | 2002 | 6 | 0 |
| Arkansas River near Avondale (07109500) | P | July 1979 to Sept. 1980; Dec. 1985 to Sept. 2002 | May 1939 to Sept. 1951; Feb. 1965 to Sept. 2002 | 1986-2001 | 2002 | 6 | 0 |
Description of the Study Area
The study area is located in the vicinity of Pueblo, Colorado, and extends about 32 mi from the site Arkansas River at Portland to the site Arkansas River near Avondale (fig. 1). River elevations along this reach range from 5,021 to 4,509 ft. The area is characterized by a semiarid climate with a mean annual precipitation of about 12 in. (Pielke and others, 2002). Mean annual humidity is relatively low at about 36 percent. The range in daily temperature averages about 18°C. Streamflow in the Arkansas River exhibits considerable seasonal variability with the majority of the total annual streamflow resulting from snowmelt runoff in the Rocky Mountains west of the study area. Streamflow from 1986 to 2001 averaged 732 ft3/s at the site Arkansas River above Pueblo and 999 ft3/s at the site Arkansas River near Avondale (U.S. Geological Survey, 1987-2002). The average streamflow at the site Fountain Creek at Pueblo was 166 ft3/s during 1986-2001 (U.S. Geological Survey, 1987-2002).
Pueblo Reservoir is a multipurpose facility constructed by the Bureau of Reclamation (fig. 1). The primary uses of the reservoir are for the storage and regulation of native and transmountain water for the Fryingpan-Arkansas Project and for flood control of the Arkansas River east of Pueblo Reservoir. Native water originates within the Arkansas River Basin while transmountain water (nonnative) originates from outside the basin and is conveyed by ditches or tunnels to the Arkansas River Basin. Storage capacity in the reservoir reserved for Fryingpan-Arkansas Project water is 80,400 acre-ft. Storage of some nonproject water is granted under a limited number of storage contracts when reservoir space is available. The nonproject reservoir storage space may be used for the storage of exchangeable water which is water that is diverted at one location in the river system and subsequently replaced with a like amount of water at another location (Lewis, 1999). Storage and release operations at Pueblo Reservoir control streamflow in the lower Arkansas River Basin. About 55 percent of the annual inflow to the reservoir occurs during the snowmelt period from April through July. Reservoir storage decreases substantially by the end of the growing season because of decreased inflow and large downstream demands for irrigation water. Water is stored under the Winter-Water Storage Program from November 15 to March 15 of each year. The program allows downstream irrigation-canal companies to store their direct-flow water in the reservoir for release in the spring or late summer when streamflow in the river may not be sufficient for irrigation needs. Prioritized direct-flow water rights for the Arkansas River were established as long ago as 1859 and are based on the doctrine that the first in time to use the water is first in right to receive that water in subsequent years (Lewis and Brendle, 1998). Those entities with the oldest direct-flow water rights are said to have the senior water rights.
Fountain Creek is an important tributary to the Arkansas River and is used to convey transmountain return flows from Colorado Springs to the Arkansas River. The City of Colorado Springs exchanges sewered and nonsewered return flows to Fountain Creek, which originate from its importation and use of non-native water, for water in the Arkansas River. The city first executed the transmountain return-flow exchange in 1981 (Lewis, 1999). Larger volumes of transmountain-return flow in Fountain Creek are likely as the City of Colorado Springs and other entities increase deliveries of transmountain water. Additionally, expected growth by the city could result in larger volumes of wastewater-treatment-plant effluent entering Fountain Creek and, ultimately, the Arkansas River.
Determination of Background Water-Quality Conditions
It is advantageous to know the background (preexisting) condition when conducting a scientific investigation. Specific knowledge of the background condition can be invaluable, particularly when changes to the system have happened or are likely to happen. The U.S. Environmental Protection Agency (1992) states that a background level is "the concentration of a hazardous substance that provides a defensible reference point that can be used to evaluate whether or not a release from the site has occurred." Additionally, "background levels do not necessarily represent prerelease conditions, nor conditions in the absence of influence from source(s) at the site." Although specific to hazardous-materials applications, the previous statements provide important criteria needed to define the background condition for each site in this study. As such, the rephrased definition states that the background condition is the concentration of a substance that provides a defensible reference point that can be used to evaluate whether or not a statistically significant change in water quality has occurred at a site. For the scope of this study, three questions needed to be addressed to determine the background condition at a site. What substance is an appropriate indicator of water quality? What timeframe (period of data) represents the background condition and provides a defensible reference point to assess future changes? Does the background condition allow evaluation so that a significant change can be identified? The following sections address these three questions.
Identification of significant changes requires a statement of the risk that is acceptable to the scientist, manager, or decision maker. This risk, or significance level, is the probability of incorrectly rejecting the null hypothesis when, in fact, it is true (Helsel and Hirsch, 1992). Whereas the risk does not depend on the data, the p-value provides information on the strength of the scientific evidence. The p-value is the probability of obtaining the computed test statistic, or one even less likely, when the null hypothesis is true (Helsel and Hirsch, 1992). The smaller the p-value the stronger the evidence for rejection of the null hypothesis.
Indicator Parameter
Dissolved solids was chosen as the indicator parameter in this study for several reasons. First, dissolved-solids concentrations in the river have been a concern to local water managers, water suppliers, and farmers in the lower Arkansas River Basin for many years. Batie and Healy (1983) described the high-salinity issue in this area as the most pervasive problem associated with irrigated agriculture in the United States; the Colorado Department of Public Health and Environment (2001) refers to dissolved solids as salinity. Second, dissolved solids also are a good indicator of the general water quality in the study area and can be accurately estimated from available specific-conductance data (Cain, 1987; Ortiz and others, 1998). Specific conductance is a measurement of the ability of a solution to conduct electrical current (measured at 25°C). The presence of charged ionic species in solution makes the solution conductive. The conductance of a solution increases as ion concentrations increase; therefore, the specific-conductance measurement provides an indication of ion or dissolved-solids concentration of the solution (Hem, 1985). Third, dissolved-solids concentrations (specific conductance) are sensitive to changes in streamflow, water operations, and source contributions. Lastly, the use of dissolved-solids concentration data combined with streamflow allows for analysis of mass loading as a parameter of interest. For the study, daily dissolved-solids concentrations at each site were calculated by developing a regression equation at each site from paired specific-conductance and dissolved-solids data dating from 1979 through 2001 (table 2), and applying the regression equation at each site to the mean daily specific conductance measured at each site to obtain an estimated or computed mean daily dissolved-solids concentration.
Table 2. Least-squares regression equations to estimate dissolved-solids concentration from specific conductance for selected sites in the lower Arkansas River Basin in the vicinity of Pueblo, Colorado.
[DS, dissolved-solids concentration, in milligrams per liter; SC, specific conductance, in microsiemens per centimeter; <, less than]
Site name (figure 1) |
Number of paired measurements
(1979-2001) |
Regression equation |
Coefficient of determination |
Standard error of the estimate |
p-value |
Dissolved solids |
|||||
| Arkansas River at Portland | 121 | 0.95 | 0.014 | <0.001 | |
| Arkansas River above Pueblo | 42 | .94 | .030 | <.001 | |
| Arkansas River at Pueblo | 26 | .99 | .019 | <.001 | |
| Fountain Creek at Pueblo | 26 | .98 | .024 | <.001 | |
| Arkansas River near Avondale | 39 | .98 | .020 | <.001 | |
Selection of Background Periods from Available Data
Available daily specific-conductance data for the five study sites were retrieved from the USGS National Water Information System (NWIS). Daily values represent the average for a given day computed from as many as 96 measurements. These data are published annually in the USGS Water-Data Reports for Colorado (U.S. Geological Survey, 1984-2003). For the purposes of this study, the background period at each site was defined by the number of consecutive calendar years that continuous daily specific-conductance data were available for a site (table 1). These data were available for 16 calendar years at the three primary study sites (1986-2001), 19 calendar years at Arkansas River at Portland (1983-2001), and 13 calendar years at Arkansas River at Pueblo (1989-2001). Missing values were estimated by using linear interpolation given the particular streamflow conditions at that time; from 4 to 11 percent of the specific-conductance data were reported as missing values (table 1). Daily specific-conductance data for calendar year 2002 also were retrieved but were not used to determine the background period, rather, these data were used to test the results of the methodology.
Available instantaneous specific-conductance data for the five study sites were retrieved from NWIS; instantaneous data are single measurements in time. These data are published annually in the USGS Water-Data Reports for Colorado (U.S. Geological Survey, 1976-2003). Instantaneous specific-conductance data dating back to January 1975 were retrieved for all study sites on the Arkansas River (U.S. Geological Survey, 1976-2001). Similarly, instantaneous specific-conductance data dating back to January 1982 were retrieved for Fountain Creek at Pueblo (U.S. Geological Survey, 1983-2001). These dates generally correspond with major changes in water operations in the study area and, although earlier data may exist, define the historical extent of water-quality conditions that corresponds to current water operations in the study area.
Daily-streamflow data were retrieved from NWIS for all continuous streamflow sites in the study area (U.S. Geological Survey, 1976-2003). These data were available for all sites on the Arkansas River after October 1974 with the exception of Arkansas River at Pueblo (table 1). Daily values were uninterrupted with less than 1 percent of the data at any site requiring estimation of missing values. Data prior to 1974 were available for some sites but were more intermittent and did not exhibit streamflow patterns associated with the operation of Pueblo Reservoir (Arkansas River sites) and transmountain-return flows (Fountain Creek at Pueblo).
Comparison of Background Periods to Historical Data
Sixteen years of daily specific-conductance data were used to define the background period (1986-2001) for dissolved-solids concentration at the three primary study sites (table 1). However, no daily specific-conductance data were available for the years prior to 1986 which included some of the driest years on record (fig. 2). To determine if the designated background period was representative of the longer period since the completion of Pueblo Reservoir (1975-2001), instantaneous specific-conductance data from 1975 through 1985 were compared to instantaneous data from 1986 through 2001 (fig. 3). The two data sets were compared using a Wilcoxon rank-sum test to see if the means were significantly different (S-PLUS 2000 User's Guide, 1999). A similar comparison was done for data from Fountain Creek at Pueblo dating back to January 1982. The test indicated that there was no significant difference in the means at a 95-percent confidence level (p < 0.05) for the test periods for the sites Arkansas River above Pueblo, Arkansas River near Avondale, and Fountain Creek at Pueblo. At the site Arkansas River at Portland, however, the statistical test indicated there was a significant difference in the means for the two periods. This result may be because a large number of samples were collected during the drought of 1977-1978, thus, biasing the data set, and because no data were collected prior to 1977. There was no significant difference in the mean values for the two periods when the data collected in 1977-1978 were removed and the test was run again. A comparison could not be made at the site Arkansas River at Pueblo because no data were collected prior to 1988. These results indicate that the background periods used for the primary study sites and, most likely, the secondary study sites generally are representative of the historical conditions since the last major changes in water operations in the Arkansas River downstream from Pueblo Reservoir and in Fountain Creek, except possibly during severe drought conditions.
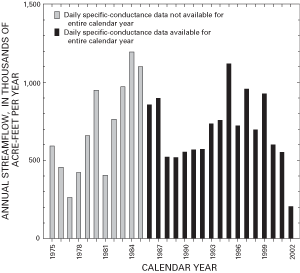
Figure 2. Annual streamflow at Arkansas River near Avondale, Colorado, 1975-2002.
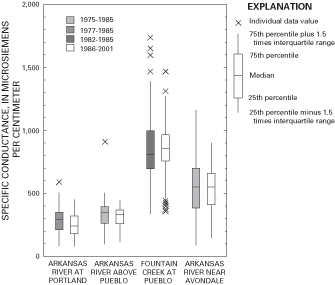
Figure 3. Comparison of instantaneous specific-conductance data at selected sites on the Arkansas River, 1975-1985 and 1986-2001, and at Fountain Creek at Pueblo, 1982-1985 and 1986-2001.
Variability Within the Background Concentrations
The variability of the background data is important in determining how much change in dissolved-solids concentration is needed in order to identify a statistically significant change. Significant departures from a background condition can be determined for most data; however, to be of any real value the change must be reasonable within the context of ongoing processes in the system and what level of confidence is needed to identify any changes. For each study site, daily mean dissolved-solids concentrations were sorted by Julian date (JD1=Jan1, JD2=Jan2,..., JD365=Dec31) and plotted to evaluate the variability for any given day of the calendar year (fig. 4). The daily variability in concentration for any single Julian date shows relatively little change regardless of the season for the sites located on the Arkansas River. The average daily variability at the sites Arkansas River at Portland and Arkansas River above Pueblo was less than 170 mg/L per liter while the daily variability at the sites Arkansas River at Pueblo and Arkansas River near Avondale was less than 320 mg/L. Dissolved-solids concentrations at sites on the Arkansas River exhibited typical seasonal patterns associated with hydrologic events in the basin. That is, there is a relatively uniform base-flow concentration from about September to April followed by a decrease in concentration as snowmelt from the mountains occurs. In June and July, dissolved-solids concentrations are at a minimum due to dilution from the high streamflow conditions. Concentrations increase throughout the summer before reaching base-flow conditions again in September. Daily variability at the site Fountain Creek at Pueblo was more pronounced (fig. 4) during the summer period as dissolved-solids concentrations changed in response to depleted streamflow from irrigation and(or) ground-water pumping and storm runoff. The average daily variability at the site Fountain Creek at Pueblo from April through September was about 550 mg/L. The daily variability decreased to 308 mg/L from October through March. Nevertheless, the daily variability in the background conditions at all five sites was sufficiently small for application of a method to determine when statistically significant departures might occur.
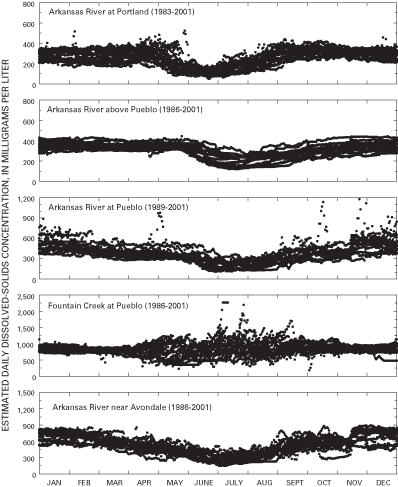
Figure 4. Variability of estimated daily mean dissolved-solids concentrations during background period at selected sites on the Arkansas River and Fountain Creek.
Identification of Short-Term Changes in Water Quality Using Dissolved-Solids Concentrations and Loads
Tolerance intervals, confidence intervals, and prediction intervals are three commonly used tests to determine if new data are consistent with previous background data. Tolerance intervals were selected for this application because they provide an estimation of the range that should contain a certain percentage of each individual measurement in the population. Within the context of a one-tailed interval, an upper tolerance limit statistically defines what percentage of the population measurements will not exceed a defined upper limit. Confidence intervals, on the other hand, are limits within which we expect a given population parameter, such as the mean, to lie. Whereas tolerance limits and confidence intervals estimate characteristics of present populations, prediction intervals provide an estimation of what values will be in the future based on background data. For this study, an upper tolerance limit was calculated for each study site by using information about the means and the amount of variability in the background data. Future water-quality conditions (as daily dissolved-solids concentrations or loads) then can be compared to these limits to determine if there are any exceedances of the limits. A one-tailed upper tolerance limit can be calculated from the equations shown below (Natrella, 1963).
Tolerance limit = ![]() (1)
(1)
where
![]() is the mean value,
is the mean value,
s is the standard deviation,
k is ![]() (2)
(2)
and
a is ![]() ,
(3)
,
(3)
and
b is ![]() ,
(4)
,
(4)
where
![]() is the critical value from the normal distribution that is exceeded with
probability
is the critical value from the normal distribution that is exceeded with
probability ![]() ,
,
![]() is the critical value from the normal distribution that is exceeded with
the probability
is the critical value from the normal distribution that is exceeded with
the probability ![]() ,
,
and N is the number of samples used to calculate k.
An upper tolerance limit was calculated for each Julian
date for each site by using the equation shown above; for the remainder
of this report, the term "tolerance limit" will imply the use of an upper
tolerance limit. The mean is defined as the daily average dissolved-solids
concentration for each Julian date for a background period. The variability
term is the product of the k-value and the standard deviation. The k-value
incorporates the probabilities ![]() and
and ![]() ,
which address two different characteristics of a tolerance limit. The
first is the stated confidence in the test, that is, the probability that
a value is greater than the computed tolerance limit. The second defines
the fixed proportion of the population covered by the test, that is, the
percent coverage. For instance, a k-value can be computed that uses a
99-percent confidence level and accounts for 99.9 percent of the population.
Care must be taken, however, to select appropriate probabilities for an
application because k-values become increasingly large with increased
confidence and coverage. For the purposes of the study, and in consultation
with the Southeastern Colorado Water Activities Enterprise, a 95-percent
degree of confidence with a 97.5 percent population coverage was selected
to determine the k-value for this report (Robert Hamilton, Southeastern
Colorado Water Activities Enterprise, oral commun., November 2003). The
number of samples (N) collected is required to calculate a k-value. For
each site, the number of samples collected, for a particular Julian date,
was set as the number of calendar years for which daily specific-conductance
data were available (table 1). Tabled k-values for different sample numbers
and various degrees of confidence and percentage of coverages can be found
in Natrella (1963).
,
which address two different characteristics of a tolerance limit. The
first is the stated confidence in the test, that is, the probability that
a value is greater than the computed tolerance limit. The second defines
the fixed proportion of the population covered by the test, that is, the
percent coverage. For instance, a k-value can be computed that uses a
99-percent confidence level and accounts for 99.9 percent of the population.
Care must be taken, however, to select appropriate probabilities for an
application because k-values become increasingly large with increased
confidence and coverage. For the purposes of the study, and in consultation
with the Southeastern Colorado Water Activities Enterprise, a 95-percent
degree of confidence with a 97.5 percent population coverage was selected
to determine the k-value for this report (Robert Hamilton, Southeastern
Colorado Water Activities Enterprise, oral commun., November 2003). The
number of samples (N) collected is required to calculate a k-value. For
each site, the number of samples collected, for a particular Julian date,
was set as the number of calendar years for which daily specific-conductance
data were available (table 1). Tabled k-values for different sample numbers
and various degrees of confidence and percentage of coverages can be found
in Natrella (1963).
One value for the standard deviation was used in the calculation of an individual tolerance limit at each site on the Arkansas River because the variance in the daily concentrations was relatively constant at each of these sites (fig. 4). Two values for the standard deviations, however, were used to compute tolerance limits at the site Fountain Creek at Pueblo because the daily variance showed substantial differences depending on the time of the year (fig. 4). One value was used for the period from late September (JD265) to early April (JD100) when the range in variance was relatively small. A second value was used for the intervening period when daily variances were larger. Computation of the standard deviation(s) for each site was completed in a four-step process. First, the daily variance for each Julian date at each site was calculated. Second, the variances were assessed for similarity and grouped by period or season, if needed. Third, the average variance was calculated for all Julian dates within a defined period or season. Lastly, the square root of the average variance was calculated, which resulted in the standard deviation used to calculate the tolerance limits (David Mueller, U.S. Geological Survey, written commun., May 2003).
Tolerance Limits for Dissolved-Solids Concentration
Tolerance limits for dissolved-solids concentrations at each site were calculated by converting daily specific-conductance data to daily dissolved-solids concentrations using the regression equations shown in table 2 and then by using the methods described in the previous section. The resulting tolerance limit for each Julian date, at each site, was compared to selected summary statistics for the background period to ensure that results obtained by this methodology were reasonable (fig. 5). With relatively few exceptions, the 95th percentile value for a given Julian date did not exceed the defined tolerance limit. The 95th percentile was used in the comparison because it allowed for the exclusion of one potentially extreme outlier for a particular Julian date during the background period. It is worth restating that the tolerance limits shown in figure 5 were based on a 95-percent confidence and a 97.5-percent population coverage. More or less rigid tolerance limits can be defined by increasing or decreasing either the confidence level or the percent population coverage.
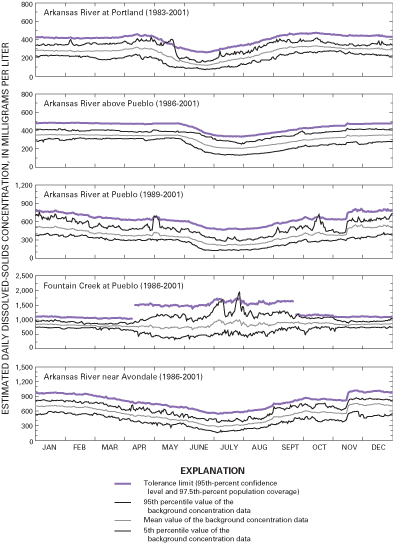
Figure 5. Tolerance limits for estimated dissolved-solids concentrations at selected sites on the Arkansas River and Fountain Creek.
The tolerance limits calculated for this study incorporated data through the year 2001. As such, the only comparison data available to test the methodology were the estimated dissolved-solids concentrations for calendar year 2002. As it turned out, 2002 proved to be one of the most severe drought years in Colorado since the drought of 1977 (Colorado Climate Center, 2002). Streamflow and snowpack levels in much of Colorado were at record low levels, and agricultural and domestic water supplies were severely limited. In the study area, conditions were similar as only the most senior water rights were satisfied, and discharge from Pueblo Reservoir was reduced substantially or shut down for an extended period during the summer. Monthly mean streamflow at the site Arkansas River above Pueblo for August and September in 2002 were 16.5 and 4.1 ft3/s, respectively, compared to the historical means of 2,716 and 1,040 ft3/s for the same two months (U.S. Geological Survey, 2003). As streamflow decreased in 2002, dissolved-solids concentrations increased to record levels in the study area. Estimated dissolved-solids concentrations from about mid-June through December were either the highest or among the highest on record at the sites Arkansas River above Pueblo, Arkansas River at Pueblo, and Arkansas River near Avondale (fig. 6). A similar pattern was observed at the site Arkansas River at Portland, but it was not as pronounced. No record maximum concentrations were observed at the site Fountain Creek at Pueblo during 2002 (fig. 6) because base flow from Colorado Springs maintained a near-normal streamflow.
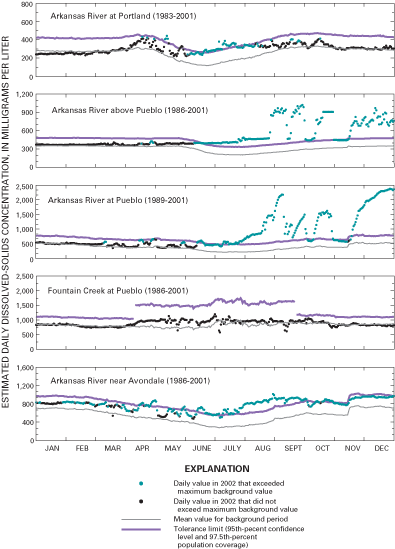
Figure 6. Comparison of estimated daily dissolved-solids concentrations in 2002 with maximum concentrations during background periods and calculated tolerance limits at selected sites.
In 2002, dissolved-solids concentrations exceeded the tolerance limit at some point during the summer at all four sites on the Arkansas River (fig. 6). These exceedances were particularly evident at the sites Arkansas River above Pueblo and Arkansas River at Pueblo, where for an extended period of time, concentrations were much higher than the tolerance limits. Streamflow from Pueblo Reservoir was reduced substantially during this period and ground water and return flows to the river had a marked effect on the river. Although streamflow was reduced, relatively few exceedances were observed at the site Arkansas River at Portland because the source of the water in the river did not change appreciably. Exceedances of the tolerance limit routinely occurred at the site Arkansas River near Avondale but not to the extent observed at the sites Arkansas River above Pueblo or Arkansas River at Pueblo. The high dissolved-solids concentrations in the Arkansas River likely were diluted by near-normal streamflow from Fountain Creek. No exceedances of the tolerance limit were observed at the site Fountain Creek at Pueblo. As discussed previously, two different values for the standard deviations were used to calculate the tolerance limit at this site because of the high daily variability observed during the summer period (fig. 4).
The use of the 2002 data to test the utility of the method illustrated two important points. First, changes in concentration could be attributable to either a change in streamflow, a change in the predominant source water to the system, or a combination of both. Second, because dissolved-solids concentration is significantly related (inversely) to streamflow, it would be advantageous to adjust the concentration data to account for varying streamflow, thus diminishing the influence of streamflow on dissolved-solids concentrations. The following section describes the use of tolerance limits on flow-adjusted concentrations to help identify changes in water quality in the study area.
Tolerance Limits for Flow-Adjusted Dissolved-Solids Concentration
The concentrations of many constituents are affected by streamflow. Typically, adjustment of the concentration data to account for varying streamflow is needed before further analysis to evaluate differences in concentration is done. The effects of streamflow can pose a problem when evaluating changes in specific conductance and dissolved solids because of the inherent inverse relation between these variables and streamflow. The use of flow-adjusted concentrations by the residuals method provides a way to remove the source of much of the variance due to the influence of streamflow (Rickert, 1985). Residuals analysis regresses the measured value on some function of streamflow and uses the residuals from the regression (the observed measurement minus the predicted value) as flow-adjusted values. The residual method works well if a functional form of the measured value to streamflow regression produces a reasonable fit. To estimate daily specific-conductance values from streamflow, instantaneous specific-conductance data and continuous daily streamflow data were input into a multi-parameter regression model (Cohn and others, 1992). The regression equation is shown below:
![]() (5)
(5)
where
ln is natural logarithm function;
SC is instantaneous specific-conductance value, in microsiemens per centimeter at 25°C;
βn are model coefficients;
Q is mean-daily streamflow, in cubic feet per second;
![]() is centered streamflow, in cubic feet per second;
is centered streamflow, in cubic feet per second;
sin is sine function; and
![]() is numerical constant approximated by the value 3.142857;
is numerical constant approximated by the value 3.142857;
T is time measured in years to two decimal points;
cos is cosine function;
ε is independent, random error.
The equation requires the estimation of five parameters:
β0 is a constant; β1 and β2
describe the relation between concentration and streamflow; β3
and β4 describe the seasonal variability in the measured
specific-conductance data. The error, denoted ε, is assumed to be
independent and normally distributed with zero mean and variance. ![]() is a "centering" variable that simplifies the numerical work and has no
effect on the estimates. Additional documentation for the regression equation
can be found in Cohn (2002). The coefficients for the 5-parameter regression
model are listed in table 3. Those coefficients shown in bold type were
determined to be significant in describing the concentration data. For
consistency among the five study sites, all coefficients are shown in
table 3 even if the coefficient was not significant (p-value>0.05)
in describing the concentration data.
is a "centering" variable that simplifies the numerical work and has no
effect on the estimates. Additional documentation for the regression equation
can be found in Cohn (2002). The coefficients for the 5-parameter regression
model are listed in table 3. Those coefficients shown in bold type were
determined to be significant in describing the concentration data. For
consistency among the five study sites, all coefficients are shown in
table 3 even if the coefficient was not significant (p-value>0.05)
in describing the concentration data.
Table 3. Regression-model coefficients for estimation of daily specific conductance from streamflow at selected sites on the Arkansas River and Fountain Creek.
[β0, constant; β1, coefficient
of the regression parameter ![]() ;
β2, coefficient of the regression parameter
;
β2, coefficient of the regression parameter ![]() ;
β3, coefficient of the regression parameter
;
β3, coefficient of the regression parameter ![]() ;
β4, coefficient of the regression parameter
;
β4, coefficient of the regression parameter ![]() ;
Q, streamflow in cubic feet per second; T, time in decimal years; s, standard
error of the regression; R2, fraction of variance explained
by the regression; coefficient values shown in bold type indicate significance
at a p-value <0.05]
;
Q, streamflow in cubic feet per second; T, time in decimal years; s, standard
error of the regression; R2, fraction of variance explained
by the regression; coefficient values shown in bold type indicate significance
at a p-value <0.05]
Site name |
β0 constant |
β1 |
β2 |
β3 |
β4 |
s |
R2 |
| Arkansas River at Portland | 5.8374 | -.4108 | -.0111 | -.0283 | .0144 | 0.150 | 79.9 |
| Arkansas River above Pueblo | 6.1987 | -.0752 | -.0229 | .1306 | .0705 | 0.154 | 49.8 |
| Arkansas River at Pueblo | 6.4501 | -.1295 | .0010 | .0870 | .0341 | 0.143 | 63.8 |
| Fountain Creek at Pueblo | 7.1449 | -.2107 | -.0190 | -.0072 | .0864 | 0.086 | 85.4 |
| Arkansas River near Avondale | 6.5576 | -.2419 | .0483 | .0529 | .1204 | 0.118 | 81.7 |
The specific conductance to streamflow regression equations in table 3 were used to predict daily specific-conductance values from measured daily streamflow at each study site for each Julian date of the background periods. Predicted daily specific-conductance values were converted to estimated dissolved-solids concentrations using the regression equations in table 2. This conversion was done in the same manner as was described in the section titled "Indictor Parameter" to estimate dissolved-solids concentrations from observed daily specific conductance. The predicted estimated dissolved-solids concentrations were subtracted from corresponding observed estimated daily dissolved-solids concentrations (computed from the observed specific-conductance values) resulting in residual dissolved-solids concentrations for each day. The residual concentrations were sorted by Julian date, and a tolerance limit was computed for each site by using techniques described in the section titled "Identification of Short-Term Changes in Water Quality Using Dissolved-Solids Concentrations and Loads."
Comparisons of the flow-adjusted tolerance limits to flow-adjusted data for 2002 are shown in figure 7. For the 2002 data, nearly all flow-adjusted concentrations at the sites Arkansas River at Portland and Arkansas River near Avondale were less than the tolerance limits; previous comparisons to nonadjusted concentrations at these two sites (fig. 6) showed numerous exceedances. These results illustrate the effects of using flow-adjusted concentrations to remove the variability associated with streamflow, particularly when the mixture of source waters did not change to a large extent such as was seen at the sites Arkansas River at Portland and Arkansas River near Avondale. The results of the two concentration analyses (nonadjusted and flow adjusted) illustrate an important point concerning the use of these methods to identify changes in water quality, that is, how many consecutive exceedances warrant eliciting changes in water management? Certainly a single exceedance would not warrant eliciting change in water management, but at what point are the number of exceedances considered to be excessive? For example, the board of the Southeastern Colorado Water Activities Enterprise, which represents various water-resource entities, decided that seven exceedances during any consecutive 10-day period would constitute a change in water quality (Robert Hamilton, Southeastern Colorado Water Activities Enterprise, oral commun., November 2003). This change would warrant additional investigation by the board to determine the likely cause(s) of the exceedances and the appropriate response measures needed.
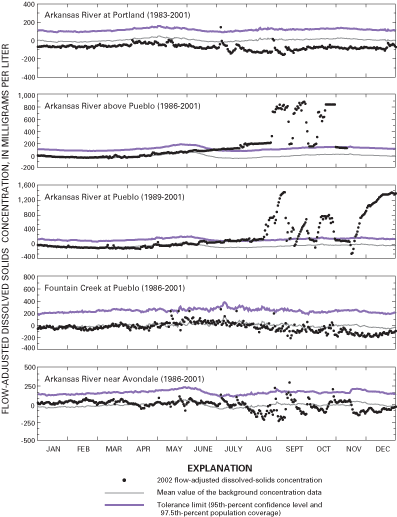
Figure 7. Tolerance limits on flow-adjusted dissolved-solids concentration data at selected sites on the Arkansas River and Fountain Creek with comparisons to flow-adjusted concentrations for 2002.
Numerous exceedances of the flow-adjusted tolerance limits were observed at the sites Arkansas River above Pueblo and Arkansas River at Pueblo during late summer and fall of 2002 (fig. 7). Although much of the variability associated with streamflow was removed by flow adjusting the concentrations, the results were similar to those observed using nonadjusted concentration data. The results indicated that the method was able to identify a change in the ratio of source waters at these sites under streamflow conditions somewhat less than 50 ft3/s; that is, the proportion of ground water or return flow increased substantially when reservoir releases ceased.
Although no exceedance of the flow-adjusted tolerance limit was observed at the site Fountain Creek at Pueblo, several intermittent values approached the limit. Most occurred when daily streamflow increased for a single day in response to localized storms. The timing of these occurrences could indicate that these data also represent a different mixture of source water than background conditions.
Tolerance Limits for Estimated Dissolved-Solids Load
Comparisons to tolerance limits derived from dissolved-solids concentration data, whether adjusted for flow or not, provide a way to help identify potential changes in water quality. The concept of dissolved-solids load, however, is not addressed by these approaches. Dissolved-solids loading is of great concern to many water users in the lower Arkansas River Basin particularly as it pertains to potential increases in soil salinity of irrigated lands. Daily load for the background period at each study site was estimated, and a tolerance limit was calculated as described in the section titled "Identification of Short-Term Changes in Water Quality Using Dissolved-Solids Concentrations and Loads." Daily loads (tons per day) were calculated as the product of estimated daily dissolved-solids concentration (milligrams per liter), mean daily streamflow (cubic feet per second), and a conversion factor of 0.002697. Daily variability in dissolved-solids load from early-September to early-April (base-flow conditions) at all five study sites was relatively small in comparison to the much larger variability observed during the spring and summer (fig. 8). Daily variability in dissolved-solids load increased in the spring and summer months as streamflow increased as a result of snowmelt runoff or thunderstorm activity. As such, the tolerance limit at each site was calculated by using two distinct standard deviations, which represented the variability between the low-flow period (September 3-April 10) and the high-flow period (April 11-September 2).
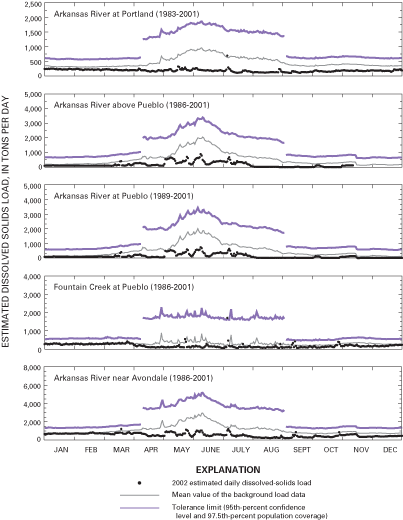
Figure 8. Tolerance limits on dissolved-solids load at selected sites on the Arkansas River and Fountain Creek.
Comparisons of daily loads for 2002 to tolerance limits did not show any exceedances because of the low streamflow observed in 2002. The daily load at the site Fountain Creek at Pueblo on July 6, 2002, however, did help illustrate the utility of using a tolerance limit on load. Streamflow on that day increased nearly 24 times from the previous day in response to a storm. Dissolved-solids concentration decreased as well, but to a lesser extent than would be expected for sustained summer streamflow at this level. The resulting load was nearly large enough to exceed the daily tolerance limit at the site Fountain Creek at Pueblo. This example showed that a load could approach the threshold if streamflow increased without a corresponding decrease in dissolved solids, again indicating water-quality changes occurred with respect to loading.
Identification of Long-Term Changes in Water Quality Using Dissolved-Solids Load
The use of dissolved-solids load to identify changes in water quality is not limited to comparisons using a tolerance limit. Other analysis techniques that use a mass-load approach could provide valuable information about long-term changes in the study area. The following sections of this report describe three other approaches that use estimates of dissolved-solids load to make long-term comparisons between sites in the study area. The focus of these approaches is on the primary sites--Arkansas River above Pueblo, Arkansas River near Avondale, and Fountain Creek at Pueblo (fig. 1). Dissolved-solids load at the site Arkansas River above Pueblo represents the mass in the main stem of the Arkansas River from Pueblo Reservoir downstream to the confluence with Fountain Creek. Dissolved-solids load at the site Fountain Creek at Pueblo represents the major tributary inflow to the Arkansas River in the study area. Load at the site Arkansas River near Avondale represents the approximate sum of these two upstream sites and any unmeasured mass. The majority of the unmeasured mass consists of several unmeasured inflows along the study reach. These analyses do not provide results for short-term decision making for implementing a water-quality management program but do provide an additional means of assessing long-term changes in water quality.
Comparison of Cumulative Load at Selected Sites
Daily dissolved-solids load was estimated for each primary site as described in the section "Tolerance Limits for Estimated Dissolved-Solids Load." Daily loads at each site were summed to provide a cumulative load for each site starting January 1, 1986, when all the sites had continuous water-quality monitors in place to measure specific conductance. A double-mass plot (fig. 9) of the cumulative loads for the sites Arkansas River above Pueblo and Fountain Creek at Pueblo compared to the cumulative load at the site Arkansas River near Avondale shows that the contribution of mass at the site Arkansas River near Avondale from the site Arkansas River above Pueblo became proportionately less beginning about 1993. Conversely, the mass contributed by the site Fountain Creek at Pueblo became increasingly larger after 1993; transmountain return-flow exchanges in Fountain Creek began in 1981 (Lewis, 1999). Although these double-mass curves do not provide immediate feedback, a marked change in the relation among the sites over several years are a useful tool for identifying changes in the source areas for dissolved solids.
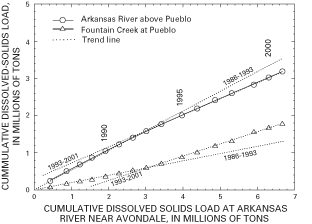
Figure 9. Comparison of cumulative dissolved-solids loads at Arkansas River above Pueblo and Fountain Creek at Pueblo to cumulative dissolved-solids load at Arkansas River near Avondale, 1986-2001.
Comparison of Percent Contribution of Load from Selected Sites
Daily dissolved-solids loads at the sites Arkansas River above Pueblo and Fountain Creek at Pueblo were compared to the daily load at the downstream site, Arkansas River near Avondale. The percent contribution of load from each site with respect to the downstream site was calculated on a daily basis (fig. 10). Local regression (LOWESS) smoothing of the daily calculated values showed that there was a general increase in the percent contribution from Fountain Creek (Fountain Creek at Pueblo) and a decrease in contribution from the Arkansas River downstream from Pueblo Reservoir (Arkansas River above Pueblo) from 1986 to 1996. LOWESS smoothing is a nonparametric smoothing technique that uses a running mean to predict values at each point (S-PLUS 2000 User's Guide, 1999). However, the percent contributions from the two sites have remained relatively unchanged since 1997 with an average of about 35 percent of the dissolved-solids load at the site Arkansas River near Avondale coming from each site.
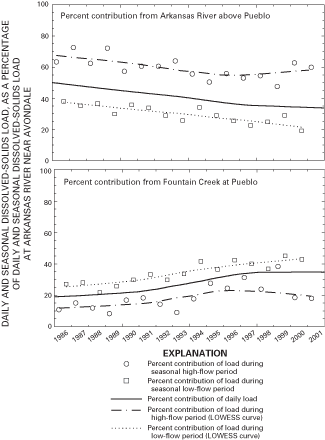
Figure 10. Percent contribution of dissolved-solids loads from Arkansas River above Pueblo and Fountain Creek at Pueblo to dissolved-solids load at Arkansas River near Avondale, 1986-2001.
Median seasonal loads for high-flow and low-flow periods for each calendar year also were computed (fig. 10). The high-flow period included those data from April 11 through September 2 of each year whereas the low-flow period included those data from September 3 through April 10. A comparison of the LOWESS smoothing lines showed the differences in contribution from the sites Arkansas River above Pueblo and Fountain Creek at Pueblo during each of the two seasonal periods. During high flow, the contribution of load from the site Fountain Creek at Pueblo generally was less than 20 percent because of the much larger load typically observed in the Arkansas River at this time; seasonal contributions from the site Fountain Creek at Pueblo ranged from 8 to 38 percent. Overall, an increasing trend in the contribution from the site Fountain Creek at Pueblo was observed from 1986 to 2001. Typically, the contribution from the Arkansas River during high flow ranged from 48 to 73 percent. During low flow, the contributions from the two upstream sites were similar. The site Fountain Creek at Pueblo contributed from 22 to 45 percent of the load, and the Arkansas River contributed from 19 to 38 percent. These analyses showed that changes in the contributions from the upstream sites are helpful in identifying long-term changes in source areas associated with changes in water quality.
Comparison of Unmeasured Load from Other Sites
The analysis described in the previous section showed that, on average, about 70 percent of the dissolved-solids load at the downstream site Arkansas River near Avondale can be associated with the sites Arkansas River above Pueblo and Fountain Creek at Pueblo. As such, the contribution from the unmeasured sources was about 30 percent for the entire period (fig. 11). This percentage, however, is somewhat higher during low-flow periods (September-March) when smaller loads are present in the river and contribution from inputs such as wastewater-treatment effluent, tributary inflows, and ground-water inflow is more pronounced. The percent contribution from these unmeasured sources decreases during high-flow periods (April-August). The most important unmeasured sources of dissolved-solids load to the Arkansas River have been identified, but insufficient daily data existed to make reliable estimates of the daily contribution. Potential important sources in the study area (fig. 1) are Wild Horse Creek, Pueblo Wastewater Treatment Plant, Salt Creek, St. Charles River, and ground-water inflow. Additional data-collection activities are needed to quantify these sources. This analysis identifies long-term changes in the overall percentage of unmeasured dissolved-solids load to the system.
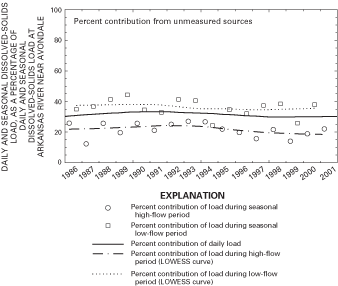
Figure 11. Percent contribution of dissolved-solids load from unmeasured sources to dissolved-solids load at Arkansas River near Avondale, 1986-2001.
Summary
Effective management of existing water-storage capacity in the Arkansas River Basin is anticipated to help satisfy the need for water in southeastern Colorado. A strategy to meet these needs has been developed, but implementation could affect the water quality of the Arkansas River and Fountain Creek in the vicinity of Pueblo. Because no known methods are available to determine what effects future changes in operations will have on water quality, the U.S. Geological Survey, in cooperation with the Southeastern Colorado Water Activity Enterprise, began a study in 2002 to develop methods that could identify if future water-quality conditions have changed significantly from background (preexisting) water-quality conditions. Specifically, this report: (1) designates daily background water-quality conditions at selected sites; (2) establishes the use of tolerance limits to identify statistically significant daily departures from these background conditions; and (3) presents other analysis techniques to help identify long-term changes in mass load. Additionally, these methods provide information that can be used by various water-resource agencies for an internet-based decision-support tool.
The primary study sites were Arkansas River above Pueblo, Fountain Creek at Pueblo, and Arkansas River near Avondale. Additional sites included Arkansas River at Portland and Arkansas River at Moffat Street at Pueblo. Dissolved solids (salinity) was chosen as the indicator parameter in this study because it is a good indicator of the general water quality in the study area and can be accurately estimated from available specific-conductance data. For the study, daily dissolved-solids concentrations at each site were calculated by developing a regression equation at each site from paired instantaneous specific-conductance and dissolved-solids data collected from 1979 through 2001, and applying the regression equation at each site to the mean daily specific conductance measured at each site to obtain an estimated or computed mean daily dissolved-solids concentration.
Daily and instantaneous specific-conductance data for the study sites were retrieved from the USGS NWIS database. The background periods included calendar years 1986-2001 for all three primary study sites, 1983-2001 for Arkansas River at Portland, and 1989-2001 for Arkansas River at Pueblo. In addition, daily streamflow data were retrieved for all sites.
Tolerance limits were computed by using background information about the means and the amount of variability in the data. A one-tailed tolerance limit (upper) was calculated. One value for the standard deviation was used in the calculation of an individual tolerance limit at each site on the Arkansas River because the variance in the daily concentrations was relatively constant at each of these sites. Two values for the standard deviations were used to compute tolerance limits at the site Fountain Creek at Pueblo because the daily variance showed substantial differences depending on the time of the year. Tolerance limits for dissolved-solids concentrations were calculated and compared to selected summary statistics for the background period for each site to determine if the methodology was reasonable. The methodology provided a tool with defined statistical probabilities associated with the various tolerance limits.
Dissolved-solids concentrations exceeded the tolerance limits at all four sites on the Arkansas River during the summer of 2002. These exceedances were particularly evident when streamflow from Pueblo Reservoir was reduced and return flows and ground-water influences to the river were more prevalent. Downstream from Pueblo, dissolved-solids concentrations in the river were diluted by Fountain Creek, which resulted in routine exceedances of the tolerance limit but to a lesser extent. No exceedances were observed at Fountain at Pueblo. Comparisons to the 2002 data illustrated the utility of using concentration data in the analysis and the need to adjust the concentration data to account for varying streamflow.
Background concentrations were flow adjusted to remove much of the variability due to streamflow. Comparisons to 2002 data showed that nearly all the flow-adjusted concentrations at the site Arkansas River near Avondale were less than the tolerance limit. The results illustrated the effects of using flow-adjusted concentrations. However, numerous exceedances of the flow-adjusted tolerance limits were observed at the sites Arkansas River above Pueblo and Arkansas River at Pueblo. These results were similar to the results observed using non-adjusted concentration data, which indicated that the method was able to identify a change in the ratio of source waters at these sites under streamflow conditions somewhat less than 50 ft3/s.
Daily dissolved-solids loads at each study site were estimated, and tolerance limits were calculated. Comparisons of daily load for 2002 to tolerance limits at each site did not show any exceedances, which was expected because of the low streamflow observed in 2002. However, it was shown that the calculated loads could approach the thresholds if streamflow increased without a corresponding decrease in dissolved-solids concentration.
Other analysis techniques using a mass-balance approach also can provide valuable information about long-term changes in the study area. A marked change in the cumulative mass load at two sites could help identify a change in the source areas for dissolved solids. Changes in the percent contribution of dissolved-solids load at the sites Arkansas River above Pueblo and Fountain Creek at Pueblo with respect to the site Arkansas River near Avondale also can prove helpful in identifying long-term changes in source areas. Similarly, changes in the unmeasured proportion of the mass load equation could signify changes in the source areas to the river. Additional data-collection activities are needed to quantify the sources of unmeasured load to the river.
References Cited
Batie, S.S., and Healy, R.G., 1983, The future of American agriculture: Scientific American, v. 248, no. 2, p 45-53.
Cain, Doug, 1987, Relations of specific conductance to streamflow and selected water-quality characteristics of the Arkansas River Basin, Colorado: U.S. Geological Survey Water-Resources Investigation Report 87-4041, 93 p.
Cohn, T.A., Caulder, D.L., Gilroy, E.J., Zynjuk, L.D., and Summers, R.M., 1992, The validity of a simple log-linear model for estimating fluvial constituent loads: An empirical study involving nutrient loads entering Chesapeake Bay: Water Resources Research, v. 28, no. 9, p. 2,353-2,364.
Cohn, T.A., 2002, ESTIMATOR 2002: A Beta release by Tim Cohn accessed December 12, 2002, at http://www159.pair.com/cohns/TimCohn/ TAC_Software/Estimator/e2002
Colorado Climate Center, 2002, Department of Atmospheric Science, Colorado State University, Fort Collins, Colorado, accessed May 24, 2003, at http://climate.atmos.colostate.edu/droughtqanda.shtml
Colorado Department of Public Health and Environment, 2001, Water Quality Control Commission Regulation No. 31, The basic standards and methodologies for surface water, accessed March 23, 2002 at http://www.cdphe.state.co.us/op/regs/waterregs/100231.pdf
GEI Consultants Inc., 2000, Southeastern Colorado Water and Storage Needs Assessment Enterprise: Preferred Storage Options Plan, Englewood, Colorado, 101 p.
Helsel, D.R., and Hirsch, R.M., 1992, Statistical Methods in Water Resources, Elsevier Science Publishing Company Inc., New York, New York.
Hem, J.D., 1985, Study and interpretation of the chemical characteristics of natural water: U.S. Geological Survey Water-Supply Paper 2254, 263 p.
Lewis, M.E., and Brendle, D.L., 1998, Relations of streamflow and specific conductance trends to the lower Arkansas River, Southeastern Colorado: U.S. Geological Survey Water-Resources Investigations Report 97-4239, 48 p.
Lewis, M.E., 1999, Simulated effects of water exchanges on streamflow and specific conductance in the Arkansas River upstream from Avondale, Colorado: U.S. Geological Survey Water-Resources Investigations Report 98-4140, 34 p.
Natrella, M.G., 1963, Experimental Statistics, NBS Handbook 91, National Bureau of Standards, Washington, D.C.
Ortiz, R.F., Lewis, M.E., and Radell, M.J., 1998, Water-quality assessment of the Arkansas River Basin, Southeastern Colorado, 1990-93: U.S. Geological Survey Water-Resources Investigations Report 97-4111, 69 p.
Pielke, Sr., R.A., Doesken, N., and Bliss, O., 2002, Climate of Colorado. Climatography Report #60, National Climatic Data Center, Asheville, NC. accessed June 4, 2003, at http://ccc.atmos.colostate.edu/pdfs/climateofcoloradoNo.60.pdf
PSOP Implementation Committee, 2001, Final Draft PSOP Implementation Committee Report, Southeastern Colorado Water Activity Enterprise, Pueblo, Colorado, 29 p.
Rickert, D.A., 1985, Compensation for discharge in detecting trends in water-quality data: U.S. Geological Survey, Branch of Water Quality, Memorandum 85.17.
S-PLUS 2000 User's Guide, 1999, Data Analysis Products Division, MathSoft, Seattle, Washington.
U.S. Environmental Protection Agency, 1992, Hazard Ranking System Guidance Manual, Office of Solid Waste and Emergency Response Directive 9345.1-07.
U.S. Geological Survey, 1975-2003, Water Resources Data for Colorado, water years 1974-2002-volume 1; U.S. Geological Survey Water-Data Reports CO-74-1 to CO-02-1 (published annually).
U.S. Department of the Interior
U.S. Geological Survey
Water Resources of Colorado
Contact: webmaster_co@usgs.gov
Privacy Statement |
Disclaimer | Accessibility
Last Modified:
June 30, 2004