
Scientific Investigations Report 2004–5031
Conceptual Models for Ground-Water Flow in the Menomonee Valley Brownfield
Application of Stepwise Modeling
Simulation of Ground-Water Flow
Figure 1. Location of Milwaukee County, the Menomonee Valley Brownfield stu...
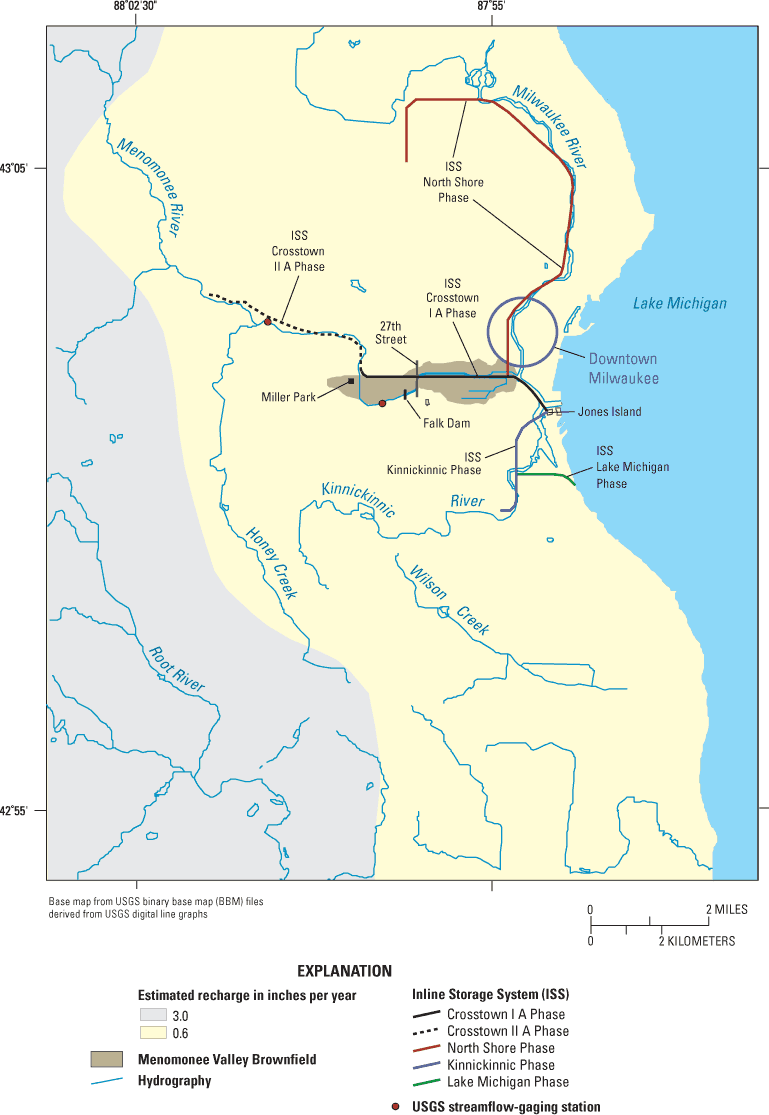
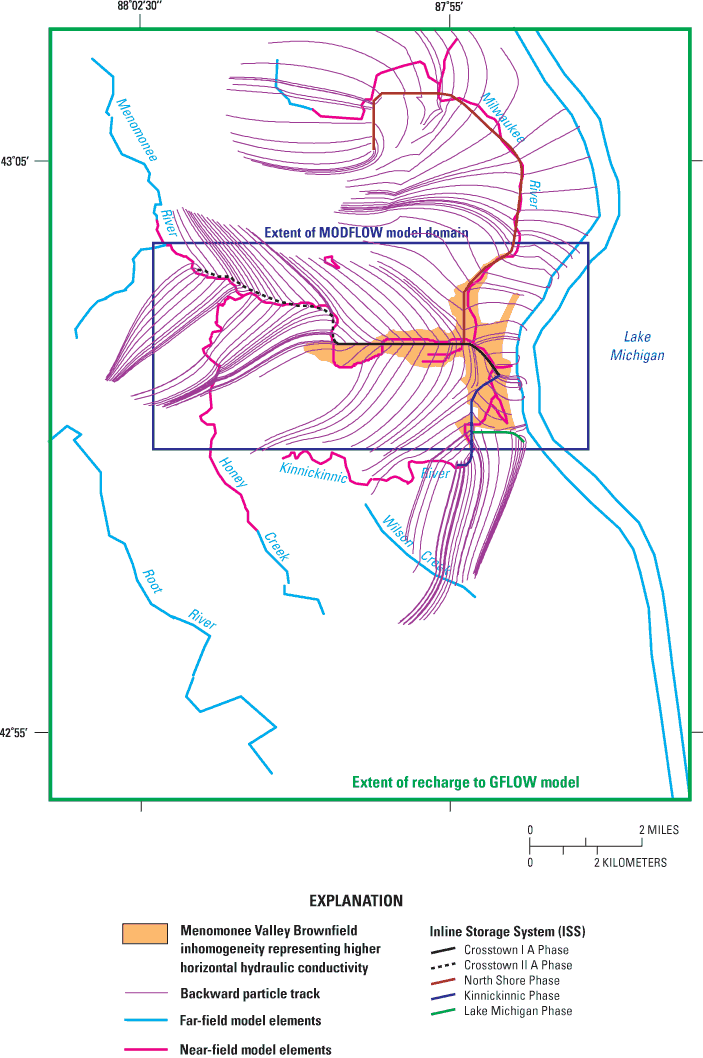
Figure 2. Location of downtown Milwaukee, surface-water features, the Inlin...
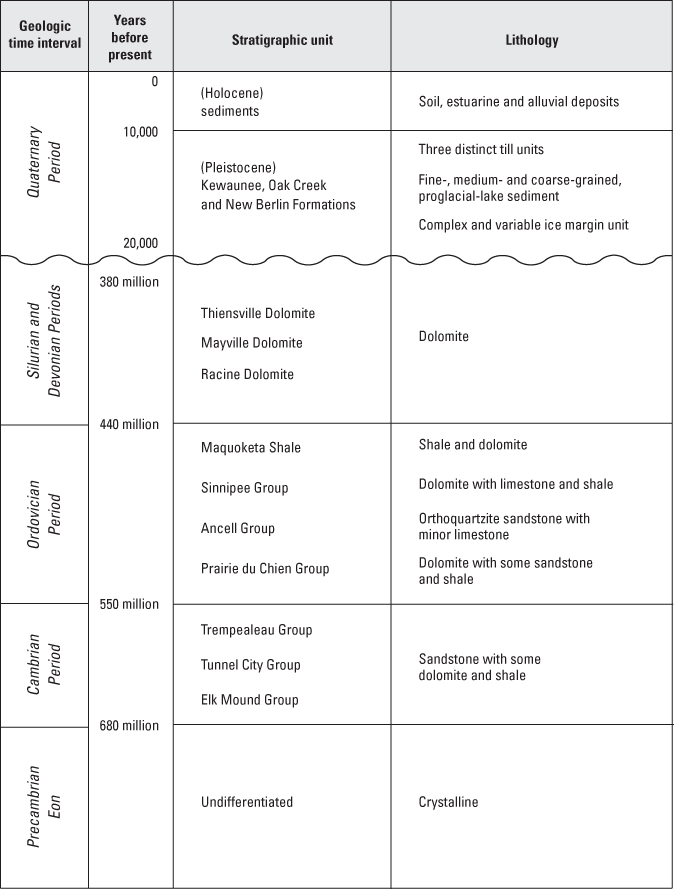
Figure 3. Stratigraphic section for the Menomonee Valley Brownfield study a...
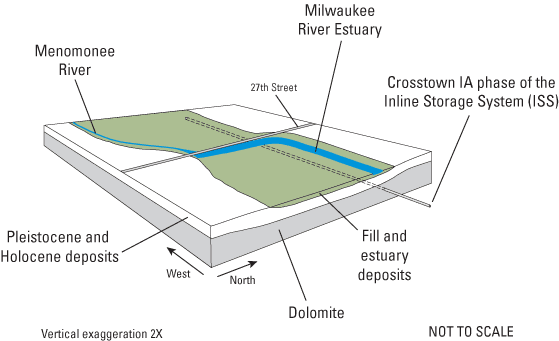
Figure 4. Block diagram of a part of the Menomonee Valley Brownfield study ...
Figure 5. End-members for a conceptual model of the Menomonee Valley Brownf...
Figure 6. Model domains in the Menomonee Valley Brownfield study area, Milw...
Figure 7. Schematic hydrostratigraphic section across the Menomonee Valley ...
Figure 8. MODFLOW section and layering, Menomonee Valley Brownfield study a...
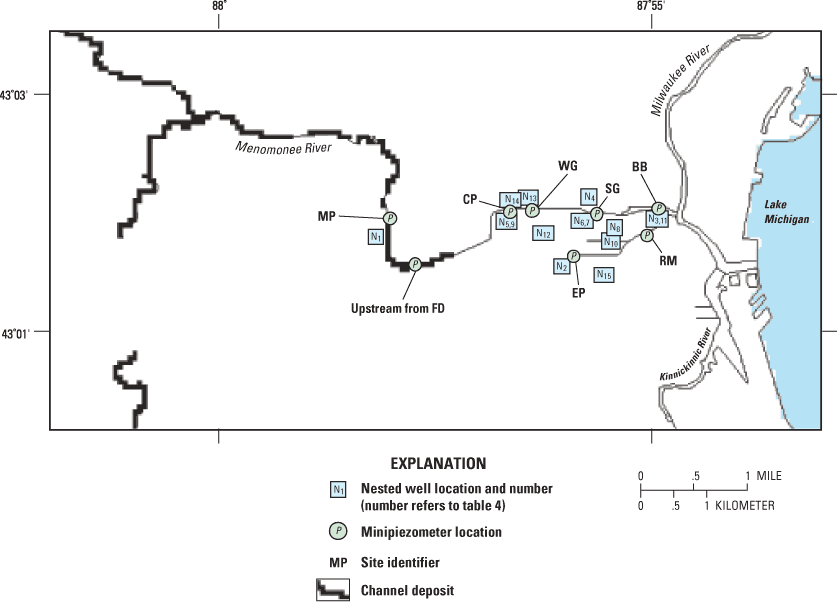
Figure 9. Locations of channel deposits, nested wells, and minipiezometers ...
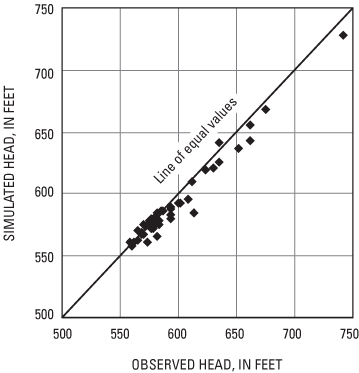
Figure 10a. Calibration plot of measured hydraulic heads plotted against MO...
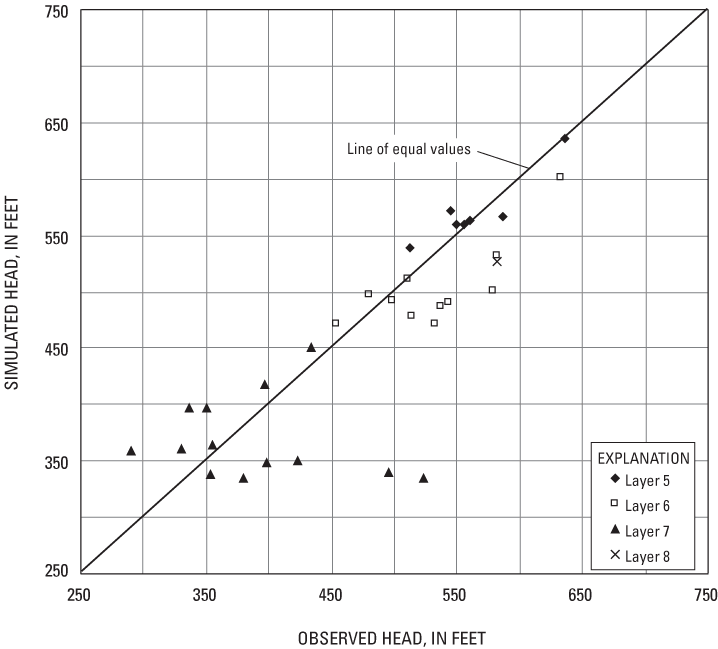
Figure 10b. Calibration plot of measured hydraulic heads plotted against MO...
Figure 11. Water-table surface in the Menomonee Valley Brownfield study are...
Figure 12. Backward particle tracking from the Inline Storage System in the...
Figure 13. Capture zones simulated with MODFLOW and MODPATH for the Inline...
Figure 14a. Sectional view (row 38) of ground-water-flow directions simulat...
Figure 14b. Sectional view (row 43) of ground-water-flow directions simulat...
Figure 14c. Sectional view (row 48) of ground-water-flow directions simulat...
Figure 15. Three-dimensional view generated by ModelViewer of ground-water ...
Figure 16. Traveltime to the Inline Storage System (ISS) in the Menomonee V...
Table 1. Sources of data for the construction and calibration of GFLOW and ...
Table 2. Hydraulic conductivities and effective porosities for calibrated G...
Table 3a. MODFLOW calibration statistics for wells in the unlithified sedim...
Table 3b. MODFLOW calibration statistics for wells in the dolomite of the ...
Table 4. MODFLOW vertical-gradient calibration for the Menomonee Valley Br...
Table 5. MODFLOW calibration to measured dry-weather infiltration to phase...
Table 6. Ranked sensitivities of the MODFLOW parameters in the Menomonee Va...
Table 7. Direction of vertical gradients between river (estuary) and ground...
Table 8. Statistics for simulated traveltime of recharge to surface-water ...
Appendix - Calibration targets, August 14, 2001
| Multiply | By | To obtain |
|---|---|---|
| Length | ||
| inch (in.) | 2.54 | centimeter (cm) |
| foot (ft) | 0.3048 | meter (m) |
| mile (mi) | 1.609 | kilometer (km) |
| Area | ||
| acre | 43,560 | square foot (ft2) |
| Discharge | ||
| cubic foot per day (ft3/d) | 28.32 | liter per day (L/d) |
| cubic foot per second (ft3/s) | 2,446,575.5 | liter per day (L/d) |
| Hydraulic conductivity* | ||
| foot per day (ft/d) | 0.3048 | meter per day (m/d) |
Temperature in degrees Celsius (°C) may be converted to degrees Fahrenheit (°F) as follows:
°F=(1.8x°C)+32
Vertical coordinate information is referenced to the National Geodetic Vertical Datum of 1929 (NGVD 1929).
*Hydraulic conductivity: The standard unit for hydraulic conductivity is cubic foot per day per square foot of aquifer cross-sectional area (ft3/d)/ ft2. In this report, the mathematically reduced form, feet per day (ft/d), is used for convenience.
Transmissivity: The standard unit for transmissivity is cubic foot per day per square foot times foot of aquifer thickness [(ft3/d)/ft2]ft. In this report, the mathematically reduced form, foot squared per day (ft2/d), is used for convenience.
Water year: Water year is the 12 month period from October 1 through September 30. The water year is designated by the calendar year in which it ends.
| Kg/d | kilograms per day |
| in/yr | inches per year |
Numerical models were constructed for simulation of ground-water flow in the Menomonee Valley Brownfield, in Milwaukee, Wisconsin. An understanding of ground-water flow is necessary to develop an efficient program to sample ground water for contaminants. Models were constructed in a stepwise fashion, beginning with a regional, single-layer, analytic-element model (GFLOW code) that provided boundary conditions for a local, eight layer, finite-difference model (MODFLOW code) centered on the Menomonee Valley Brownfield. The primary source of ground water to the models is recharge over the model domains; primary sinks for ground water within the models are surface-water features and the Milwaukee Metropolitan Sewerage District Inline Storage System (ISS). Calibration targets were hydraulic heads, surface-water fluxes, vertical gradients, and ground-water infiltration to the ISS. Simulation of ground-water flow by use of the MODFLOW model indicates that about 73 percent of recharge within the MODFLOW domain circulates to the ISS and 27 percent discharges to gaining surface-water bodies. In addition, infiltration to the ISS comes from the following sources: 36 percent from recharge within the model domain, 45 percent from lateral flow into the domain, 15 percent from Lake Michigan, and 4 percent from other surface-water bodies. Particle tracking reveals that the median traveltime from the recharge point to surface-water features is 8 years; the median time to the ISS is 255 years. The traveltimes to the ISS are least over the northern part of the valley, where dolomite is near the land surface. The distribution of traveltimes in the MODFLOW simulation is greatly influenced by the effective porosity values assigned to the various lithologies.
The City of Milwaukee, Wis. is actively promoting the revitalization of the Menomonee Valley Brownfield, a 1,500-acre industrial center, south and west of downtown (figs. 1 and 2). Of these 1,500 acres, 300 to 400 are currently abandoned or considered by the City to be underutilized. In 1998 the City of Milwaukee successfully applied to the U.S Environmental Protection Agency (USEPA), Region 5 for a Brownfields Assessment Demonstration Pilot Grant. The objective of the grant was to evaluate innovative methods of addressing ground-water contamination (real and perceived) within the Menomonee Valley Brownfield.
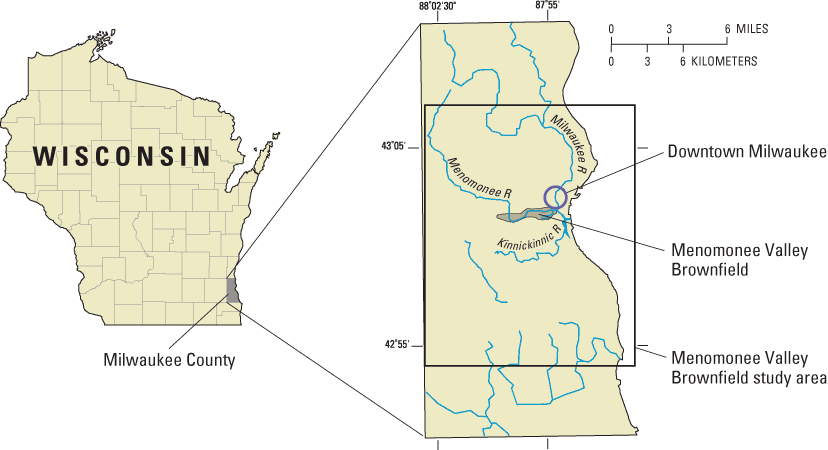
The Menomonee River Valley (from here on referred to as "the valley") is the natural, low-lying outlet of the Menomonee River as it flows to Lake Michigan. Prior to large-scale human settlement in the early 1800s, the valley was a ground-water-discharge area covered with marshes and tamarack swamps, and bordered by relatively steep bluffs on the north and south (Rodolfo Salcedo, Department of City Development, City of Milwaukee, written commun., 1998; SIGMA Environmental Services, Inc., 2002). The Menomonee River meandered eastward through the marshes of the valley to the shore of Lake Michigan. The development of Milwaukee as a major port and industrial center resulted in extensive changes to the natural topography of the valley. From 1835 to 1890, the bluffs bordering the valley were cut and graded. The material from the bluffs, as well as household and industrial wastes, were used to fill the marshes. Starting about 1865, the river channel within the valley was straightened and dredged, and canals and slips were constructed for navigation and port facilities. Today, the path of the river is controlled and the depth of the channel maintained over the eastern half of the valley. By 1900, the valley had become a regional coal distribution center, and for years, heavy industries operated in the area. These industries included foundries, power plants, coking and coal gasification plants, cement plants, junkyards, stockyards, tanneries, switching yards, engine repair shops, and chemical companies. Also common were various material storage piles, such as coal, clinker, sand, gravel, and salt. An extensive rail system, including a large rail yard, was built in the valley to support the movement of materials to and from the industrial sites. Industries in the valley became the major source of air and water pollution in Milwaukee. Valley industries once employed about 50,000 people, representing over 75 percent of the region's industrial employment base. Today, just over 7,000 people are employed at valley manufacturing firms. The relocation or demise of many of the valley's industries, and the establishment of newer industrial parks on Milwaukee's outskirts, have resulted in many vacant or underutilized properties within the valley (Rodolfo Salcedo, Department of City Development, City of Milwaukee, written commun., 1998; SIGMA Environmental Services, Inc., 2002).
Milwaukee, like a number of large metropolitan areas, has a combined-sewer system in which storm-sewer flow and sanitary-sewer flow are collected in the same pipe system. Historically in Milwaukee, if the capacity of the combined-sewer system was exceeded during a rain event, storm and sanitary overflow would be diverted to the Menomonee River or other surface-water body. The occurrence of overflows became more numerous as Milwaukee and surrounding areas grew. To address this problem, the Milwaukee Metropolitan Sewerage District (MMSD) constructed the Inline Storage System (ISS), also known as the Deep Tunnel. The ISS was constructed in the Silurian dolomite (fig. 3) between 1986 and 1994, and its purpose is to collect combined-sewer overflow during rainstorms and store it for later treatment. The ISS comprises 19.4 mi of tunnels constructed in phases: the Crosstown IA and IIA, the North Shore, the Kinnickinnic, and the Lake Michigan Phases (fig. 2). These tunnels are 17 or 32 ft in diameter and run west through the valley of the Menomonee River, north along the valley of the Milwaukee River, and south through the valley of the Kinnickinnic River (figs. 2 and 4). The Crosstown IA phase of the ISS (32 ft in diameter) underlies the Menomonee Valley Brownfield, at a depth of 200 to 300 ft.
Industrial contaminants such as organic solvents, petroleum byproducts, tars, and metal waste are found in the soil in the valley. These contaminants can be dissolved by precipitation and move with the recharge to ground water (SIGMA Environmental Services, Inc., 2002). A primary objective of this study was to determine in what proportion the fate of recharge to the valley is divided between a deep sink (the ISS) and shallow sinks (surface-water features). The fate of potentially contaminated ground water in different parts of the valley is of interest to regulators and developers because it influences decisions regarding the amount of monitoring and cleanup that is necessary before future development can go forward. An additional objective of this study was to estimate traveltimes from the points of recharge in the valley to the sinks. To accomplish these objectives, the U.S. Geological Survey (USGS), in cooperation with the City of Milwaukee and its consultants, and with support from USEPA Region 5, used numerical modeling to simulate shallow ground-water flow in the Menomonee Valley Brownfield. The results and interpretations of this study, as well as the modeling approaches developed, may be useful as a case study for similar combined-sewer systems.
The purpose of this report is to discuss the hydrogeology of the Menomonee Valley Brownfield and shallow aquifers, and present simulations of ground-water flow. The report includes a summary of selected hydrologic data; conceptualization of the hydrogeologic setting of the Menomonee Valley Brownfield and shallow aquifers; details on the modeling approach, model construction and calibration, and model limitations; and delineation of ground-water recharge areas for shallow and deep sinks. The traveltimes and paths for recharge to move from the surface of the Menomonee Valley Brownfield to sinks are also discussed.
An understanding of the hydrogeologic setting of the Menomonee Valley is integral to effective simulation of ground-water flow, surface-water flow, and the sewer tunnel system. Stratigraphy, recharge, the Inline Storage System, and surface- and ground-water flow systems are discussed in the following sections.
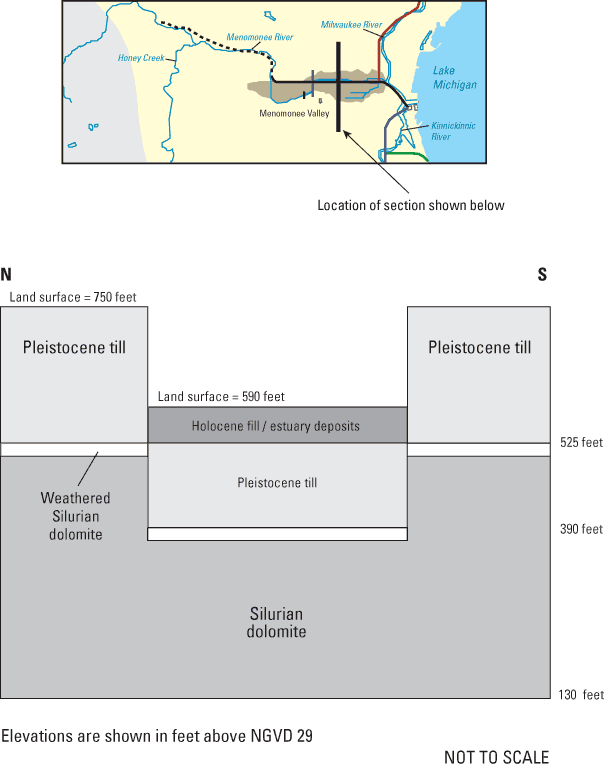
Stratigraphy. Crystalline bedrock, Precambrian in age, underlies southeastern Wisconsin and the Menomonee Valley (fig. 3). Sandstone and carbonate units of Cambrian and Ordovician age overlie the crystalline bedrock. These units consist of the Elk Mound Group, the Tunnel City Group, the Trempealeau Group, the Prairie du Chien Group, the Ancell Group, and the Sinnipee Group. Directly overlying the Sinnipee Group is the Maquoketa Shale, a layer with low hydraulic conductivity, that isolates strata above (Silurian and younger) from strata below (Ordovician and older). Silurian units underlying the Menomonee Valley Brownfield are the Racine and Mayville Dolomites; Devonian units are represented by isolated occurrences of the Thiensville Dolomite. The shallow stratigraphy of the valley consists of unlithified Pleistocene and Holocene deposits overlying dolomite bedrock (figs. 3 and 4).
In this study, the Menomonee River Valley is identified topographically as land surface below 600 ft elevation and is the present-day expression of a Silurian bedrock valley that has been partially filled and narrowed by Pleistocene glacial deposits. These deposits are predominantly fine-grained regional till units with some coarser-grained proglacial-lake and ice-margin deposits. Detailed Quaternary stratigraphic information for the valley is presented in Need (1983). During the Holocene, estuarine and alluvial sediments were deposited over the glacial sediments in the marshy backwater and shallow estuaries of the valley. The estuarine deposits are typically organic-rich to peaty, silty clay and clayey silt. The alluvial deposits originated as channel and point-bar sediments and range in texture from sandy silt to gravel. These estuary and alluvial deposits have a combined thickness of up to 30 ft; they terminate abruptly against the bluffs north and south of the valley, and thin and pinch out gradually to the west as the land surface rises out of the valley (Southeast Wisconsin Regional Planning Commission, 1976; Need, 1983; and SIGMA Environmental Services, Inc., 1999). The bluffs along the valley have been reduced in many areas, and natural and manmade fill have been added to large areas of the valley. Fill material consists of clay, silt, sand and gravel, and locally variable amounts of cinder, glass, wood, metal, rubble, brick, ash, and household-type trash. The combined thickness of the estuary/alluvial sediments and manmade fill materials can be as much as 60 ft (SIGMA Environmental Services, Inc., 1999).
Recharge. An upper bound to the rate of ground-water recharge for southeast Wisconsin is 8–10 in/yr, determined as the net discharge from surface- and ground-water sources in gaged streams (Gebert and others, 1989). Recharge commonly will vary spatially as a result of differences in watershed characteristics such as vegetation, urbanization, and evapotranspiration. Recent estimates of recharge rates in southeastern Wisconsin range from 0.0 to 4.0 in/yr over almost all of the Menomonee Valley Brownfield study area (Cherkauer, 2001). For this investigation, the estimated recharge values have been averaged and simplified to two zones, one of 3.0 in/yr and the other of 0.6 in/yr (fig. 2).
Hydrologic effects of the Inline Storage System. The ISS fills with overflow from the combined-sewer system (storm-sewer flow and sanitary-sewer flow) during rainstorms and stores it for later treatment and discharge to Lake Michigan. Between storms the ISS is effectively empty and is a regional sink for the ground-water system. Dry-weather infiltration of ground water to phases of the ISS was evaluated by MMSD in the early 1990s using dye tracers and other techniques (Camp Dresser and McKee, 1998). In early 2002, consultants for MMSD visually inspected the ISS to better distinguish dry-weather flow from other outfalls (RUST/Harza, April 2002). This investigation found the total dry-weather ground-water infiltration rate to the ISS to equal 4.3 ft3/s (2.8 million gallons per day). As part of the same investigation, hydrographs for 46 wells were studied for the years following completion of the ISS (after 1993) to evaluate the degree to which the ground-water system was adjusting to changing subsurface stresses. Most monitoring wells in the dolomite near the ISS showed modest to significant increases in head; fewer showed declines in head. Two dolomite wells more distant from the ISS show a modest upward trend. It is possible that some heads were increasing because post-construction grouting has reduced water discharges to the ISS.
Surface-Water-Flow System. Surface-water features of the Menomonee Valley Brownfield study area include Honey Creek; the Milwaukee, Menomonee, Root, and Kinnickinnic Rivers; the Milwaukee River Estuary; and Lake Michigan (fig. 2). The Milwaukee River Estuary is the name given to the Milwaukee, Menomonee, and Kinnickinnic Rivers once they reach the elevation of Lake Michigan. Downstream from this point, the stages of the rivers are controlled by the level of Lake Michigan. The Milwaukee and Kinnickinnic Rivers meet the estuary at the boundary of the valley itself, so gradients in stage are not appreciable within the valley. The Menomonee River, in contrast, has a gradient in stage from where it enters the brownfield near Miller Park to a point roughly at the site of the Falk Dam (fig. 2)—a river distance of about 1.5 mi. Above this point, the river stage is controlled by base flow, dry-weather outfalls to the river, and stormflow. Below this point, the stage of the water flowing through the valley is dominated by Lake Michigan water levels and occasional wind setup. Wind setup is the vertical rise of the stillwater level on the leeward side of a body of water due to wind blowing over the surface (Bates and Jackson, 1980). Data from 1860 to 1986 show the mean annual level for Lake Michigan is 580.11 ft above mean sea level. The maximum annual level was 582.57 and the minimum annual level was 576.95 (Quinn, 1988).
Ground-Water-Flow System. The three aquifer systems present in the Menomonee Valley Brownfield study area are:
The unlithified aquifer is composed of sediments with three different origins: tills, outwash, and proglacial-lake deposits of Pleistocene age; alluvial and estuarine deposits of Holocene age; and fill material added to the valley over the last century. The Holocene materials and the fill are considered to be hydrologically similar and are treated as a single unit in the model. The glacial and postglacial deposits are variable in thickness—from 0 to 200 ft in the Menomonee Valley Brownfield study area. The fill averages 10 to 20 ft thick, though it can be as much as 50 ft thick locally. Saturated thickness of the unlithified aquifer can be as much as 180 ft.
Published values of horizontal hydraulic conductivity (Kh) for till in and around the valley range over more than four orders of magnitude, from 0.0004 to 9 ft/d. Published Kh values for glacial outwash in and around the valley range over about three orders of magnitude, from 0.0016 to 1.6 ft/d (though clean sands and gravels are up to 1,400 ft/d). Published Kh values for the estuary, alluvial, and fill sediments range from 4.5 to 197 ft/d (Carlson, 2000). The geometric mean of a set of slug tests on wells open to these sediments within the valley is 3.8 ft/d (SIGMA Environmental Services, Inc., 2002, table 6.15). Reported values of vertical hydraulic conductivity (Kv) values for the till and estuary materials extend over a very large range (Carlson, 2000, Appendix C). Carlson (2000) recommended that, for modeling purposes, till in the study area should be given a Kh equal to 0.4 ft/d and a Kv equal to 0.003 ft/d.
The Silurian dolomite aquifer underlies the entire Menomonee River Watershed. The relatively impermeable Maquoketa Shale underlies this aquifer and unlithified glacial and postglacial deposits overlie it (fig. 3). Although the dolomite is generally of low permeability, secondary porosity (fractures and dissolution), particularly near the top of the unit, helps to make it a productive aquifer. Porosity is about 5 percent (Carlson, 2000). Published values of Kh for the dolomite range over four orders of magnitude, from 0.0001 to 2.2 ft/d; published values of Kv for the dolomite range over three orders of magnitude, from 0.00006 to 0.07 ft/d (Carlson, 2000). On the basis of literature review and modeling of the dolomite units, Carlson (2002) estimated a Kh of 5 ft/day and a Kv of 0.01 ft/d for the weathered upper dolomite in the study area covered by this study. The unweathered lower dolomite has a Kh between 0.3 and 1.2 ft/d and a Kv between 0.0005 and 0.001 ft/d (Douglas Carlson, U.S. Geological Survey, written commun., 2000).
The sandstone aquifer is composed of geologic units above crystalline bedrock and below the Ordovician Maquoketa Shale (fig. 3), which is a confining unit (Feinstein and others, 2002). Significant lowering of the potentiometric surface in the deep sandstone aquifer (declines of as much as 400 ft) as a result of municipal pumping has resulted in appreciable gradients across the Maquoketa Shale confining unit. Potentiometric heads many miles inland are below the level of Lake Michigan (Southeast Wisconsin Regional Planning Commission, 1976).
Because it is separated from the shallow Silurian dolomite aquifer by the Maquoketa Shale confining unit, the sandstone aquifer is not included in simulations of ground-water flow in this investigation.
Predevelopment ground-water flow in the valley was generally from surrounding highlands to the Menomonee River or Milwaukee River Estuary and ultimately to Lake Michigan (Southeast Wisconsin Regional Planning Commission, 1976). The current potentiometric surface within the Silurian dolomite aquifer is below the level of Lake Michigan in parts of the study area, particularly in an area centered on the Menomonee Valley Brownfield (Milwaukee Metropolitan Sewerage District, 1998; Plomb, 1989). This is primarily the effect of high-capacity wells that have pumped within the valley until recently. As a result of pumping, significant downward gradients have probably existed within the Menomonee Valley Brownfield for many years, from the estuarine, alluvial, and fill sediments to the underlying glacial sediments and Silurian dolomite (Southeast Wisconsin Regional Planning Commission, 1976; Camp Dresser and McKee, 1998). Although pumpage from the dolomite is currently much reduced from historical rates, the construction of the ISS has introduced an additional stress to the system. MMSD reports show that heads in monitoring wells in the dolomite near the ISS are appreciably lower than even the lowered potentiometric surface that resulted from a century of pumping (Camp Dresser and McKee, 1998). Strong downward gradients have been observed in piezometer nests installed in 1999 and 2000 by consultants to the City of Milwaukee (SIGMA Environmental Services, Inc., 2002). Recharge falling on the valley is subject to these vertical gradients, as well as to horizontal gradients driving water toward the river and estuary.
The authors acknowledge the contributions of the following organizations and people: Jane Neumann of U.S. Environmental Protection Agency (USEPA) Region 5, provided guidance for project objectives and implementation. Jeffery Gohlke and staff of the Department of City Development for the City of Milwaukee provided project input. Mafizul Islam, Kristin Kurzka and Jodi VanderVelden of SIGMA Environmental Services, Inc., furnished much of the data and information that supported the modeling effort, as well as coordinated and carried out the collection of additional field data. Peter McAvoy of Milwaukee's 16th Street Community Health Center provided general support and feedback on project activities. Kevin Shafer, Susan Anthony, and Timothy Bate of the Milwaukee Metropolitan Sewerage District provided copies of engineering and scientific studies and assisted in the exchange of information between their staff and consultants, and the USGS. Menomonee Valley Partners provided general support and feedback on project activities. Colleague reviews were done by Douglas Yeskis, USGS, and Douglas Carlson, Louisiana Geological Survey. Graphic and publication assistance were provided by Michelle Greenwood, Jennifer Bruce, and Susan Jones, USGS.
A conceptual model of the hydrologic system is a precursor to numerical model construction. In defining a conceptual model, many of the general characteristics of the Menomonee Valley Brownfield must be considered. In the conceptual model, the dolomite and unconsolidated sediments above the Maquoketa Shale are assumed to compose a single aquifer, although there are recognized variations in hydrologic properties of the individual units. Over the last century, the hydrology of the Menomonee Valley Brownfield has become much more complicated with the physical alterations to the estuary (channelization and filling), high-capacity wells producing from the Silurian dolomite, and the recent completion of the ISS. Downward vertical gradients have been present in the valley for many years. In addition, measured heads in minipiezometers installed at eight locations in river sediments (SIGMA Environmental Services, Inc., 2002) indicated that downward gradients were common across bottom sediments of the Menomonee River and Milwaukee River Estuary. Dry-weather infiltration of ground water into the ISS has been quantified, but whether its origin is local or distant is not certain. Given this background, the range of possible conceptual models for the Menomonee Valley Brownfield can be described by two end-members.
Conceptual model A. All recharge to the Menomonee Valley Brownfield flows ultimately to the Menomonee River, the Milwaukee River Estuary, or Lake Michigan (fig. 5a). In spite of measured downward vertical gradients, the dolomite presents a sufficient conductivity contrast to restrict flow from the valley through the dolomite into the ISS. Dry-weather inflow to ISS comes from distant sources.
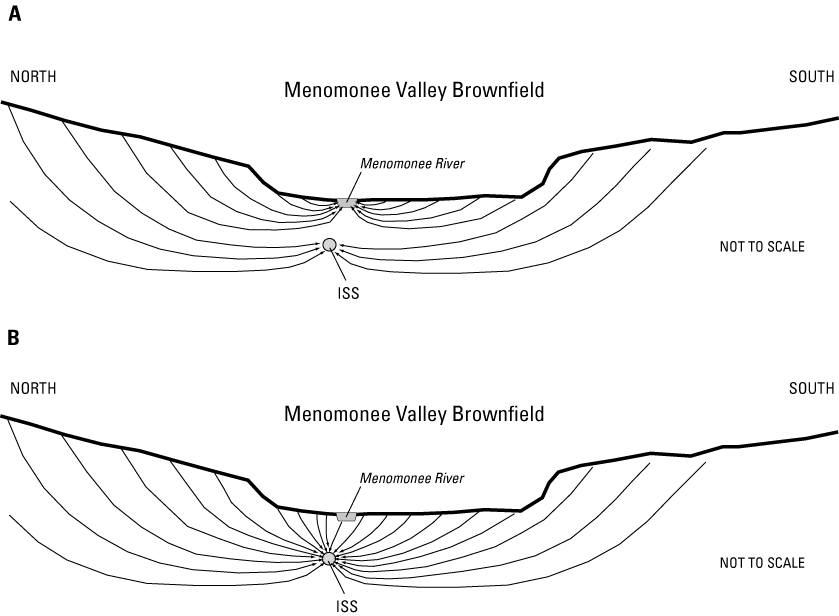
Conceptual model B. All recharge to the Menomonee Valley Brownfield flows ultimately to the ISS (fig. 5b). Vertical gradients are large enough and the conductivity contrast is small enough that the ISS is the sink that captures all the recharge to the Menomonee Valley Brownfield. All surface-water features, including Lake Michigan, contribute flow to the ISS.
The conceptual model that was the starting point for the modeling effort falls in between the described end-members. The ISS probably has an influence on ground-water flow but probably does not capture all the recharge. A primary objective of the study was to determine in what proportion recharge to the valley is divided between these two sinks—the ISS and surface water features.
For simplicity, it was assumed for this study that overall the system is at steady state, so both upward and downward trends in hydrographs of local wells are ignored. A rough calculation of storage contributions based on water-level changes, rock volumes, and expected storage parameters shows that the flux going into and out of storage is very small relative to reported dry-weather ISS infiltration. For conservative values of specific storage, dolomite volume, and rate of head change, the storage released is only 1 percent of dry-weather infiltration.
Numerical modeling was used to simulate ground-water flow in the Menomonee Valley Brownfield. Two different mathematical approaches, analytic element (AE) and finite difference (FD), were used in a stepwise fashion to improve the efficiency of the modeling effort. Data for model construction and calibration came from numerous sources (table 1).
| Data | Source |
|---|---|
| Geologic logs with stratigraphic contacts | Need (1983); D.T. Feinstein (USGS, oral commun., 2002) |
| Stage data for surface-water features | USGS topographic maps |
| Slug tests in unconsolidated valley sediments | SIGMA Environmental Services, Inc. (2002) |
| Compendium of hydraulic conductivities from slug/aquifer tests and models | Carlson (2000) |
| Inline Storage System (ISS) flux measurements | Rust/Harza (2002) |
| Recharge estimates based on empirical equation tied to base-flow separation in selected basins | Cherkauer (2001) |
| Water-level measurements in wells in unlithified deposits, including well nests measured during 2001 | SIGMA Environmental Services, Inc. (2002) |
| Water-level measurements in wells in dolomite, measured during 1994 | Camp Dresser and McKee (1998), Milwaukee Metropolitan Sewerage District (1998) |
| Minipiezometer data | SIGMA Environmental Services, Inc. (2002) |
As modeling tools have become more sophisticated, concerns have been raised with regard to the cost of model complexity, and informational benefits of increased model complexity (Bredehoeft and Hall, 1995; Hunt and Zheng, 1999). One suggested method to help ensure that the level of complexity is appropriate is to follow a stepwise modeling concept (Haitjema, 1995; Sun and others, 1998), whereby initial ground-water-flow models are relatively simple; that is, coarsely defined, and used in an exploratory fashion to help design data collection, test model assumptions, and provide boundary conditions for smaller-scale models.
In this study, the application of stepwise modeling involves the construction of a regional ground-water-flow model that is linked to a local inset model within its domain (Hunt and others, 1998). In this investigation of the Menomonee Valley Brownfield, the regional hydrology is simulated using a one-layer AE code based on Dupuit-Forchheimer assumptions (Haitjema, 1995), and the local model is simulated using a three-dimensional FD model with multiple layers. Flux boundary conditions for the FD model were initially extracted from the AE model. Both models employ the same conceptual framework and incorporate the same sinks, but the local model adds a complex vertical stratigraphy, pronounced vertical anisotropy, and stresses originating at different elevations corresponding to shallow and deep sinks. As the modeling effort progressed, insight gained from the FD model was applied to the AE model, and a new extraction of boundary conditions was used for a revised FD model. This process continued in stepwise fashion until the FD model included the necessary hydrogeologic detail in the valley and was calibrated.
Both AE and FD models simulate the contributing areas that supply recharge to each sink. The FD model is used to provide quantitative estimates relating to the fate of recharge on the valley and the traveltime to sinks. Thus, in this approach, the AE model is called on only to provide boundary conditions. Application of the stepwise approach to modeling ground-water flow in the Menomonee Valley is thoroughly discussed in Feinstein and others (2003).
The AE model was constructed to simulate the shallow aquifer (above the Maquoketa Shale confining unit) and its interaction with surface-water features. The software used in constructing the model for this study was GFLOW2000 (Haitjema, 2000). AE modeling methods have been extensively documented (Strack, 1989; Haitjema, 1995) and have been successfully used in hydrologic settings throughout Wisconsin (Hunt and Krohelski, 1996; Hunt and others, 1998; Krohelski and others, 2000; Hunt, Graczyk, and Rose, 2000; Hunt, Lin, and others, 2000).
The GFLOW2000 (GFLOW) model is a single-layer, steady-state model in which the aquifer is assumed to be infinite. The model uses the Dupuit-Forchheimer approximation by which a three-dimensional-flow problem is reduced to a two-dimensional, horizontal-flow problem. For this approximation to be appropriately applied, the length of a flowline must be large compared to the aquifer thickness. Within the Menomonee Valley Brownfield, the 460-ft thick shallow aquifer is about 3,000 ft wide north to south (across the valley) and about 18,000 ft long west to east (along the valley). Therefore, this aquifer is very thin relative to its horizontal extent, suggesting that ground-water flow in the valley is a horizontal-flow problem and can be appropriately evaluated by use of a Dupuit–Forchheimer approximation. This GFLOW model contains a conjunctive solution (Mitchell-Bruker and Haitjema, 1996) that considers the interaction of surface-water and ground-water flow. Because of the proximity of the rivers and estuary, the conjunctive solution is an important consideration for evaluating ground-water flow in the Menomonee Valley Brownfield.
Important hydrologic features (rivers, streams, and lakes) are represented in the GFLOW model domain as analytic elements or strings of analytic elements (line-sinks). Each element provides an analytic solution to the ground-water-flow equation, and the superposition of many individual solutions provides a solution for the ground-water-flow system. The model domain consists of both a far field and a near field (fig. 6). The far field is beyond the area of interest but is included in the model to define hydrologic boundary conditions for the near field. Far-field elements are constant-head boundaries, and near-field elements are head-dependent boundaries. Far-field elements are usually coarsely defined and consist only of water-level information that is estimated from USGS topographic data. The near-field is the area of primary interest and contains important local hydrologic inhomogeneities; that is, areas where recharge and (or) aquifer parameter values differ from regional values. A hydrologic inhomogeneity is represented in the GFLOW model by a closed set of elements, within which the nonregional parameter values are present. Near-field analytic elements are made to more closely match the geometry of surface-water features and therefore require more line-sink vertices and solutions. Solutions for near-field elements also require information on the width and resistance of the represented feature. Regional values for aquifer parameters and recharge rate are applied across the entire GFLOW model domain. Aquifer parameters for the single-layer AE model are based on a generalized hydrostratigraphic section of the shallow aquifer (fig. 7).
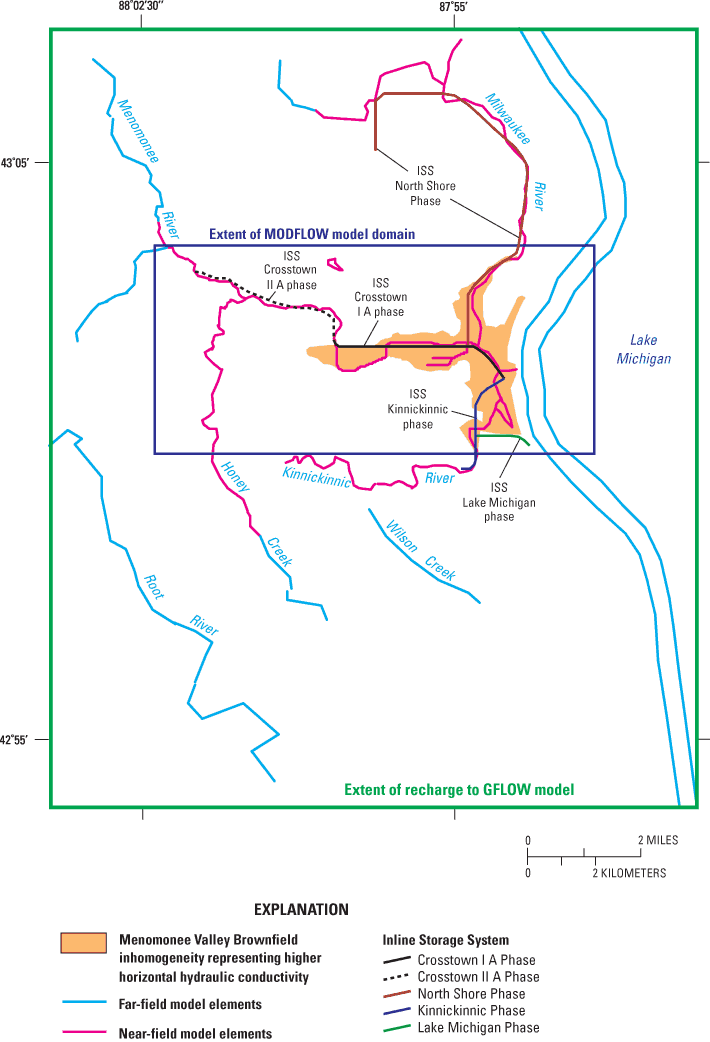
Figure 6. Model domains in the Menomonee Valley Brownfield study area, Milwaukee County, Wis.
The GFLOW model domain is not discretized into a grid; therefore, an exact solution for the flow equation can be calculated at any point in the domain. As a result, interpolation of heads or velocities is not necessary. Flow can also be examined at various scales without changing model input parameters or boundary conditions. This allows one GFLOW model to function at both a regional and a site scale without modification. GFLOW simulations are evaluated with respect to available composite head information and gaged streamflows. Finally, GFLOW is well suited as a regional model of the Menomonee Valley Brownfield because it allows the extraction of boundary conditions from a simulation directly into MODFLOW.
The FD model was constructed to simulate the shallow aquifer (above the Maquoketa Shale confining unit) and its interaction with surface-water features and the ISS. The FD model, developed with the use of the computer program MODFLOW 88 (McDonald and Harbaugh, 1988), is a multilayer model in which the aquifer is bounded by constant-flux boundaries extracted from the GFLOW model simulation. The multiple layers allow for vertical discretization representing hydrogeologic variation, as well as simulation of vertical gradients and flow.
Two particle-tracking programs were used to determine the flow paths of recharge as it moves from the water table to sinks, such as streams or the ISS. Both MODPATH (Pollock, 1994) and PATH3D (S.S. Papadopulos & Associates, 1991) are designed to work with MODFLOW model output and were used in this investigation. Output from MODFLOW simulations is used in MODPATH and PATH3D to compute paths for imaginary particles of water moving through the simulated ground-water system. In addition to computing particle paths, MODPATH and PATH3D keep track of the traveltime for particles moving through the system, making possible a wide range of analyses, such as delineating capture and recharge areas or drawing flow nets (Pollock, 1994). A USGS computer program called Model Viewer (Hsieh and Winston, 2002) was used to render three-dimensional views of simulated pathlines.
Three types of targets were used in model calibration: (1) hydraulic heads measured in wells completed in various stratigraphic intervals, (2) measured dry-weather infiltration (flux) into several phases of the ISS, and (3) measured vertical gradients in well nests within and outside the valley. The availability of infiltration targets from ISS measurements improves the ability of the model to distribute flow between the shallow surface-water system and the ISS. Moreover, because it is a flux target, dry-weather infiltration to the ISS helps overcome the problem of nonunique solutions associated with correlated parameters. In particular, joint consideration of head and flux data allows estimation of hydraulic conductivity values to be, at least in part, isolated from evaluation of recharge. Matching the third target set, vertical gradients, is particularly important in this setting because of the large vertical head loss beneath the valley. All the hydraulic heads measured in the unlithified sediments used as targets in the MODFLOW model calibration were measured on a single day during a dry period— August 14, 2001 (appendix). For these targets, the variability in heads that may be expected from seasonal recharge events, surface-water fluctuations, and stormflow in the ISS has been eliminated. Hydraulic head data reported during 1994 were compiled for 33 wells completed in the Silurian dolomite (appendix). Because these data were collected on different dates during 1994, any one measurement may have been affected by recharge events or stormflow in the ISS.
The MODFLOW calibration was a two-step process. In the first step, initial values for Kh and Kz were chosen on the basis of published values. In the second step, Kh values were adjusted through a sensitivity analysis restricted to head calibration targets only, whereas Kz values were adjusted through a calibration process using head targets, ISS dry-weather infiltration targets, and vertical gradient targets. The GFLOW model cannot be calibrated in this way because the solution represents composite heads over the thickness of the aquifer rather than the water-table surface, the ISS inflow is fixed rather than model output, and GFLOW does not simulate vertical gradients. For this reason GFLOW is evaluated by comparison of results to available composite head and streamflow information, which is a less complex evaluation than is used for the MODFLOW model.
Boundary conditions in a GFLOW model are applied at surface-water features. Because the solution to a GFLOW model assumes an infinite aquifer, the model domain should extend beyond ground-water and surface-water divides. The hydrologic boundaries used in this evaluation of the Menomonee Valley Brownfield are Lake Michigan; the Menomonee, Milwaukee, Kinnickinnic, and Root Rivers and their tributaries; and Honey Creek (fig. 6). The model domain (as defined by the GFLOW limits of recharge) covers about 195 mi2, including western areas of Lake Michigan.
The local domain covers about 26 mi2, which is appreciably smaller than the model domain. The local domain is defined by the extent of the MODFLOW model (fig. 6). The MODFLOW model consists of 87 rows and 185 columns; each cell is 250 ft on a side. The Menomonee Valley Brownfield, the primary area of interest, covers about 2.3 mi2. The MODFLOW grid is surrounded by specified-flux boundaries that were extracted from the GFLOW solution. Locations of surface-water bodies and the ISS are also shown in figure 6.
Average stages for hydrologic boundaries in the GFLOW model (rivers, canals, and lakes) were estimated from USGS 7.5-minute topographic maps. Near-field line-sinks incorporate riverbed resistance, which is locally determined as the thickness of the riverbed sediments divided by the vertical hydraulic conductivity of those sediments. Hydraulic conductivity of the aquifer consisted of a regional Kh outside the Menomonee Valley Brownfield and an inhomgeneity corresponding to the area with land-surface elevations of 600 ft or lower (fig. 6). The regional Kh, and that of the inhomogeneity, are determined by the saturated-thickness-weighted average of the horizontal hydraulic conductivities assigned to the various vertically layered units. The unit conductivities are listed in table 2, and the unit thicknesses correspond to the elevations in figure 7. The recharge zones in the model are shown in figure 2. The ISS is represented by a series of discharge-specified line-sinks that remove water at the dry-weather discharge rate reported for different phases of the ISS. Lake Michigan and the other far-field water bodies are constant-head boundaries in the far field of the GFLOW model. The near-field water bodies were specified in the model as head-dependent-flux boundaries with assigned elevations, resistances, and widths.
The GFLOW model was calibrated by manually adjusting line-sink resistances throughout the near field, and hydraulic conductivity in the inhomogeneity; regional recharge rates and the dry-weather infiltration to segments of the ISS were fixed on the basis of previous work (Cherkauer, 2001; Rust/Harza, 2002). However, in the course of calibration, model simulations indicated that estuary line-sinks were contributing an unrealistic amount of water to the ISS and that Lake Michigan was contributing negligible amounts. Field evidence shows the opposite to be true (Cherkauer and Carlson, 1997). Gradients over a part of the shoreline of Lake Michigan adjacent to Milwaukee reversed from upward to downward after ISS construction, whereas ISS exchange with the Milwaukee and Kinnickinnic Rivers is affected to only a small degree (Douglas Carlson, U.S. Geological Survey, written commun., 2000). To bring the model closer to observed conditions, fluxes out of the estuary were limited where the ISS lies directly underneath. Within the Menomonee Valley Brownfield, this zone corresponds to the area east of 27th Street in figures 2 and 4. Fluxes were limited by specifying a loss rate for the affected bodies. The selected flux rate for these reaches corresponds to a downward gradient of 1 ft/ft between the near-surface water table and the water level in the ISS and a vertical hydraulic conductivity of 0.001 ft/d for the intervening material. This vertical conductivity value represents an average of the till and dolomite vertical hydraulic conductivities used in cross-section models recently calibrated to local conditions (Carlson, 2000). The total specified flux from surface-water bodies overlying the ISS is 0.11 ft3/s, of which 0.10 ft3/s comes from surface water within the local domain. These rates are small compared to the 4.34 ft3/s gained by the entire ISS, of which 2.61 ft3/s discharges to the ISS within the local domain. To simulate the observed limited availability of water from the rivers and canals, these modifications increased the relative contribution of Lake Michigan to the ISS and increased the area over which recharge contributes to the ISS.
Because the unlithified and Silurian aquifers are simulated as one layer in the GFLOW model, composite heads are simulated between the water-table elevation (average altitude of about 590 ft) and the ground-water head in the dolomite (average altitude of about 295 ft). The gradient in the composite head field controls the movement of water from the far field to the near field of the model and from sources of water (such as recharge and Lake Michigan) to sinks of water (such as the ISS and some surface-water bodies). The data available against which to match the simulated composite heads are limited to one location in the Menomonee Valley Brownfield adjacent to the estuary. A well completed in dolomite at the elevation of the ISS, but 492 ft to the south, showed a head equal to 518 ft in August 2001. A well open to till less than 984 ft from the dolomite well but about 213 ft above the ISS, showed a head equal to 564 ft for that date. The head produced by GFLOW should be some composite of these two values close to the average of 544 ft. The simulated head at the location is 541 ft.
A second way to evaluate the GFLOW model, particularly the suitability of the recharge zones, is through flux data. The base flow to the Menomonee River along the section between the two USGS streamflow-gaging stations shown in figure 2 can be estimated for pre-ISS conditions by use of flow-duration curves constructed from concurrent data collected in the early 1980s. The calculation yields a value of base flow for this section equal to 1.0 ft3/s. This estimate agrees well with the base flow of 0.78 ft3/s simulated by the GFLOW model for pre-ISS conditions.
In many respects, the MODFLOW model duplicates the input to the GFLOW model. Both models are steady-state representations of the flow system. The total volumetric rate of recharge entering the MODFLOW model domain is the same as the total volumetric rate of recharge that enters the corresponding area in the GFLOW model. The outline of the Menomonee Valley Brownfield Kh zone is the same for both models, and the Kh values assigned each of the units are also the same (table 2). The average thickness of units in the MODFLOW model corresponds to the thicknesses used to calculate the composite hydraulic conductivities in GFLOW. Lake Michigan is treated as a constant-head boundary in both models. The two models differ, however, with respect to how they simulate vertical flow, how near-river sediments are characterized, how recharge is zoned, and how boundary conditions are set.
| Unit | Horizontal hydraulic conductivity,1 feet per day | Vertical effective hydraulic conductivity,2 feet per day | Porosity3 |
|---|---|---|---|
| Fill/Estuary | 4.0 | 0.0010 | 0.2 |
| Channel4 | 10.0 | .1000 | .2 |
| Till | .4 | .0010 | .1 |
| Weathered dolomite | 5.0 | .0050 | .05 |
| Dolomite | .65 | .0004 | .01 |
1 Horizontal hydraulic conductivities used in both GFLOW and MODFLOW models.
2 Vertical hydraulic conductivities calibrated to MODFLOW solution.
3 Effective porosities used to calculate traveltimes with MODFLOW and PATH3D.
4 Channel deposits only represented in MODFLOW model.
5 Dolomite horizontal hydraulic conductivity is zoned in MODFLOW model.
Although GFLOW supports some three-dimensional flow features (for example, it allows flow under the estuary to the ISS), it does not explicitly account for differences in resistance to vertical flow within the shallow deposits and the dolomite units. The MODFLOW model incorporates the full flow system by dividing the hydrostratigraphic units between eight layers, and by varying the thickness of the layers on the basis of data from geologic logs on file at the Wisconsin Geologic and Natural History Survey (Daniel Feinstein, USGS, oral commun., 2002). The configuration of the units along an east-west section that intersect the valley is shown in figure 8. The vertical hydraulic conductivities assigned to the fill/estuary, till, weathered dolomite, and dolomite units after calibration are included in table 2.
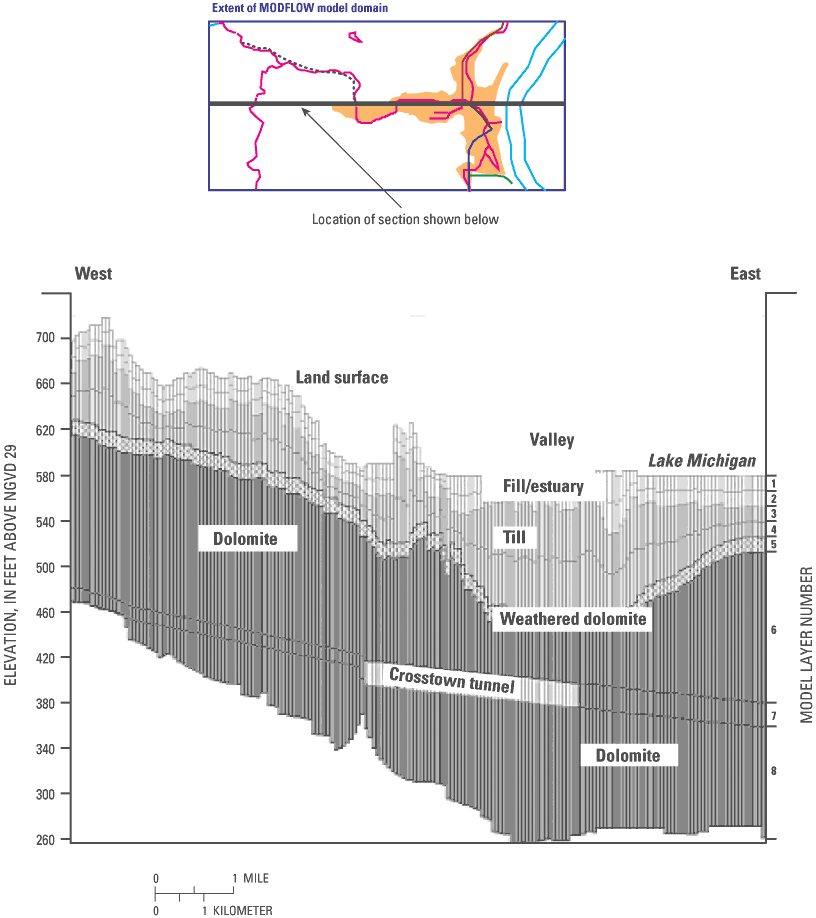
The MODFLOW input contains a zone of high Kv and Kh in layers 1 and 2 corresponding to coarse channel deposits that are likely to be associated with the free-flowing reaches of the rivers (upstream from the Milwaukee River Estuary) in the model (fig. 9). The introduction of this zone was necessary to reproduce the measured vertical gradient in the only well nest in the free-flowing reach of the Menomonee River. The channel deposits are not represented in the GFLOW model.
All phases of the ISS represented in the MODFLOW domain are in layer 7. The ISS is represented as a series of drains (a head-dependent-flux boundary that removes water from the model) to facilitate comparison of simulated infiltration to reported values. In other words, ISS dry-weather infiltration is used as a flux calibration target. The conductance of the drains represents the resistance to flow through the grouted circumference of the ISS. Conductances are based on an assumed grout hydraulic conductivity equal to 0.0004 ft/d (the same value assumed for the vertical hydraulic conductivity of the dolomite) and a grout thickness of 1.0 ft.
MMSD measured the dry-weather infiltration to each phase of the ISS (Rust/Harza, 2002). For purposes of model calibration, this information has been translated into target flux estimates for the western part of the Crosstown IIA phase (0.47 ft3/s), for the Crosstown IA phase (1.16 ft3/s), and for the parts of the Northshore, Kinnickinnic, and Lake Michigan phases included in the MODFLOW model (0.54, 0.31, and 0.16 ft3/s, respectively).
Specified fluxes are assigned to all perimeter nodes of the MODFLOW grid, except for the last column of the grid because it intersects constant-head nodes associated with Lake Michigan. The fluxes for a given MODFLOW boundary node are equal to the comprehensive flux extracted from GFLOW for the width of the row or column location and are distributed between the eight MODFLOW model layers according to their relative transmissivity. The remaining boundary conditions in the MODFLOW model are head-dependent conditions assigned to surface-water nodes and the ISS drains. The resistance of the riverbed material is set to 1 ft/(ft/day). This resistance corresponds to a riverbed of sand that is 5 ft thick, with hydraulic conductivity equal to 5 ft/d.
Calibration of the MODFLOW model depends on the match between measured and simulated heads, between the measured and simulated vertical gradient at well nests, and between the measured and simulated dry-weather infiltration for all or part of the five phases of the ISS.
Measurements of water levels on August 14, 2001, provided head targets at 101 wells open to unlithified sediments, of which 79 represented water-table conditions and the others corresponded to depths averaging about 33 ft below the water table. Water levels are also available from 1994 for 33 wells drilled in the dolomite, most of which are close to the ISS (appendix).
The data set from wells drilled in the unlithified sediments includes measurements at 12 nested well locations (fig. 9). The measured vertical gradient was downward at all but the westernmost nest location. The average downward gradient was equal to 0.09 ft/ft between the water table and the fill/estuary horizon at the mid-elevation in model layer 2; it was equal to 0.28 ft/ft between the water table and the till horizon at the mid-elevation in model layer 3. The increasing vertical gradient with depth reflects some combination of drainage to the ISS and the distribution of vertical hydraulic conductivities. Calibration results for the simulation that best matched the three sets of targets are shown in figures 10a, and 10b and tables 3a, 3b, 4, and 5. The agreement between the observed and simulated heads is not as close for the wells in bedrock as it is for the wells in unlithified sediments (tables 3a and 3b, and figures 10a and 10b). For the wells in unlithified sediments, the agreement is close not only with respect to the trend of the water-table surface but also with respect to the measured vertical gradients between the estuary and underlying till deposits (table 4).
[Residual = observed – simulated; ft, feet]
| Total number of wells | 101 |
| wells in layer 1 | 79 |
| wells in layer 2 | 8 |
| wells in layer 3 | 12 |
| wells in layer 4 | 1 |
| wells in layer 5 | 1 |
| Residual mean | 2.25 ft |
| Absolute residual mean | 3.63 ft |
| Residual standard deviation | 5.63 ft |
| Most negative residual | -7.84 ft |
| Most positive residual | 29.03 ft |
| Number of negative residuals | 43 |
| Number of positive residuals | 58 |
| Number of residuals within +/- 2 ft | 53 |
[Residual = observed – simulated; ft, feet]
| Total number of wells | 33 |
| wells in layer 5 | 6 |
| wells in layer 6 | 11 |
| wells in layer 7 | 15 |
| wells in layer 8 | 1 |
| Residual mean | 23.2 ft |
| Absolute residual mean | 44.9 ft |
| Residual standard deviation | 58.0 ft |
| Most negative residual | -69.0. ft |
| Most positive residual | 188.1 ft |
| Number of negative residuals | 15 |
| Number of positive residuals | 18 |
| Number of residuals within +/- 2 ft | 15 |
[Negative values indicate upward gradient]
| Well nest1 | Measured gradient | Simulated gradient | ||
|---|---|---|---|---|
| 1. Water table-Estuary | -0.043 | -0.028 | ||
| 2. Water table-Till | .03 | .18 | ||
| 3. Water table-Estuary | .06 | .23 | ||
| 4. Water table-Till | .07 | .35 | ||
| 5. Water table-Estuary | .12 | .15 | ||
| 6. Water table-Estuary | .22 | .27 | ||
| 7. Water table-Till | .27 | .24 | ||
| 8. Water table-Till | .27 | .16 | ||
| 9. Water table-Till | .28 | .19 | ||
| 10. Water table-Till | .28 | .23 | ||
| 11. Water table-Till | .30 | .24 | ||
| 12. Water table-Till | .30 | .12 | ||
| 13. Water table-Till | .36 | .32 | ||
| 14. Water table-Till | .41 | .31 | ||
| 15. Water table-Till | .58 | .51 | ||
| Averages: | ||||
| Overall | .23 | .23 | ||
| Water table-Estuary | .09 | .16 | ||
| Water table-Till | .28 | .26 | ||
1 Well nest is located by number in figure 9.
[ft3/s, cubic feet per second]
| Inline Storage System phase | Measured infiltration1 ft3/s | Simulated infiltration ft3/s |
|---|---|---|
| Crosstown IIA | 0.46 | 0.60 |
| Crosstown IA | 1.16 | .97 |
| Northshore | .54 | .53 |
| Kinnickinnic | .31 | .37 |
| Lake Michigan | .16 | .26 |
| Total within local MODFLOW model | 2.63 | 2.73 |
1 Rust/Harza, 2002, Internal inspection of the Inline Storage System; report prepared for the Milwaukee Metropolitan Sewerage District.
The quality of the fit to wells drilled in bedrock is affected by at least three factors. First, bedrock head measurements are not synchronous with other targets used in model calibration.
Second, although many of the wells drilled in bedrock are completed within a few feet of the deep tunnel, the model simulates water levels at an appreciably greater distance from the tunnel because model cells are 250 ft wide. Third, the ISS is not grouted everywhere, so gradients into the tunnel are variable from place to place. Given the difficulty in matching local conditions around the tunnel, the model was more closely calibrated to the estimated dry-weather infiltration into the five phases of the ISS (table 5) than to the adjacent ground-water levels. Because the tunnel infiltration is an integrated measure of the response of the ground-water system to the stress imposed by segments of the ISS, it is less affected by variations in local conditions.
The match between measured and simulated targets is reasonably close across the range of targets, and the overall calibration is considered acceptable. The calibrated horizontal hydraulic conductivities and recharge rate in the MODFLOW model are unchanged from those in the GFLOW simulation that provided the specified-flux conditions to the MODFLOW perimeter boundary. The head calibration is very sensitive to recharge and the distribution of vertical hydraulic conductivity (tables 1 and 6). Measured gradients between surface water and ground water provide a check on the model calibration. Streamflow-gaging stations paired with minipiezometers inserted just below the riverbed yield the direction and magnitude of the hydraulic gradient connecting surface water to ground water at the locations shown in figure 9. The estuary and estuary canal locations were sampled seven times between June 2001 and September 2001. The two upstream locations were sampled in spring and summer 2000. The direction of the gradient over the measurement periods is shown in table 7. Upward gradients imply discharge of ground water to surface water. Downward gradients imply discharge of surface water to ground water. The model simulation matched the observed upward flow in the upstream locations and the generally downward flow in the estuary locations.
[Head calibration is most sensitive to first-listed parameter (Recharge) and least sensitive to the last-listed parameter (Kh of the estuary deposits); Kh, horizontal hydraulic conductivity; Kg, hydraulic conductivity of grout; Kv, vertical hydraulic conductivity; ISS, Inline Storage System]
| Recharge | ||
| Kh | Weathered dolomite | |
| Kg | Crosstown IA phase of the ISS | |
| Kh | Inline Storage System dolomite | |
| Kg | Northshore, Lake Michigan, and Kinnickinnic phases of the ISS | |
| Kv | Till | |
| Kh | Till | |
| Kh | Mayville Dolomite | |
| Kh | Racine Dolomite | |
| Kv | Racine Dolomite | |
| Kg | Crosstown IIA phase of the ISS | |
| Kv | Mayville Dolomite | |
| Kv | Estuary deposits | |
| Kv | ISS dolomite | |
| Kv | Weathered dolomite | |
| Kh | Estuary deposits | |
[Minipiezometer locations are shown on figure 9; Falk Dam site is about one- half mile upstream from the dam; gradient was observed only one day at the Falk Dam site; at all other sites, gradient was observed on seven dates between June 2001 and September 2001]
| Site | Observed direction | Simulated direction |
|---|---|---|
| Miller Park (MP) | Up | Up |
| Falk Dam (FD) | Up | Up |
| Central Repair (CP) | Down | Down |
| Wisconsin Gas (WG) | Down | Down |
| SIGMA (SG) | Variable | Down |
| Bridges and buildings (BB) | Down | Down |
| Emmpak (EP) | Down | Down |
| RACM (formerly Crabby Al's) (RM) | Variable | Down |
No attempt was made during the calibration process to match the magnitude of the observed hydraulic gradients. Seiche in the estuary (oscillation of water level initiated chiefly by local changes in atmospheric pressure, aided by winds and tidal currents [Bates and Jackson,1980]) causes the river and canal levels to change significantly over a short time, with a corresponding effect on the measured gradient at a given streamflow-gaging station. In addition, the variability in the deposits constituting the riverbed (sand in some places, industrial fill in others) means that matching even average observed gradients would require changing the hydraulic conductivity of the riverbed over several orders of magnitude from one monitored location to another without knowing what values to assign between these locations.
This gap in our knowledge of the system, however, does not affect the reliability of the model. A sensitivity analysis on riverbed hydraulic conductivity (in which it was varied everywhere from its base value of 5 ft/d—corresponding to a sand—to values as low as 0.005 ft/d—corresponding to a silt) demonstrated that the model calibration and model results are almost completely insensitive to the value selected. The match to water levels, to vertical gradients, and to tunnel inflow is largely unaffected. Model findings (for example, the simulated areas of contribution for the deep tunnel and the surface water) are nearly identical over the entire range of riverbed values. The reason for this insensitivity is that decreases in riverbed hydraulic conductivity are linked to corresponding increases in the simulated hydraulic gradient, so the model simulates the same direction and approximately the same magnitude of flow between the ground water and surface water throughout the model over the tested range. This insensitivity to riverbed hydraulic conductivity has been noted in other studies (an example is given in Hunt, 2000).
The value assigned riverbed hydraulic conductivity in the model has little influence on the simulated flow lines connecting Menomonee Valley Brownfield recharge to discharge locations. However, if this model were to be applied at a finer scale to better understand the exchange of ground water with surface water over time at a specific location, it would be necessary to collect sufficient data to reproduce the cyclic changes in estuary stage and to map the local variations in riverbed hydraulic conductivity.
Simulation of hydrology in this complex urban environment unavoidably involves a number of uncertainties over and above the values assigned to model parameters.
Assumed impermeability of Maquoketa Shale. An appreciable downward gradient exists across the Maquoketa Shale as a result of ongoing pumping from the underlying sandstone aquifer. In addition, the construction of some deep wells (abandoned and active) may provide a conduit across the Maquoketa Shale confining unit. As a result it is possible that the model underestimates the total recharge to the water table by the amount that moves downward from the shallow to deep aquifer systems. However, the downward leakage is known to be very small below the study area (Feinstein and others, 2004), while the downward flow across multiple aquifer wells is assumed to be a minor component of total recharge.
Bias in shallow (unlithified) hydraulic head data. The primary calibration data set for the model consists of heads measured on a single day (August 14, 2001) in wells open to the shallow (unlithified) sediments. A synoptic data set such as this is preferable to data collected over many dates under potentially very different hydrologic conditions; however, it is not known how representative these synoptic measurements are of long-term average heads. It is known that these heads generally fall between heads measured in the same wells for the only other two available measurement dates—one in the spring (June 2000) when the water table was relatively high and one in the winter (December 1999) when the water table was relatively low. Thus, the August data represent intermediate conditions across the three available measurement periods.
Bias in deep (dolomite) hydraulic head data. The calibration data set for deep wells drilled in bedrock is much less reliable than the data set for the shallow wells. These heads correspond to different dates of measurement in 1994 (rather than to a single measurement date in 2001 as in wells drilled in unlithified sediments). Water-level conditions from that time are likely different than those in 2001 because the hydrologic system is not in steady state. In addition, many of the deep wells drilled in bedrock are very close to the ISS (as little as 10 ft distant), so the water levels represent conditions just outside the tunnel rather than at the middle of the 250-ft by 250-ft model cell that encompasses the tunnel. For these reasons, the set of calibration targets in the dolomite bedrock serves at best as only a qualitative check on the ability of the model to approximate deep hydraulic conditions.
Uncertainty in vertical gradient targets. The presence of strong vertical gradients requires calibration to heads in different layers of the model. However, vertical discretization of the model and necessary interpolation of target heads at the center of screened intervals to the center elevation of model layers introduces additional uncertainty.
MMSD estimate of ISS dry-weather infiltration. Uncertainty will always be associated with estimates of dry-weather infiltration, although the most recent evaluation (Rust/Harza, 2002) was designed specifically to quantify dry-weather infiltration and is believed to be an improvement over earlier estimates. Dry-weather infiltration has likely changed over time and for this reason corresponds to changing head. In this connection, it is noteworthy that the recent infiltration estimates made in early 2002 are close in time to the calibration-target water levels collected in the unlithified sediments in late 2001 but are significantly separated in time from the set of calibration targets collected in 1994 for wells completed in the dolomite.
MODFLOW cell size in the valley. The 16,095 model cells are uniformly 250 by 250 ft. This level of discretization does not allow incorporation of the myriad manmade features of the industrial Menomonee Valley that will influence local gradients and flow.
Linking of GFLOW and MODFLOW models. These models are parallel in that the average transmissivity of the MODFLOW model is the same as the spatially constant transmissivity assigned to the GFLOW model. Similarly, the average recharge to the MODFLOW model is identical to the spatially constant recharge to the GFLOW model. These parallels notwithstanding, the boundary conditions provided by GFLOW are subject to some error. The greatest source of error is that the distance from the major stress induced by the ISS to the local model boundary is less than the desired minimum of 3 times the characteristic leakage length, lambda (λ). Lambda is calculated by means of the following equation:
(1)

where
λ is the characteristic leakage length (L),
K is horizontal hydraulic conductivity of the aquifer (LT-1),
H is the thickness of the aquifer (L), and
c is resistance, the ratio of confining unit thickness (d) to its vertical hydraulic conductivity (K),

In calculating λ, average aquifer transmissivity was assumed to be 500 ft2/d, and vertical resistance through the glacial material and dolomite was equated to that used in the MODFLOW model (average 400 ft thickness divided by Kv=0.004 ft/d, yielding 100,000 days). The resulting λ value is 7,100 ft. To minimize runtime, the MODFLOW grid was made fairly small. The 2-mi distance that separates the ISS in the valley from the north and south edges of the local model area is only 1.5 times the calculated λ. It follows that the stress from the ISS near the bottom of the section produces some vertical flow components at the boundary that are not reflected in the fluxes extracted from the GFLOW model. The vertical-flow effect decreases exponentially with distance from the ISS. Application of the exponential factor [1-e-x/λ], where x/λ is set equal to 1.5, indicates that about 78 percent of the vertical-flow component has disappeared at the MODFLOW boundary. (Haitjema and others, 2001, equation 4). Sensitivity analyses show that changes in the vertical distribution of the constant flux at the MODFLOW model boundary have virtually no effect on the simulated flow system within the Menomonee Valley Brownfield.
Because the MODFLOW model derives the lateral flow into its grid from GFLOW, that it receives the same quantity of water as recharge as does the GFLOW model, and that the strength of the ISS sink is identical in both representations, it is expected that the overall capture zone simulated by the two models should be similar. In fact, as demonstrated in the following section of the report, capture zones for the ISS simulated by GFLOW and MODFLOW are very close in shape and extent.
MODFLOW results are reported in more detail than GFLOW results because MODFLOW provides more accurate estimates for traveltimes from source to sink, which are useful for consideration of natural attenuation of contaminants. Experience in this study also showed that although GFLOW was dequate to simulate capture zones for flow systems dominated by two-dimensional flow, a full three-dimensional analysis was needed to more rigorously predict the effect of the ISS on the base flow to overlying streams.
Vertical distribution of flux to the MODFLOW model. From the standpoint of mass balance, the GFLOW model should supply the proper amount of water across each part of the extracted MODFLOW model boundaries (for the given model inputs) to allow recharge and the surface water to supply the ISS. What is at issue is the vertical distribution of flux at each lateral boundary and the assumption that the constant flux from the GFLOW solution divides proportionally to the transmissivity of the MODFLOW layers. To evaluate the effect of distributing the flux in this way, several sensitivity runs were done in which the flux was distributed differently. In the first run, all the flux simulated by GFLOW was assigned only to the MODFLOW dolomite layers; in the second run, all the flux was assigned to the top weathered dolomite layer; and in the third run, all the flux was assigned to the glacial material across layers 1 through 4. In each case, the simulated ISS infiltration and head calibration statistics agreed closely with the original run. The ISS infiltration for the sensitivity runs ranges from 2.60 to 2.75 ft3/s, with the base value equal to 2.73 ft3/s. The absolute residual mean of the head calibration targets for the sensitivity runs ranges from 3.35 to 3.51 ft, with the base value equal to 3.48 ft. These small differences indicate that the distribution of the boundary flux has little effect on model results.
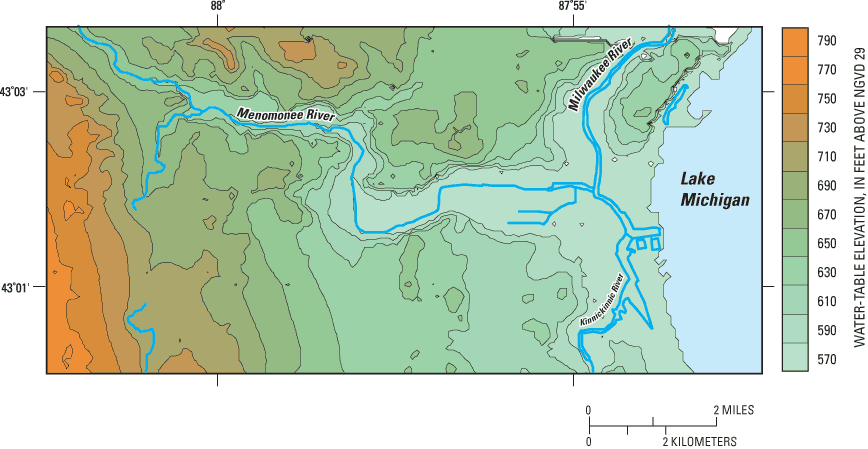
The calibrated MODFLOW model was used to simulate shallow ground-water flow in the Menomonee Valley Brownfield study area, to address questions about sources and sinks for ground water, and to estimate traveltimes from the points of recharge in the valley to sinks. The simulated water table within the MODFLOW local domain ranges in altitude from about 570 to 800 ft (fig. 11). Water-table altitudes are around 570 ft in the Menomonee Valley Brownfield and rise quickly to the north, west, and south. The highest water-table altitudes are in the southwest corner of the MODFLOW domain.
At the regional scale, the GFLOW model simulated capture areas for particles flowing from the water table outside the Menomonee Valley Brownfield to the ISS. The simulated traveltime for these particles is as much as 600 years (fig. 12). In defining these capture areas, the assumed composite effective porosity for the till and dolomite is 0.05. Particle-tracking routines MODPATH (Pollock, 1994) and PATH3D (S.S. Papadopulos & Associates, 1991) were applied to the MODFLOW results to determine what part of recharge to the local domain flows downward to the ISS and what part circulates back upward to surface-water bodies. The capture pattern for the local domain is shown in figure 13.

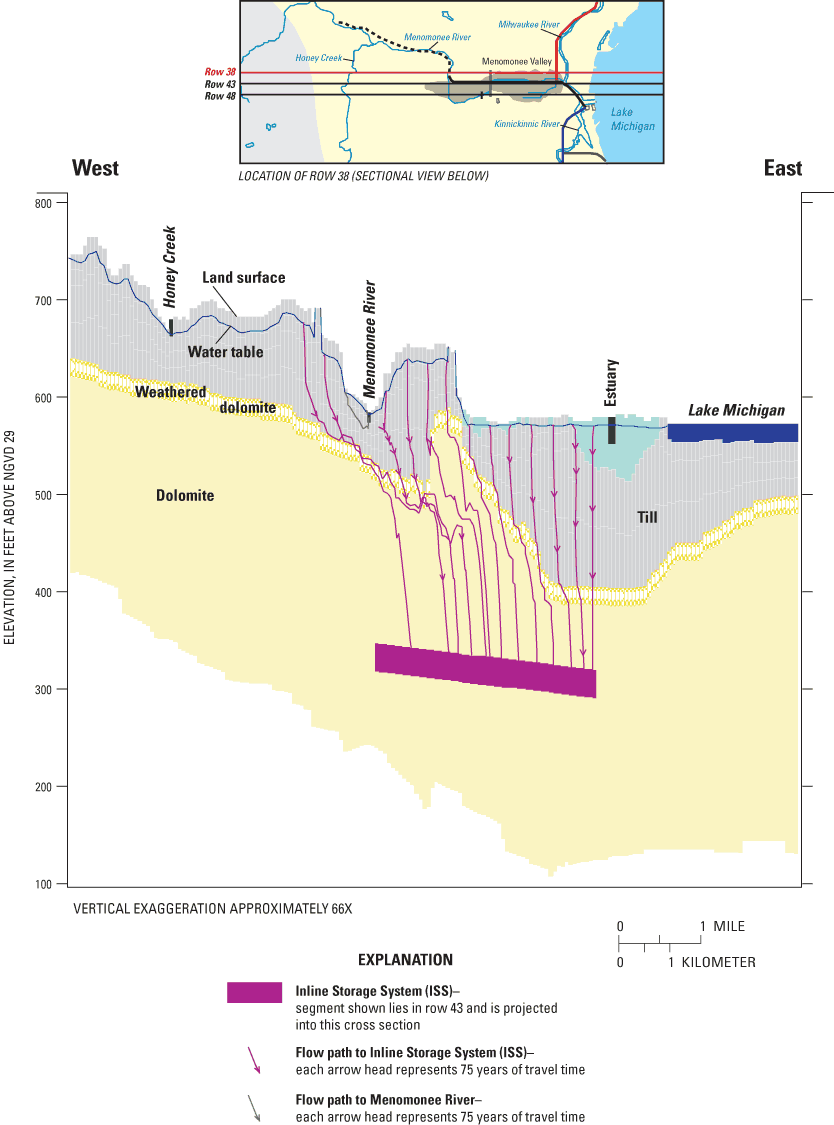
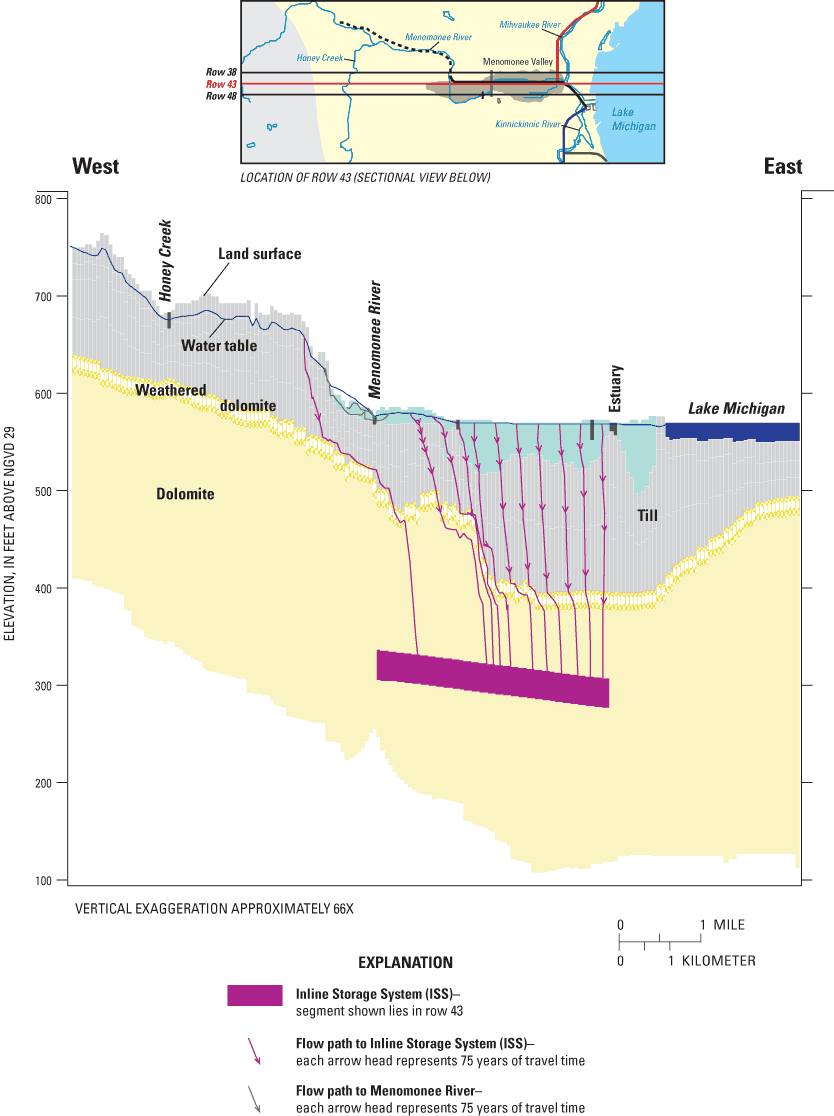
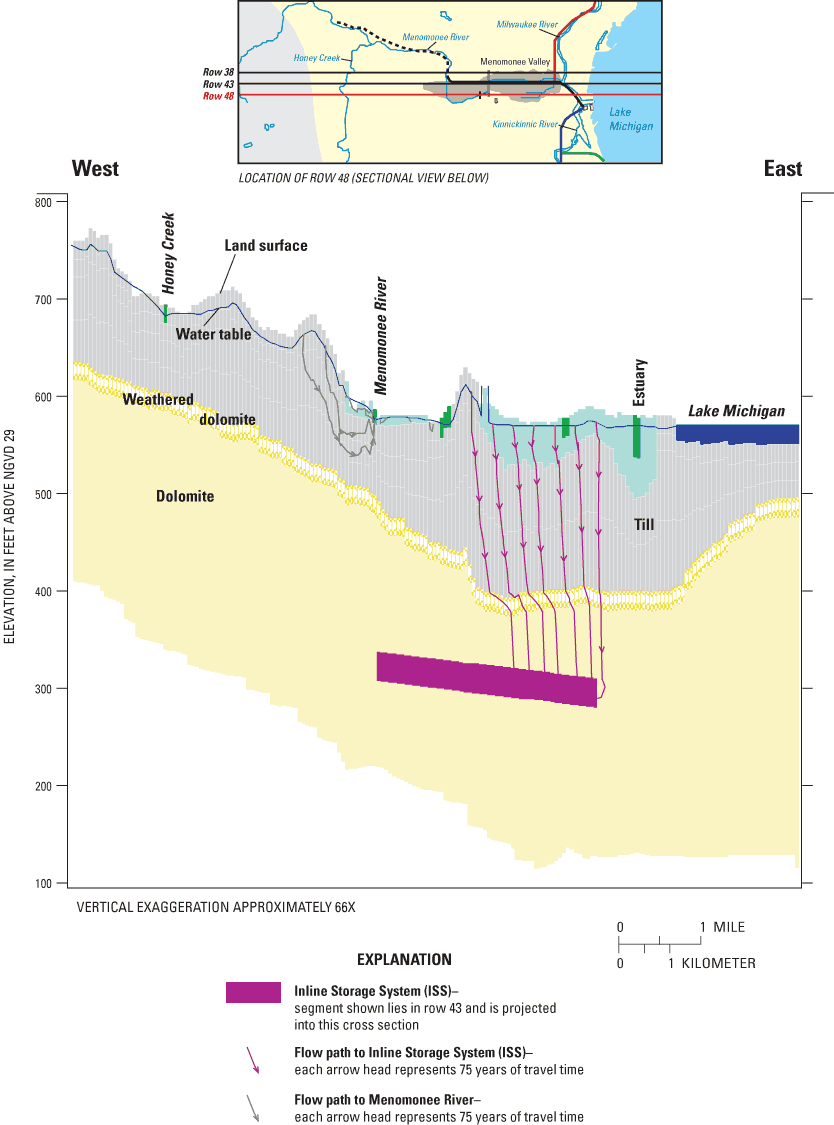
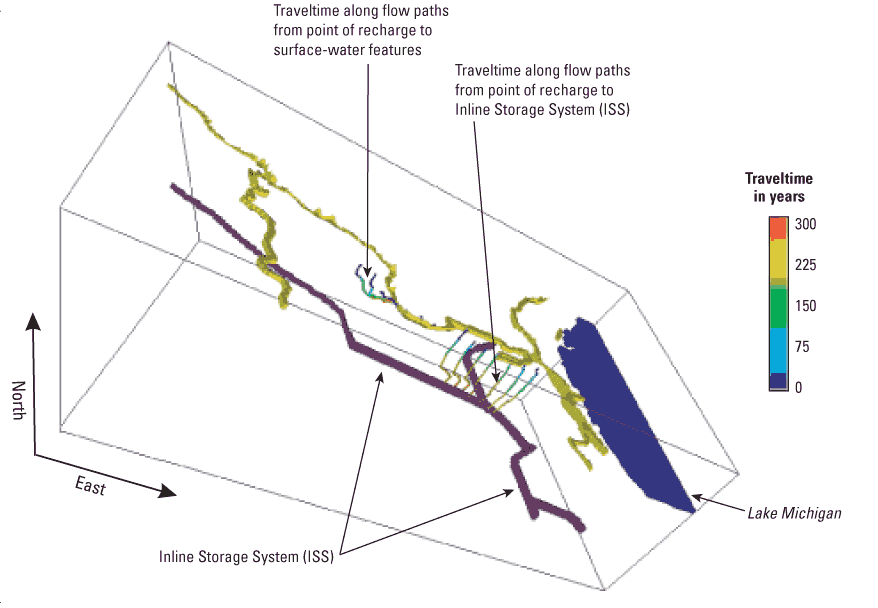
Within the local MODFLOW domain, the comparison of the total simulated infiltration to the ISS (2.74 ft3/s) and total available recharge (1.36 ft3/s for the assumed recharge rate equal to 0.6 in/yr) demonstrates that the ISS is the major sink for ground water and that it captures much water that would otherwise discharge as base flow to streams. In addition to local recharge, sources for infiltration to the ISS include lateral flow into the model (originating largely as recharge outside the MODFLOW domain), flow from Lake Michigan, and losses from rivers and canals. The MODFLOW model provides the following sources of infiltration to the ISS as percentages: 36 percent from recharge within the model domain, 45 percent from lateral flow into the domain, 15 percent from Lake Michigan, and 4 percent from other surface-water bodies. About 73 percent of recharge within the MODFLOW domain (excluding the area occupied by surface-water nodes) discharges to the ISS, and 27 percent discharges to gaining surface-water bodies. This suggests that the conceptual model that best fits the Menomonee Valley Brownfield is one intermediate to the end-members discussed earlier (fig. 5). The simulated flux from losing surface-water bodies overlying the ISS is 0.11 ft3/s, which compares well with the corresponding GFLOW rate specified at 0.10 ft3/s and therefore increases confidence in the stepwise approach. Three east-west sections are presented that illustrate the flowpaths of recharge to the MODFLOW model domain (fig. 14a, b, and c). A three-dimensional representation that illustrates simulated flow paths from selected areas of the Menomonee Valley Brownfield is shown in figure 15.
The patterns of discharge to surface sinks and the ISS simulated by the MODFLOW model are distinguished by the traveltimes involved. For the assumed values of effective porosity assigned different units (table 2), it is possible to calculate the range of traveltimes for recharge to the valley to circulate back to the surface and for recharge to the valley to discharge to the ISS (table 8).
[Traveltime and range in years]
| Surface-water sinks | Inline Storage System | |
|---|---|---|
| Average traveltime | 30 | 230 |
| Median traveltime | 8 | 255 |
| Range (90 percent of traveltimes fall within range) | 1–99 | 34–355 |
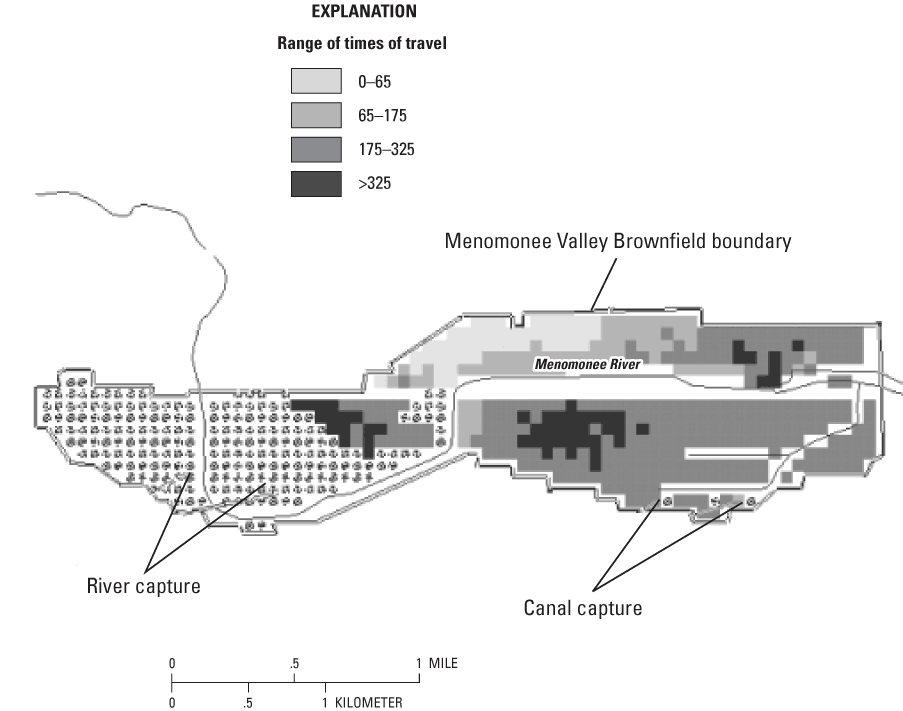
The median traveltime to surface water is 8 years; the median time to the ISS is 255 years. The distribution of traveltimes to the ISS based on the assumed effective porosities (table 2) is shown in figure 16. The traveltime from a given location is largely dictated by the length of flowpath in the unlithified deposits (where higher porosities result in slower velocities) as opposed to the fractured dolomite. The traveltimes to the ISS are least over the northern part of the valley where the dolomite is near the land surface.
A primary reason to model ground-water flow in the Menomonee Valley is to address questions that arise from the designation of the valley as a brownfield site. The soil in the valley contains industrial contaminants such as organic solvents, petroleum byproducts, tars, and metal waste. Recharge to the valley can dissolve these contaminants from the soil and transfer them to the ground water (SIGMA Environmental Services, Inc., 2002). The fate of potentially contaminated ground water in different parts of the valley is of interest to regulators and developers because it influences decisions about the amount of monitoring and cleanup that is necessary before future redevelopment can go forward. As a first step in an evaluation process, an advective transport analysis could be done in which the potential threat posed by ground-water contamination is determined by the traveltime from a point of recharge in the Menomonee Valley Brownfield to any destination. The advective traveltime (time it takes for the bulk movement of the ground water from the point of recharge to a destination) will be less than the actual time of movement for many contaminants, because these contaminants are subject to retarding mechanisms such as sorption. Destinations include discharge to the water table, to surface-water bodies, and to manmade structures such as the ISS. As the dissolved constituents move from recharge areas to discharge areas, their characteristics and concentration can be changed by mechanisms such as chemical transformation, volatilization, precipitation, sorption, dispersion, and dilution. This process is known as natural attenuation. The rate of natural attenuation of any particular contaminant will depend on its physical and chemical properties and those of the matrix.
The results of the MODFLOW model provide the destination of ground-water flowpaths and approximate advective traveltime. A three-dimensional view of simulated ground-water-flow in the Menomonee Valley Brownfield is shown in figure 15. In the eastern part of the Menomonee Valley Brownfield, ground water is simulated as moving downward to the ISS. The ground water that infiltrates into the ISS is routed to Jones Island at the extreme eastern end of the valley (fig. 2), where all the water is treated at a wastewater plant before being discharged to Lake Michigan. In the western areas, recharge follows local flowpaths that circulate back to the water table and surface-water bodies (fig.15). Model results indicate that most of this flow goes into the Menomonee River or the Menomonee River Estuary.
This method of evaluating contaminant transport processes by simulating advective transport alone is subject to many limitations. In particular, the traveltime results are very sensitive to the assumed values of effective porosity. The results presented in table 8 vary linearly with the assumed porosity. Consequently, if the porosities for each unit were reduced by 50 percent (resulting, for example, in a porosity value for till of 0.05 instead of 0.10), then the simulated traveltimes would be reduced by 50 percent for ground water discharging to the surface and to the ISS.
The analysis also depends on the stability of the simulated flow system. The relatively long travel paths to the ISS depend on the long-term presence of the ISS. If the ISS were to be closed (and filled so as not to be a sink) sometime in the future, the flow system would change, and water previously destined for the ISS may reverse course and discharge to surface-water features or to Lake Michigan.
The City of Milwaukee, Wis., is actively promoting the revitalization of the Menomonee Valley Brownfield, a 1,500-acre industrial center, about a quarter of which is abandoned or underutilized. An understanding of ground-water flow within the brownfield is requisite for evaluation of ground-water contamination. The U.S. Geological Survey (USGS), in cooperation with the City of Milwaukee and its consultants, and with support from USEPA Region 5, used numerical modeling to simulate shallow ground-water flow in the Menomonee Valley Brownfield. Modeling objectives were to simulate the fate of ground-water recharge to the valley, and estimate the traveltime from points of recharge to the ground-water sinks.
Shallow ground-water flow in the valley is driven by sources, primarily recharge to the valley and lateral flow from outside the valley, and sinks, primarily surface-water features and the Milwaukee Metropolitan Sewerage District Inline Storage System (ISS). The ISS is a deep tunnel in the Silurian dolomite bedrock, 17 or 32 ft in diameter, which fills with combined storm-sewer flow and sanitary-sewer overflow during rainstorms. This water is stored for later treatment and discharge to Lake Michigan. Between storms, the ISS is effectively empty and is a regional sink for the ground-water system.
Numerical models were used to simulate ground-water flow and to determine the fate of recharge falling on the Menomonee Valley. A stepwise modeling approach was used in this study, whereby a relatively simple, regional ground-water-flow model was used in an exploratory fashion to help design data collection, test model assumptions, and provide boundary conditions for a local multi-layer model. The regional model was constructed by use of the analytic-element modeling code GFLOW. The GFLOW model domain (as defined by limits of recharge and the far-field analytic elements) covers about 195 mi2 (square miles), including western areas of Lake Michigan. The local model is 8-layers and was constructed by use of the finite-difference modeling code MODFLOW. The MODFLOW model domain covers about 26 mi2 and is centered on the Menomonee Valley Brownfield, which covers about 2.3 mi2. The MODFLOW grid is surrounded by specified-flux boundaries that were extracted from the regional GFLOW solution.
The GFLOW model was calibrated by adjusting line-sink resistances and hydraulic conductivity values; regional recharge rates and the dry-weather infiltration to segments of the ISS were set based on previous work. Only one location was available to match GFLOW-simulated composite hydraulic heads. The GFLOW-simulated head at this location was 541 ft compared to a composite average of 544 ft. The GFLOW calibration was also evaluated in comparison to surface-water flow. Base flow to the Menomonee River along the section between the two U.S. Geological Survey (USGS) streamflow-gaging stations was estimated for pre-ISS conditions by means of flow-duration curves constructed from data collected in the early 1980s. Calculated base flow for this section is 1.0 ft3/s (cubic feet per second). This estimate agrees well with 0.78 ft3/s, the base flow simulated by the GFLOW model for pre-ISS conditions.
The MODFLOW model was calibrated to measured heads (101 wells in unlithified sediments, 33 wells in dolomite), measured vertical gradients at 12 well nests, and measured dry-weather infiltration for five phases of the ISS. Head calibration in the unlithified sediments used water levels measured on August 14, 2001. Head calibration in the dolomite used water levels measured during 1994. Final calibrated values for horizontal hydraulic conductivity and rate of recharge for the MODFLOW model are unchanged from the GFLOW simulation that provided the flux boundary conditions. MODFLOW head calibration was very sensitive to rate of recharge and the distribution of vertical hydraulic conductivity; however, the solution proved almost totally insensitive to the resistance assigned to nodes representing rivers and canals. The simulated flux from losing surface-water bodies directly above the ISS is 0.11 ft3/s, which compares well with the corresponding GFLOW rate specified at 0.10 ft3/sec and, therefore, increases confidence in the stepwise approach.
About 73 percent of ground-water recharge within the MODFLOW domain discharges to the ISS, and 27 percent discharges to gaining surface-water bodies. MODFLOW simulates the following sources of infiltration to the ISS as percentages: 36 percent from recharge within the model domain, 45 percent from lateral flow into the domain, 15 percent from Lake Michigan, and 4 percent from other surface-water bodies. The median traveltime for recharge falling on the valley to reach surface-water bodies is 8 years; the median traveltime to the ISS is 255 years. The traveltime from a given location is largely dictated by the length of a flowpath in the unlithified deposits (where higher porosities imply slower velocities) as opposed to the fractured dolomite. The traveltimes to the ISS are shortest over the northern and western parts of the valley where the dolomite is near the land surface.
Bradbury, K.R., Swanson, S.K., Krohelski, J.T., and Fritz, A.K., 2000, Hydrogeology of Dane County, Wisconsin: Wisconsin Geological and Natural History Survey, University of Wisconsin-Extension, Open-File Report 1999–04, 66 p., 2 pls.
Bates, R.L., and Jackson, J.A., 1980, Glossary of Geology, second edition: Falls Church Virginia, America Geological Institute, 749 p.
Bredehoeft, J.D., and Hall, P., 1995, Ground-water models: Ground Water, v. 33, no. 4, p. 530–531.
Carlson, D.A., 2000, Dependence of conductivities and anisotropies of geologic properties within the near-surface aquifer in Milwaukee, Wisconsin: University of Wisconsin–Milwaukee, Ph.D. dissertation.
Camp Dresser and McKee, 1998, ISS/bedrock interaction hydraulic evaluation: Prepared for Milwaukee Metropolitan Sewerage District, 51 p.
Cherkauer, D.S., 2001, Distribution of ground-water recharge in southeastern Wisconsin: Final Report to Source Water Protection Program, Wisconsin Department of Natural Resources.
Cherkauer, D.S. and Carlson, D.A., 1997, Interaction of Lake Michigan with a layered aquifer stressed by drainage: Ground Water, v. 35, no. 6, p. 981–989.
Feinstein, D.T., Dunning, C.P., Hunt, R.J., and Krohelski, J.T., 2003, Stepwise use of GFLOW and MODFLOW to determine relative importance of shallow and deep receptors: Ground Water, v. 41, no. 2, p. 190–199.
Feinstein, D.T., Hart, D.J., Eaton, T.T., Krohelski, J.T., and Bradbury, K.R., 2004, Simulation of regional groundwater flow in southeastern Wisconsin: Wisconsin Geological and Natural History Survey Open File Report 2004-01.
Gebert, W.A., Graczyk, D.J., and Krug, W.R., 1989, Average annual runoff in the United States 1951–1980: U.S. Geological Survey Hydrologic Atlas HA–710, scale 1:7, 5000,000.
Haitjema, H.M., Kelson, V.A., and de Lange, W., 2001, Selecting MODFLOW cell sizes for accurate flow fields: Ground Water, v. 39, no. 6, p. 931–938.
Haitjema, H.M., 2000, GFLOW2000—Groundwater flow modeling system, Haitjema Software.
Haitjema, H.M., 1995, Analytic element modeling of groundwater flow: San Diego, Calif., Academic Press, 394 p.
Hsieh, P.A., and Winston, R.B., 2002, User's guide to Model Viewer, a program for three-dimensional visualization of ground-water model results: U.S. Geological Survey Open File Report 02–106.
Hunt, R.J., 2002, Evaluating the importance of future data collection sites using parameter estimation and analytic element ground-water flow models in Computational Methods in Water Resources—Proceedings of the 14th International Conference on Computational Methods in Water Resources, June 23–28, 2002: Delft, The Netherlands, p. 755–762.
Hunt, R.J., Anderson, M.P., and Kelson, V.A., 1998, Improving a complex finite-difference round water flow model through the use of an analytic element screening model: Ground Water, v. 36, no. 6, p. 1011–1017.
Hunt, R.J., Graczyk, D.J., and Rose, W.J., 2000, Water flows in the Necedah Wildlife Refuge: U.S. Geological Survey Fact Sheet FS–068–00, 4 p.
Hunt, R.J. and Krohelski, J.T., 1996, The application of an analytic element model to investigate groundwater-lake interactions at Pretty Lake, Wisconsin: Journal of Lake and Reservoir Management, v. 12, no. 4, p. 487–495.
Hunt, R.J., Lin, Y., Krohelski, J.T., and Juckem, P.F., 2000, Simulation of the shallow hydrologic system in the vicinity of Middle Genesee Lake, Wisconsin, using analytic elements and parameter estimation: U.S. Geological Survey Water-Resources Investigations Report 00–4136, 16 p.
Hunt, R.J., and Zheng, C., 1999, Debating complexity in modeling: EOS Transactions, American Geophysical Union, v. 80, no. 3, p. 29.
Krohelski, J.T., Bradbury, K.R., Hunt, R.J., and Swanson, S.K., 2000, Numerical simulation of groundwater flow in Dane County, Wisconsin: Wisconsin Geological and Natural History Survey, University of Wisconsin-Extension, Bulletin 98, 31 p.
McDonald, M.G., and Harbaugh A.W., 1988, A modular three-dimensional finite-difference ground-water flow model: Techniques of Water-Resources Investigations of the U.S. Geological Survey, book 6, chap. A1, [variously paged].
Milwaukee Metropolitan Sewerage District, 1998, Assessment of Tunnel Water Migration: Report prepared by Camp Dresser and McKee.
Mitchell-Bruker, S., and Haitjema, H.M., 1996, Modeling steady state conjunctive groundwater and surface water flow with analytic elements: Water Resources Research, v. 32, no. 9, p. 2725–2732.
Mudrey, M.G., Jr., Brown, B.A., and Greenberg, J.K., 1982, Bedrock geologic map of Wisconsin: University of Wisconsin-Extension, Wisconsin Geological and Natural History Survey, scale 1:1,000,000
Need, E.A., 1983, Quaternary stratigraphy of the Lower Milwaukee and Menomonee River Valleys, Milwaukee, Wisconsin, in Late Pleistocene history of southeastern Wisconsin, Mickelson, M. and Clayton, Lee, eds., Wisconsin Geologic and Natural History Survey, Geoscience Wisconsin, v. 7, p. 24–42.
Plomb, 1989, A 3-D finite element model to predict drawdown caused by infiltration into a 32-foot diameter tunnel, in Solving groundwater problems with models: Association of Ground Water Scientists & Engineers proceedings, 4th conference, Indianapolis, Ind., February 1989.
Pollock, D.W., 1994, User's Guide to MODPATH/MPATH-PLOT, version 3—A particle tracking post-processing package for MODFLOW, the U.S. Geological Survey finite-difference ground-water flow model: U.S. Geological Survey Open-File Report 94–464, [variously paged].
Quinn, F.H., 1988, Likely effects of climatic change on water levels in the Great Lakes: Proceedings of the 1st North American conference on preparing for climate change: a cooperative approach, Washington, D.C., October 27–29, 1987, by the Climate Institute of Washington D.C., p. 481–487.
Rust/Harza, April 2002, Internal inspection of the Inline Storage System: Milwaukee, Wis., Report prepared for the Milwaukee Metropolitan Sewerage District, [variously paged].
SIGMA Environmental Services, Inc., 1999, Summary of existing data collection and review activities completed for Menomonee River Valley Brownfields Demonstration Pilot Project: Milwaukee, Wis., prepared for the City of Milwaukee Department of City Development, 10 p.
SIGMA Environmental Services, Inc., 2002, Area-wide groundwater investigation report for the Menomonee River Valley Brownfields Demonstration Pilot Project: Milwaukee, Wis.
Southeast Wisconsin Regional Planning Commission, 1976, A comprehensive plan for the Menomonee River Watershed—Volume One, inventory findings and forecasts: Waukesha, Wis., 481 p.
S.S. Papadopulos and Associates, 1991, PATH3D User's Manual: Rockville, Md., [variously paged].
Strack, O.D.L., 1989, Groundwater mechanics: Englewood Cliffs, N.J., Prentice-Hall, 732 p.
Sun, Ne-Zheng, Yang, S., and Yeh, W-G., 1998, A proposed stepwise regression model for model structure identification: Water Resources Research, v. 34, no. 10, p. 2561–2572.
Calibration targets, August 14, 2001
(well name, location, screen interval, model layer, measured and simulated head, residual)
MODEL X ORIGIN = 1,362,612 ft in UTM coordinates
MODEL Y ORIGIN = 15,620,203 ft in UTM coordinates
| Well | Xmodel | Ymodel | Column | Row | Measure point | Layer | Observed head | Simulated head | Residual |
|---|---|---|---|---|---|---|---|---|---|
| Wells in unlithified sediments – August 14, 2001 is the date of all measurements | |||||||||
| Distant Wells | |||||||||
| #1436 | 39,364.00 | 21,542.00 | 158 | 1 | 613.31 | 1 | 613.31 | 584.28 | 29.03 |
| #3790 | 19,850.00 | 873.00 | 80 | 84 | 634.17 | 1 | 634.17 | 642.01 | -7.84 |
| #4292 | 30,742.17 | 741.00 | 123 | 85 | 629.82 | 1 | 629.82 | 621.61 | 8.21 |
| CLARK | 24,475.00 | 13,471.00 | 98 | 34 | 662.14 | 1 | 662.14 | 656.02 | 6.12 |
| FORESTRY | 16,897.00 | 16,030.00 | 68 | 23 | 623.28 | 1 | 623.28 | 620.24 | 3.04 |
| HTOWN | 9,515.00 | 971.00 | 39 | 84 | 741.57 | 1 | 741.57 | 727.29 | 14.28 |
| Bluff Wells | |||||||||
| BL_JK434 | 30,390.74 | 8,555.84 | 122 | 53 | 597.03 | 1 | 601.24 | 593.44 | 7.80 |
| BL_JM081 | 19,968.26 | 8,287.00 | 80 | 54 | 608.85 | 1 | 612.30 | 610.21 | 2.09 |
| BL_JM718 | 26,687.00 | 13,536.00 | 107 | 33 | 671.15 | 1 | 674.33 | 667.63 | 6.70 |
| BL_JY481 | 16,124.00 | 11,321.00 | 65 | 42 | 630.72 | 1 | 651.71 | 636.63 | 15.08 |
| BL_JY505 | 23,271.00 | 6,811.00 | 94 | 60 | 657.83 | 1 | 662.33 | 642.96 | 19.37 |
| BL_JY551 | 19,218.26 | 9,850.00 | 77 | 48 | 596.04 | 1 | 608.67 | 595.13 | 13.54 |
| BL_JY556 | 30,112.00 | 13,996.00 | 121 | 32 | 628.69 | 1 | 635.36 | 625.37 | 9.99 |
| Valley Wells | |||||||||
| JI093 | 2,9275.00 | 11,438.00 | 118 | 42 | 572.64 | 1 | 577.12 | 579.17 | -2.05 |
| JI094 | 2,9565.20 | 11,442.64 | 119 | 42 | 573.35 | 1 | 579.12 | 579.17 | -0.05 |
| JI098 | 2,9971.00 | 11,404.00 | 120 | 42 | 572.49 | 1 | 575.85 | 579.17 | -3.32 |
| JI100 | 2,9361.00 | 11,371.00 | 118 | 42 | 574.45 | 1 | 581.12 | 579.17 | 1.95 |
| JL774 | 31,146.09 | 10,634.97 | 125 | 45 | 576.19 | 1 | 582.50 | 579.14 | 3.36 |
| JL775 | 31,114.00 | 10,368.00 | 125 | 46 | 576.95 | 1 | 581.38 | 579.23 | 2.15 |
| JL776 | 30,971.00 | 11,103.00 | 124 | 43 | 577.41 | 1 | 581.55 | 579.17 | 2.38 |
| JL958 | 29,533.94 | 11,371.00 | 119 | 42 | 574.43 | 1 | 581.05 | 579.17 | 1.88 |
| JM108 | 28,521.00 | 12,060.00 | 115 | 39 | 575.84 | 1 | 578.84 | 579.40 | -0.56 |
| JM714 | 33,125.00 | 11,609.00 | 133 | 41 | 574.51 | 1 | 578.55 | 579.20 | -0.65 |
| JM715 | 33,066.00 | 11,511.00 | 133 | 41 | 574.93 | 1 | 578.73 | 579.20 | -0.47 |
| JM716 | 33,133.30 | 11,513.34 | 133 | 41 | 574.73 | 1 | 578.42 | 579.20 | -0.78 |
| JM719 | 28,501.00 | 12,126.00 | 115 | 39 | 575.76 | 1 | 578.98 | 579.40 | -0.42 |
| JM720 | 28,514.00 | 12,027.00 | 115 | 39 | 575.22 | 1 | 578.88 | 579.40 | -0.52 |
| JW045 | 29,518.00 | 11,470.00 | 119 | 42 | 573.85 | 1 | 580.52 | 579.17 | 1.35 |
| JY482 | 25,521.00 | 9,886.00 | 103 | 48 | 575.02 | 3 | 578.91 | 572.87 | 6.04 |
| JY521 | 22,497.00 | 11,929.00 | 90 | 40 | 591.53 | 3 | 593.32 | 589.01 | 4.31 |
| JY522 | 32,442.51 | 9,441.64 | 130 | 50 | 588.51 | 1 | 593.03 | 583.64 | 9.39 |
| JY523 | 32,487.00 | 12815.00 | 130 | 36 | 588.02 | 1 | 592.64 | 579.48 | 13.16 |
| JY531 | 23,718.00 | 9,993.00 | 95 | 48 | 575.98 | 1 | 579.46 | 580.71 | -1.25 |
| JY541 | 33,122.64 | 11,479.17 | 133 | 42 | 574.43 | 1 | 578.37 | 579.20 | -0.83 |
| JY542 | 33,105.49 | 11,427.00 | 133 | 42 | 574.26 | 1 | 578.43 | 579.20 | -0.77 |
| JY543 | 29,830.00 | 11,404.00 | 120 | 42 | 573.42 | 1 | 576.43 | 579.17 | -2.74 |
| JY545 | 29,826.00 | 11,444.00 | 120 | 42 | 573.67 | 1 | 576.09 | 579.17 | -3.08 |
| JY546 | 29,849.00 | 11,437.00 | 120 | 42 | 573.25 | 1 | 575.26 | 579.17 | -3.91 |
| JY547 | 20,440.00 | 8,878.00 | 82 | 52 | 581.47 | 1 | 582.31 | 584.04 | -1.73 |
| JY548 | 20,440.00 | 9,009.00 | 82 | 51 | 580.95 | 1 | 582.32 | 585.43 | -3.11 |
| JY550 | 20,424.00 | 8,943.00 | 82 | 52 | 581.29 | 1 | 582.33 | 584.04 | -1.71 |
| JY555 | 19,677.00 | 10,491.00 | 79 | 46 | 583.04 | 1 | 585.11 | 586.97 | -1.86 |
| JY558 | 29,055.00 | 10,912.00 | 117 | 44 | 576.38 | 1 | 578.87 | 579.08 | -0.21 |
| JY560 | 29,115.00 | 10,912.00 | 117 | 44 | 573.29 | 1 | 578.90 | 579.08 | -0.18 |
| JY561 | 29,203.00 | 11,010.00 | 117 | 43 | 579.04 | 1 | 580.51 | 579.09 | 1.42 |
| JY562 | 28,786.00 | 10,387.00 | 116 | 46 | 574.31 | 1 | 578.81 | 579.17 | -0.36 |
| JY563 | 28,760.00 | 10,387.00 | 116 | 46 | 574.52 | 1 | 578.89 | 579.17 | -0.28 |
| JY564 | 28,773.00 | 10,356.00 | 116 | 46 | 574.51 | 1 | 579.03 | 579.17 | -0.14 |
| JY569 | 29,361.00 | 10,256.00 | 118 | 46 | 576.11 | 1 | 578.84 | 579.20 | -0.36 |
| JY571 | 29,259.00 | 10,321.00 | 118 | 46 | 576.92 | 1 | 579.91 | 579.20 | 0.71 |
| JY572 | 29,075.00 | 10,190.00 | 117 | 47 | 577.93 | 1 | 581.28 | 579.23 | 2.05 |
| JY573 | 29,088.00 | 10,256.00 | 117 | 46 | 576.45 | 1 | 579.20 | 579.17 | 0.03 |
| JY574 | 29,092.00 | 10,354.00 | 117 | 46 | 577.55 | 1 | 580.43 | 579.17 | 1.26 |
| JY575 | 29,101.00 | 10,420.00 | 117 | 46 | 577.83 | 1 | 580.42 | 579.17 | 1.25 |
| JY576 | 29,105.00 | 10,485.00 | 117 | 46 | 577.74 | 1 | 580.77 | 579.17 | 1.60 |
| JY577 | 30,135.00 | 11,207.00 | 121 | 43 | 579.03 | 1 | 580.54 | 579.13 | 1.41 |
| JY581 | 28,629.00 | 11,207.00 | 115 | 43 | 577.98 | 1 | 578.72 | 579.17 | -0.45 |
| JY582 | 27,057.00 | 11,273.00 | 109 | 42 | 573.42 | 1 | 579.49 | 579.54 | -0.05 |
| JY583 | 27,247.00 | 10,748.00 | 109 | 45 | 576.53 | 1 | 580.61 | 579.55 | 1.06 |
| JY591 | 28,547.00 | 12,027.00 | 115 | 39 | 576.40 | 1 | 578.78 | 579.40 | -0.62 |
| JY592 | 28,580.00 | 11,929.00 | 115 | 40 | 575.21 | 1 | 578.86 | 579.50 | -0.64 |
| JY593 | 28,590.00 | 12,060.00 | 115 | 39 | 573.88 | 2 | 579.09 | 573.78 | 5.31 |
| JY594 | 28,619.00 | 11,994.00 | 115 | 40 | 575.25 | 1 | 578.55 | 579.50 | -0.95 |
| JY595 | 29,046.00 | 11,404.00 | 117 | 42 | 574.33 | 1 | 581.39 | 579.21 | 2.18 |
| JY596 | 29,046.00 | 11,371.00 | 117 | 42 | 577.23 | 1 | 581.16 | 579.21 | 1.95 |
| JY597 | 28,990.00 | 11,437.00 | 116 | 42 | 577.00 | 1 | 581.24 | 579.23 | 2.01 |
| JY598 | 29,036.00 | 11,437.00 | 117 | 42 | 577.39 | 1 | 581.26 | 579.21 | 2.05 |
| JY599 | 29,115.00 | 11,470.00 | 117 | 42 | 577.10 | 1 | 578.48 | 579.21 | -0.73 |
| JY600 | 29,108.00 | 11,437.00 | 117 | 42 | 575.12 | 1 | 578.90 | 579.21 | -0.31 |
| JY614 | 31,300.26 | 11,226.68 | 126 | 43 | 573.58 | 1 | 581.03 | 579.11 | 1.92 |
| JY617 | 29,940.00 | 12,386.00 | 120 | 38 | 573.02 | 1 | 576.36 | 578.26 | -1.90 |
| JY618 | 29,938.00 | 12,382.00 | 120 | 38 | 543.94 | 3 | 572.91 | 560.66 | 12.25 |
| JY631 | 26,835.00 | 12,482.00 | 108 | 38 | 570.44 | 1 | 576.03 | 578.19 | -2.16 |
| JY647 | 25,521.69 | 11,771.60 | 103 | 40 | 538.76 | 3 | 568.95 | 569.41 | -0.46 |
| Nested Wells (D=deep, S=shallow, W=water table) | |||||||||
| N1D_JY507 | 25,495.00 | 11,456.00 | 102 | 42 | 532.36 | 3 | 565.77 | 570.45 | -4.68 |
| N1S_JY506 | 25,483.00 | 11,443.00 | 102 | 42 | 562.34 | 2 | 573.45 | 575.77 | -2.32 |
| N1W_JY508 | 25,483.00 | 11,466.00 | 102 | 42 | 571.51 | 1 | 576.63 | 579.72 | -3.09 |
| N2D_JY502 | 33,114.00 | 11,615.00 | 133 | 41 | 510.18 | 3 | 560.06 | 558.72 | 1.34 |
| N2S_JY501 | 33,115.00 | 11,605.00 | 133 | 41 | 561.05 | 2 | 576.86 | 572.11 | 4.75 |
| N2W_JM717 | 33,125.00 | 11,609.00 | 133 | 41 | 575.07 | 1 | 578.53 | 579.20 | -0.67 |
| N3D_JY649 | 26,055.00 | 12,020.00 | 105 | 39 | 539.96 | 3 | 568.91 | 567.91 | 1.00 |
| N3W_JY648 | 26,055.00 | 12,020.00 | 105 | 39 | 579.03 | 1 | 583.37 | 579.08 | 4.29 |
| N4D_JY513 | 29,403.00 | 11,437.00 | 118 | 42 | 511.05 | 3 | 564.51 | 563.01 | 1.50 |
| N4S_JL119 | 29,376.00 | 11,471.00 | 118 | 42 | 569.99 | 2 | 577.11 | 574.26 | 2.85 |
| N4W_JW180 | 29,271.96 | 11,419.72 | 118 | 42 | 574.11 | 1 | 581.03 | 579.17 | 1.86 |
| N5D_JY619 | 27,153.00 | 10,511.00 | 109 | 45 | 529.09 | 2 | 570.59 | 575.28 | -4.69 |
| N5W_JY557 | 7,182.00 | 10,702.00 | 109 | 45 | 577.43 | 1 | 581.04 | 579.55 | 1.49 |
| N6D_JY613 | 30,325.43 | 8,712.30 | 122 | 53 | 560.50 | 3 | 562.00 | 560.60 | 1.40 |
| N6W_MW-3 | 30,311.78 | 8,710.81 | 122 | 53 | 595.22 | 1 | 599.36 | 593.44 | 5.92 |
| N7B_JY644 | 25,182.00 | 12,513.00 | 101 | 37 | 545.19 | 5 | 585.67 | 567.14 | 18.53 |
| N7W_JY643 | 25,181.00 | 12,507.00 | 101 | 37 | 582.87 | 4 | 587.32 | 587.17 | 0.15 |
| N8D_JY646 | 26,008.00 | 12,106.00 | 105 | 39 | 533.96 | 3 | 570.77 | 567.91 | 2.86 |
| N8W_JY645 | 26,008.00 | 12,104.00 | 105 | 39 | 578.93 | 1 | 583.33 | 579.08 | 4.25 |
| N9D_JY510 | 19,325.00 | 10,470.00 | 78 | 46 | 558.98 | 2 | 585.54 | 586.32 | -0.78 |
| N9W_JY511 | 19,325.00 | 10,470.00 | 78 | 46 | 578.84 | 1 | 585.01 | 585.97 | -0.96 |
| N11D_JY612 | 30,658.00 | 10,281.00 | 123 | 46 | 523.04 | 3 | 558.15 | 561.37 | -3.22 |
| N11W_JY611 | 30,658.00 | 10,286.00 | 123 | 46 | 572.28 | 1 | 578.98 | 579.27 | -0.29 |
| N12D_JY616 | 28,478.00 | 8,947.00 | 114 | 52 | 549.95 | 3 | 581.53 | 566.59 | 14.94 |
| N12W_JY615 | 28,479.37 | 8,944.13 | 114 | 52 | 581.09 | 2 | 582.90 | 575.98 | 6.92 |
| N13S_JL777 | 31,018.00 | 10,677.00 | 125 | 45 | 553.99 | 2 | 572.04 | 573.24 | -1.20 |
| N13W_JL773 | 30,849.97 | 10,693.00 | 124 | 45 | 578.20 | 1 | 582.23 | 579.17 | 3.06 |
| Wells in bedrock used to monitor Deep Tunnel – data gathered during 1994 | |||||||||
| CT-MW-01 | 37,678 | 8,278 | 151 | 54 | 587.27 | 7 | 290.24 | 359.25 | -69.01 |
| CT-MW-02 | 34,322 | 10,630 | 138 | 45 | 594.20 | 7 | 422.66 | 349.98 | 72.68 |
| CT-MW-03 | 32,369 | 11,303 | 130 | 42 | 585.94 | 7 | 352.74 | 338.26 | 14.48 |
| CT-MW-04 | 30,551 | 11,436 | 123 | 42 | 587.57 | 7 | 398.91 | 349.28 | 49.63 |
| CT-MW-05 | 25,514 | 11,318 | 103 | 42 | 589.58 | 7 | 330.50 | 360.39 | -29.89 |
| CT-MW-06 | 20,660 | 11,141 | 83 | 43 | 640.21 | 7 | 350.74 | 397.48 | -46.74 |
| CT-MW-07 | 18,913 | 14,484 | 76 | 30 | 664.80 | 7 | 336.05 | 396.93 | -60.88 |
| CT-MW-08 | 14,286 | 15,713 | 58 | 25 | 633.96 | 7 | 396.31 | 416.96 | -20.65 |
| CT-MW-09 | 8,475 | 18,250 | 34 | 15 | 661.02 | 7 | 434.32 | 450.71 | -16.39 |
| CT-MW-10 | 23,787 | 11,260 | 96 | 42 | 597.68 | 7 | 355.06 | 364.42 | -9.36 |
| Wells in bedrock used to monitor Deep Tunnel (continued) | |||||||||
| CT-MW-11 | 34,322 | 10,630 | 138 | 45 | 594.02 | 6 | 453.70 | 471.34 | -17.64 |
| CT-MW-12 | 23,918 | 12,025 | 96 | 39 | 597.74 | 6 | 510.21 | 511.70 | -1.49 |
| CT-MW-13 | 20,655 | 12,082 | 83 | 39 | 640.52 | 6 | 581.36 | 531.92 | 49.44 |
| NS-MW-01 | 33,301 | 12,292 | 134 | 38 | 590.21 | 6 | 532.72 | 470.89 | 61.83 |
| NS-MW-02 | 33,296 | 15,889 | 134 | 24 | 592.34 | 6 | 536.30 | 486.74 | 49.56 |
| NS-MW-03 | 35,857 | 19,589 | 144 | 9 | 630.09 | 6 | 479.73 | 496.65 | -16.92 |
| KK-MW-01 | 35,643 | 6,810 | 143 | 60 | 586.36 | 7 | 378.96 | 334.46 | 44.50 |
| KK-MW-02 | 34,064 | 3,746 | 137 | 73 | 599.54 | 7 | 523.60 | 335.47 | 188.13 |
| KK-MW-03 | 34,218 | 678 | 137 | 85 | 587.10 | 7 | 496.08 | 340.42 | 155.66 |
| KK-MW-05 | 35,643 | 6,810 | 143 | 60 | 585.27 | 5 | 512.59 | 538.38 | -25.79 |
| LM-MW-01 | 39,397 | 1,467 | 158 | 82 | 595.42 | 6 | 579.47 | 500.13 | 79.34 |
| NS-MR-05S | 34,587 | 17,093 | 139 | 19 | 592.15 | 6 | 543.89 | 490.39 | 53.50 |
| NS-MR-05D | 34,587 | 17,093 | 139 | 19 | 591.91 | 7 | 413.87 | 383.01 | 30.86 |
| CT-MR-06S | 28106 | 11717 | 113 | 41 | 587.76 | 499.01 | 491.67 | 7.34 | |
| CT-MR-06D | 28049 | 11717 | 113 | 41 | 586.88 | 7 | 516.10 | 73.10 | 143.00 |
| CT-MR-07S | 13462 | 14073 | 54 | 31 | 696.99 | 5 | 635.82 | 635.23 | 0.59 |
| CT-MR-07D | 13438 | 14083 | 54 | 31 | 698.04 | 8 | 582.06 | 526.11 | 55.95 |
| I30-25-CT | 31667 | 12575 | 127 | 37 | NA | 6 | 514.06 | 479.08 | 34.98 |
| I30-CT-DS-6 | 25553 | 12514 | 103 | 37 | NA | 5 | 554.85 | 558.90 | -4.05 |
| I30-17-CT | 10190 | 17064 | 41 | 19 | NA | 6 | 632.67 | 601.56 | 31.11 |
| C44-PZ-06 | 33044 | 2391 | 133 | 78 | NA | 5 | 560.58 | 563.05 | -2.47 |
| C10-07-KK | 34048 | 420 | 137 | 86 | NA | 5 | 544.52 | 571.66 | -27.14 |
| I30-10-NS | 36927 | 20933 | 148 | 4 | NA | 5 | 549.00 | 558.99 | -9.99 |
Document Accessibility: Adobe Systems Incorporated has information about PDFs and the visually impaired. This information provides tools to help make PDF files accessible. These tools convert Adobe PDF documents into HTML or ASCII text, which then can be read by a number of common screen-reading programs that synthesize text as audible speech. In addition, an accessible version of Acrobat Reader 6.0, which contains support for screen readers, is available. These tools and the accessible reader may be obtained free from Adobe at Adobe Access.
| AccessibilityFOIAPrivacyPolicies and Notices | |
 |
|