
Prepared in cooperation with the New Mexico Environment Department
Scientific Investigations Report 2004-5063
Methods for Compiling and Reviewing Historical Surface-Water Quality Data
Historical Surface-Water Quality
Figure 1. Study area and surface-water sampling locations.
Figure 2. Average daily discharge and timing of surface-water samples colle...
Figure 3. Average daily discharge and timing of surface-water samples colle...
Figure 4. Sulfate concentrations and average daily discharge in the Red Riv...
Figure 5. Sulfate concentrations and average daily discharge in the Red Riv...
Figure 6. Sulfate concentrations in the Red River at the Questa Ranger Stat...
Figure 7. Sulfate concentrations in the Red River upstream and downstream f...
Figure 8. Sulfate loads in the Red River at the Questa Ranger Station gage,...
Figure 9. Sulfate loads in the Red River upstream and downstream from the m...
Figure 10. Specific conductance in relationship to sulfate concentrations i...
Figure 11. Sulfate concentrations in relationship to total dissolved solids...
Figure 12. Sulfate concentrations in relationship to total dissolved solids...
Figure 13. Calcium concentrations in relationship to sulfate concentrations...
Figure 14. Calcium to sulfate molar ratio over time in the Red River at the...
Figure 15. Alkalinity values in the Red River upstream and downstream from ...
Figure 16. Zinc concentrations over time in the Red River upstream and down...
Figure 17. Specific conductance, pH, and average daily discharge in the Red...
Figure 18. Specific conductance and average daily discharge in the Red Rive...
Figure 19. Total and dissolved zinc concentrations and average daily discha...
Figure 20. Dissolved and total zinc concentrations and average daily discha...
Figure 21. pH, specific conductance, and average daily discharge in the Red...
Table 1. Red River monthly climate summary from January 1915 to December 20...
Table 2. Sampling events, dates, and analyses.
Table 3. Sample collection, preservation, and analysis methods, laboratory,...
Table 6. Definition of hydrologic conditions and summary of sampling events...
Table 4. Historical water-quality data at the Questa Ranger Station on the ...
Table 5. Water-quality data upstream from the Molycorp, Inc. molybdenum min...
1Buka Environmental, Boulder, Colo.
2U.S. Geological Survey
| Multiply | By | To obtain |
|---|---|---|
| inch (in) | 2.54 | centimeter (cm) |
| foot (ft) | 0.3048 | meter (m) |
| mile (mi) | 1.609 | kilometer (km) |
| acre | 0.004047 | square kilometer (km2) |
| square mile (mi2) | 2.590 | square kilometer (km2) |
| cubic foot per second (ft3/s) | 0.02832 | cubic meter per second (m3/s) |
| ton, short (2,000 lb) | 0.9072 | metric ton |
Temperature in degrees Celsius (°C) may be converted to degrees Fahrenheit (°F) as follows:
°F=(1.8x°C)+32
Vertical coordinate information is referenced to the North American Vertical Datum of 1988 (NAVD 88). Elevation, as used in this report, refers to distance above the vertical datum. Specific conductance is given in microsiemens per centimeter at 25 degrees Celsius (µS/cm at 25°C).
| AAS | atomic absortdtion stdectrometry |
| BLM | Bureau of Land Management |
| ENSR | ENSR Consulting and Engineering, Inc. |
| NM BMMR | New Mexico Bureau of Mines and Mineral Resources |
| NMDGF | New Mexico Detdartment of Game and Fish |
| NMED | New Mexico Environment Detdartment |
| NMEID | New Mexico Environmental Imtdrovement Division |
| NM ONRT | New Mexico Office of the Natural Resource Trustee |
| NWIS | U.S. Geological Survey National Water Information System |
| QA/QC | quality assurance/quality control |
| QStd | quartz-sericite-tdyrite |
| R2 | correlation coefficient |
| STORET | USEtdA's STORage and RETrieval System |
| TDS | total dissolved solids |
| USEtdA | U.S. Environmental tdrotection Agency |
| USGS | U.S. Geological Survey |
| USHEW | U.S. Detdartment of Health, Education, and Welfare |
| kg/d | kilograms tder day |
| meq/L | milliequivalents tder liter |
| mg/L | milligrams tder liter |
| mL | milliliters |
| µm | micrometer |
| µg/L | micrograms tder liter |
| µS/cm | microsiemens tder centimeter at 25 degrees Celsius |
Historical water-quality samples collected from the Red River over the past 35 years were compiled, reviewed for quality, and evaluated to determine influences on water quality over time. Hydrologic conditions in the Red River were found to have a major effect on water quality. The lowest sulfate concentrations were associated with the highest flow events, especially peak, rising limb, and falling limb conditions. The highest sulfate concentrations were associated with the early part of the rising limb of summer thunderstorm events and early snowmelt runoff, transient events that can be difficult to capture as part of planned sampling programs but were observed in some of the data. The first increase in flows in the spring, or during summer thunderstorm events, causes a flushing of sulfide oxidation products from scars and mine-disturbed areas to the Red River before being diluted by rising river waters.
A trend of increasing sulfate concentrations and loads over long time periods also was noted at the Questa Ranger Station gage on the Red River, possibly related to mining activities, because the same trend is not apparent for concentrations upstream. This trend was only apparent when the dynamic events of snowmelt and summer rainstorms were eliminated and only low-flow concentrations were considered. An increase in sulfate concentrations and loads over time was not seen at locations upstream from the Molycorp, Inc., molybdenum mine and downstream from scar areas. Sulfate concentrations and loads and zinc concentrations downstream from the mine were uniformly higher, and alkalinity values were consistently lower, than those upstream from the mine, suggesting that additional sources of sulfate, zinc, and acidity enter the river in the vicinity of the mine. During storm events, alkalinity values decreased both upstream and downstream of the mine, indicating that natural sources, most likely scar areas, can cause short-term changes in the buffering capacity of the Red River.
The major-element water chemistry of the Red River is controlled by dissolution of calcite and gypsum and the oxidation of pyrite, and the river is generally not well buffered with respect to pH. During higher-flow periods, Red River water was diluted by calcium-carbonate waters, most likely from unmineralized Red River tributaries and areas upstream from scars. The effect of pyrite oxidation on Red River water chemistry was more pronounced after the early 1980's. Elevated zinc concentrations were most apparent during summer thunderstorm and rising limb times, which also were associated with a decrease in alkalinity and an increase in sulfate concentrations and conductivity. The water-quality results demonstrate that it is critical to consider hydrologic conditions when interpreting water chemistry in naturally mineralized or mined drainages.
Molycorp, Inc. operates a molybdenum mine west of the town of Red River, New Mexico on approximately 18 km2 of land surrounded by the Carson National Forest. The Red River forms the southern boundary of the mine site and flows to the west where it joins the Rio Grande River (fig. 1). State and federal authorities have raised concerns about potential injury to the Red River fishery and aquatic life since open-pit mining began in 1965. Water quality of receiving streams can change over time because of climatic events and because mining activities evolve and change in type and extent over time. Information is needed to discern the potential effects of climate and seasonal events from mining or other anthropogenic activities. This paper puts the available data on Red River water quality into historical perspective so that trends over time and their causes can be better understood.
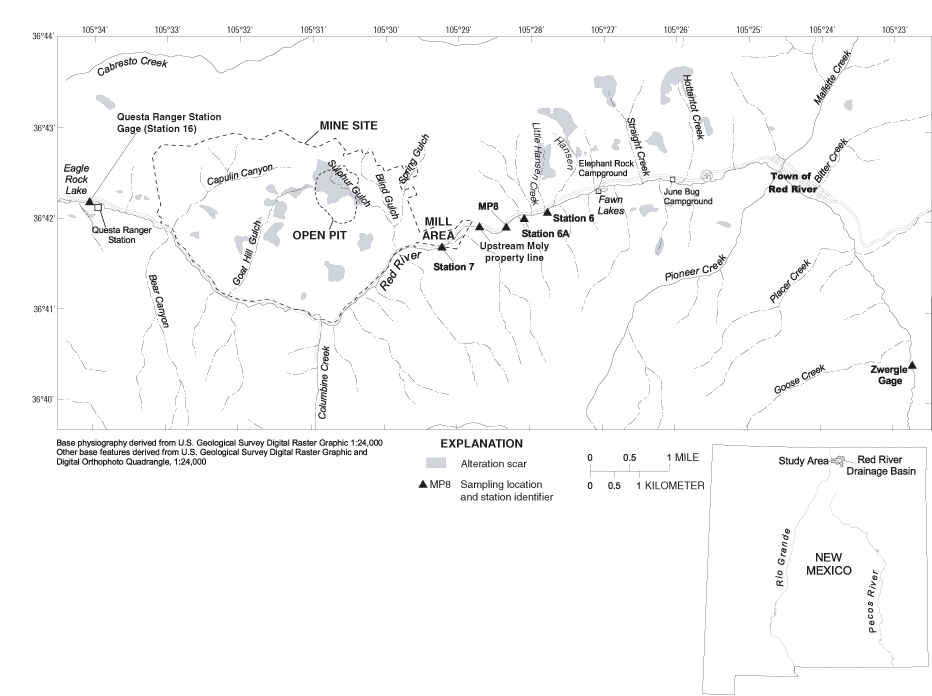
Figure 1. Study area and surface-water sampling locations.
Historical surface-water quality evaluation is part of the Questa baseline and pre-mining ground-water quality investigation, hereinafter called the Questa pre-mining study, conducted by the U.S. Geological Survey (USGS) in cooperation with the New Mexico Environment Department (NMED). The overall objective of the investigation is to infer the pre-mining ground-water quality at the Questa Molycorp, Inc. mine site. As part of this investigation, the USGS, in cooperation with NMED, has compiled and evaluated historical surface-water quality data for the Red River.
Although a considerable number of surface-water samples in the Red River Valley were collected from 1965 to 2001, the data were not compiled in a single document, did not undergo data quality evaluation, and have not been utilized to interpret water-rock interactions. The purpose of this report is to compile and evaluate historical surface-water quality data in the Red River Valley between the Questa Ranger Station and the town of Red River. "Historical" data are defined as all data existing from the earliest available record (1965) until November 2001. The purpose of this report also is to delineate any spatial and temporal trends in the data and to obtain some preliminary information on water-rock interactions or any other factors affecting temporal trends in Red River water quality.
The study area is located in Taos County in north-central New Mexico in the Red River drainage basin, a tributary to the Rio Grande within the Carson National Forest. The area is a rugged and altered terrain with steep slopes and V-shaped valleys. The study reach is in the Red River Valley between the Questa Ranger Station (elevation 7,452 ft or 2,271 m) at the west end and the town of Red River (elevation 8,680 feet or 2,646 m) at the east end (fig. 1). The Molycorp, Inc. Questa molybdenum mine, referred to as the mine site, is located on the north side of State Highway No. 38 and the Red River, approximately 20 km east of the Ranger Station. The mine site is approximately 15 km2 and encompasses three tributary valleys to the Red River: Capulin Canyon, Goat Hill Gulch and Sulphur Gulch, from west to east respectively.
Mining activities produced extensive underground workings and an open-pit of approximately 914 m in diameter, covering approximately 0.66 km2, near or in Sulphur Gulch (URS, 2001). Waste-rock piles cover steep slopes on the north side of the Red River between Capulin Canyon and Spring Gulch (a tributary valley of Sulphur Gulch). Hydrothermally altered bedrock is found in Capulin, Goat Hill, Sulphur, Hansen, Straight, and Hottentot drainages (fig. 1). Weathering of extensively altered rock has resulted in steep, highly erosive, sparsely vegetated "scars" that are clearly visible from the ground and in aerial photographs.
The Red River Valley is located within a semi-arid desert that receives precipitation throughout the year and sustains moderate biodiversity. Between 1915 and 2002, the annual average temperature was 4°C, the annual average precipitation and snowfall were 52 cm and 370 cm, respectively, and the daily temperatures generally fluctuated by 18°C throughout the year (table 1).
Climate and vegetation vary greatly within short distances because of differences in topography, weather, sun exposure, elevation, and sediment composition. The land-surface elevation in the study area ranges from 2,271 m at the Ranger Station to 2,704 m at the Zwergle gage upstream from the town of Red River. Orographic effects of mountainous topography lead to precipitation on the windward slopes and localized storms within tributary valleys. Major precipitation events include summer thunderstorms and winter-spring snowstorms. Thunderstorms are responsible for mass wasting in hydrothermally altered areas, producing debris flows that potentially impact vegetation, alluvial aquifers, and the Red River (K. Vincent, USGS, written commun., 2003). Winter snowpack contributes to ground water recharge through snowmelt infiltration and runoff.
Prevalent vegetation in the Red River Valley is controlled by elevation and includes four zones: pinyon-juniper woodland (from 1,829 to 2,286 m), mixed-conifer woodland (from 2,286 to 2,743 m), spruce-fir woodland (from 2,743 to 3,658 m), and alpine tundra (above 3,658 m) (Knight, 1990). Perennial grasses, shrubs, flowering vegetation, willows, and cottonwoods occur near the banks of the Red River. Extending from the river are widely spaced pinyon pines (Pinus edulis) and junipers (Juniperus monosperma). Gains in altitude give rise to an abundance of ponderosa pines (Pinus ponderosa) and limber pines (Pinus flexilis), while douglas-fir (Pseudotsuga menziesii) and white fir (Abies concolor) can be found at higher elevations (Briggs and others, 2003). This typical montane community, while diverse, is dominated by ponderosa pines.
Ground water passes through, and geochemically interacts with, the various types of earth materials discussed in this section, including fractured bedrock, soil and alluvium, and waste rock. This section summarizes the work of Schilling (1956), Rehrig (1969), Lipman (1981), and Meyer and Leonardson (1990, 1997), in addition to observations made by the USGS scientists working at the site.
The Taos Range of the Sangre de Cristo Mountains is composed of Precambrian metamorphic assemblages and granitic intrusives overlain by Tertiary volcanics. Late Oligocene to early Miocene granitic plutons and associated hydrothermal alteration were the source of molybdenite and other sulfide mineralization.
The Red River Valley is located along the southern edge of the Questa volcanic caldera and contains complex structural features and extensive hydrothermal alteration. In the Red River Valley, most of the visible rocks are Tertiary volcanics with smaller areas of Precambrian metamorphics and granitic stocks. The volcanics are primarily intermediate to felsic in composition (andesites to rhyolites); granites and porphyries have intruded the volcanics and are the apparent source of hydrothermal fluids and molybdenite mineralization. The hydrothermally altered volcanics often contain pyrite mineralization (generally 1-3 percent).
The mineral deposits in the Red River Valley are considered Climax-type deposits, which are associated with silica- and fluorine-rich rhyolite porphyry and granitic intrusives. Climax-type hydrothermal alteration produces zones of alteration assemblages, with a central zone of fluorine-rich potassic alteration, a quartz-sericite-pyrite zone (QSP), often with a carbonate-fluorite veinlet overprint, and a propylitic zone. Chlorite, epidote, albite, and calcite typically are found in the propylitic assemblages. In the potassic zone, rocks are altered to a mixture of biotite, potassium feldspar, quartz, fluorite, and molybdenite.
In the Red River Valley, ore deposits contain quartz, molybdenite, pyrite, fluorite, calcite, manganiferous calcite, dolomite, and rhodochrosite. Lesser amounts of galena, sphalerite, chalcopyrite, magnetite, and hematite also are present. The hydrothermal alteration related to mineralization overprints an older, regional propylitic alteration. In these areas, rocks can contain a mixture of quartz, pyrite, and illite clays replacing feldspars, chlorite, and epidote. Calcite is an important mineral in the Red River Valley because its dissolution can effectively neutralize the acid inflows so that pH values in the Red River tend to be neutral to alkaline (pH 7-8). Gypsum is commonly found throughout the Red River Valley and forms as a secondary product of acid-sulfate weathering when the products of pyrite oxidation react with calcite. Abundant minerals in waste rock produced by mining activities include chlorite, gypsum, illite, illite-smectite, jarosite, kaolinite, and muscovite (Gale and Thompson, 2001).
Scar-area bedrock outcrops are composed of andesite volcanic and volcaniclastic rocks, rhyolitic tuff, quartz latite, and rhyolite porphyry. The dominant alteration type in all scars is QSP; carbonates also are found in all scar areas. Most of the andesite and quartz latite has been propylitically altered and contains plagioclase feldspar and chlorite, with less QSP alteration. Rhyolite porphyry and tuff do not seem to have been substantially affected by propylitization. Depending on location within the weathering profile, altered rocks contain variable amounts of quartz, illite, chlorite, and plagioclase feldspar, with smaller amounts of pyrite, gypsum, rutile, jarosite, and goethite (Livo and Clark, 2002; Ludington and others, in press).
Ground water is influenced by the climate, geology, and anthropogenic activities in the Red River Valley. There are three major types of water-bearing units present: fractured bedrock, debris-fan deposits, and Red River alluvium. Bedrock constitutes the largest aquifer in the study area in terms of rock mass, but probably contains only small amounts of ground water because of low porosity and hydraulic conductivity that are controlled by fractures. Debris fans are composed of sediments shed from their watersheds, which are tributary to the Red River. Tributary watersheds with scars contain large, active debris fans with both coarse and fine-grained sediments and correspondingly variable porosity and infiltration rates. The chemistry of these sediments likely reflects the chemistry of their rapidly eroding and altered erosion scars. Sediments deposited by the Red River (alluvium), in contrast, generally consist of well washed sandy-gravel and are composed of a mix of the lithologies found in the entire Red River basin. The largest debris fans caused the Red River to aggrade behind the fans during the Quaternary. Thus water flowing in the shallow alluvial aquifers likely passes alternately through Red River alluvium and debris fan alluvium. Both the Red River alluvium and debris fan alluvium are less than several hundred meters wide and less than 60 m thick, but together they contain most of the ground water in the valley (K. Vincent, USGS, written commun., 2003).
While chemical analyses of ground water were not obtained prior to mining in the Red River Valley, a substantial amount of historical data are currently available (LoVetere and others, 2003). Alluvial, debris-fan, and shallow bedrock ground water is dominantly calcium-sulfate type water. Most wells developed in the Red River Valley were installed to monitor water quality down gradient from mine waste deposits (waste rock dumps and tailings piles) and/or scar areas.
The Red River originates at an elevation of approximately 3,658 m near Wheeler Peak and flows north and then westward for roughly 55 km to its confluence with the Rio Grande River at an altitude of 2,012 m. The drainage area upstream from the Questa Ranger Station gage is 293 km2. Peak streamflow usually occurs from late May to mid-June, with snowmelt-related flows beginning in late March and increasing through mid-April. Summer thunderstorms are prevalent from July through September. The mean annual discharge of the Red River at the Questa Ranger Station gage has ranged from 12.8 to 103 ft3/s between 1930 and 2001, while the average daily discharge ranged from 2.5 to 557 ft3/s, with an average of 42.9 ft3/s, between 1965 and 2001 (U.S. Geological Survey, 2003a).
The main drainages in the vicinity of the mine site are Capulin Canyon, Goat Hill Gulch, and Sulphur Gulch on the north side of the Red River (fig. 1). Upstream from the mine site, Little Hansen, Hansen, Straight, and Hottentot Creeks drain scar areas, while Mallette and Bitter Creeks drain non-scar areas on the north side of the Red River. Bear Canyon and Columbine, Pioneer, and Placer Creeks drain largely unmineralized land on the south side of the river. Downstream from the mine site the Red River joins with Cabresto Creek, entering from the north side of the Red River, before it discharges to the Rio Grande.
Springs and shallow alluvial ground water discharge to the Red River rendering it a gaining stream over much of its length (Smolka and Tague, 1989). Between the town of Red River and the Questa Ranger Station gage, there are roughly 25 ephemeral seeps and springs along the banks of the Red River and approximately 20 intermittent seeps and springs in tributary drainages on the north side of the river (South Pass Resource, Inc., 1995; Steffen, Robertson, and Kirsten, 1995; Robertson GeoConsultants, Inc., 2001). The majority of the seeps and springs are acidic (pH 2-4) with high specific conductance, total dissolved solids (TDS), and metal concentrations. Springs downgradient from scar and mined areas on the north side of the Red River often have a milky aluminum hydroxide precipitate that affects the color and turbidity of the Red River (Vail Engineering, Inc. 1989) (see cover photo).
The history of the Molycorp, Inc. mine site and other related information is available from Molycorp, Inc. (www.molycorp.com), NMED, and the U.S. Environmental Protection Agency (USEPA; www.epa.gov/superfund/sites/npl/nar1599.htm). The following is a summary of that information and other data that pertain to the study of surface water in the Red River Valley.
A pair of prospectors first discovered molybdenite in Sulphur Gulch in 1914. Small-scale underground mining took place between 1919 and 1958. In 1954 there were over 56 km of underground mine workings. Molycorp, Inc. began removing the rock overburden at Sulphur Gulch in 1964, and the first molybdenite ore was extracted from the open pit in 1965. Tailings were transported by pipeline from the mine to the tailings facility, located near the town of Questa, New Mexico, just upstream of the confluence of the Red River and the Rio Grande. More than 200 spills from the tailings pipeline occurred between 1964 and 1982 (URS, 2002). Water used in the mill operation was produced from the Red River and the Red River alluvial aquifer.
In 1983, Molycorp, Inc. ceased open-pit mining and initiated a new phase of underground mining in Goat Hill Gulch. The switch effectively stopped the dumping of waste rock in Capulin Canyon, along the north slope of the Red River, and in Goat Hill, Sulphur, and Spring Gulches, and increased the volume of tailings transported by pipeline to the impoundment in Questa. It is estimated that roughly 328 million tons of waste rock (295 million metric tons) were deposited near the open pit between 1964 and 1983 (Robertson GeoConsultants, Inc., 2000c; Slifer, 1996).
Low market values for molybdenum caused the mine to shut down between 1986 and 1989 and again in 1992. From 1992 to 1995, while the underground mine was shut down, pumping of ground water from the underground mine stopped, and the workings were allowed to flood. Point-source discharges from the tailings facility at Questa were monitored through a discharge permit issued by USEPA, and two discharge points for stormwater runoff from the mine site were added when the permit was renewed in 1993 (Slifer, 1996). A discharge permit for the mine site was issued in November 2000. The permit required quarterly sampling, which was initiated in June 2001. In 2002, Molycorp, Inc. and USEPA entered into an Administrative Order on Consent (AOC) to define the nature and extent of contamination from the mine site. Currently, Molycorp, Inc. is required to collect soil, rock, water, animal, and plant samples for the Remedial Investigation as defined in the AOC.
The authors wish to acknowledge Cheryl Naus for her assistance in preparing the map of the study area. Katie Walton-Day and Laura Bexfield of the USGS provided helpful technical reviews on a draft of the manuscript. Molycorp, Inc. provided documents and data on historical water quality. This report also would not have been possible without the support of the National Research Program.
Table 1. Red River monthly climate summary from January 1915 to December 2002.
| Average maximum temperature (ºC) | Average minimum temperature (ºC) | Average total precipitation (cm) | Average total snowfall (cm) | Average snow depth (cm) | |
|---|---|---|---|---|---|
| January | 2.5 | -15.4 | 2.7 | 50.8 | 22.9 |
| February | 4.1 | -13.3 | 2.9 | 54.1 | 22.9 |
| March | 6.7 | -9.7 | 4.5 | 74.4 | 17.8 |
| April | 12.0 | -5.6 | 4.4 | 55.4 | 5.1 |
| May | 16.9 | -1.8 | 4.4 | 18.5 | 0.0 |
| June | 22.6 | 1.8 | 3.2 | 0.3 | 0.0 |
| July | 24.4 | 4.9 | 7.4 | 0.0 | 0.0 |
| August | 23.2 | 4.6 | 8.0 | 0.0 | 0.0 |
| September | 20.4 | 0.9 | 4.2 | 1.3 | 0.0 |
| October | 14.8 | -3.8 | 3.8 | 21.1 | 0.0 |
| November | 7.2 | -9.9 | 3.4 | 47.0 | 5.1 |
| December | 3.1 | -14.4 | 2.9 | 48.3 | 15.2 |
| Annual | 13.2 | -5.2 | 52.0 | 370.0 | 7.6 |
Data source: Western Regional Climate Center, 2003.
For the purposes of this report, historical water-quality data are defined as those from samples collected on or before the November 12, 2001 sampling of Molycorp, Inc. The location with the longest period of record for water-quality data is the Questa Ranger Station gage on the Red River, where there has been continuous streamflow-gaging by the USGS since October 1, 1924. The USGS streamflow-gaging station (site number 08265000) is located downstream from the Molycorp, Inc. Mine in Questa, New Mexico (fig. 1). Because of the long-term water-quality and flow record, the historical surface-water data compilation has focused on the Questa Ranger Station gage. In addition, data from locations upstream from the mine site and downstream from natural scar areas are also included in the compilation.
The historical surface-water quality data for the Red River are contained in Federal and State agency reports, consultant reports, and on computer files or databases that are not associated with any report. One of the main purposes of compiling and evaluating the historical surface-water quality information is to gather all the available data in one document and to describe its quality to the extent possible. Vail Engineering, Inc., URS, and others, under contract to Molycorp, Inc., have compiled historical surface-water quality data in the past. However, not all parameters were reported, a comprehensive evaluation of the methods used to collect and analyze the samples was not conducted, geochemical interpretations were not included, and/or the data were not evaluated with respect to water flow dynamics. The more complete review and evaluation presented herein will aid in data comparison and analysis. For this report, original sources were reviewed for information on collection and analysis methods, and the data were gathered from these original sources. Once compiled and evaluated for quality, the historical surface-water quality data are useful for evaluating chemical, temporal, and spatial trends and for establishing an historical framework for comparing any recent surface-water quality data collected.
Water-quality sampling events, dates, parameters, and locations are presented in table 2. The U.S. Department of Health, Education, and Welfare (USHEW), the USEPA, and Molycorp, Inc. conducted water-quality sampling on the Red River, its tributaries, and the Rio Grande in the mid-1960's to the mid-1970's. NMED and Vail Engineering, Inc., under contract to Molycorp, Inc., collected the majority of the water-quality samples on the Red River and its tributaries in the 1980's and 1990's. The source of the data, and, if available, the reference for the report containing the data are listed in table 2. Table 2 shows that when metals were determined on Red River and tributary samples, the most common analyte suite was aluminum, iron, manganese, and zinc. For a number of sampling events, sulfate was the only anion determined. Flow was usually only available for samples collected at the Questa Ranger Station gage, although the USGS streamflow-gaging station located upstream from the town of Red River (Zwergle gage, site number 08264500, see fig. 1) operated from May 1, 1963 to December 31, 1973. Water-quality samples were collected from the Zwergle gage location on the Red River in 1997 and 1998 (Allen and others, 1999).
Sample collection, preservation and analysis methods, laboratories, and quality assurance/quality control (QA/QC) plans used for surface-water quality sampling are presented in table 2. When a document containing surface-water quality information was associated with the analytical data, it was reviewed for sample collection, preservation, analytical methods, and other quality-control issues. The references for the documents are listed in both tables 2 and 3, and full citations can be found in the reference section at the end of this report. For several documents and sampling events, not all QA/QC information was available; for these instances, the entries are indicated by two short dashes (--) in table 3.
In table 3, the collection methods column includes frequency of sampling for a given sampling event, whether samples were composited, whether replicate field samples were collected, where in the stream the samples were collected (for example, mid-depth), whether samples were collected by pump or grab, and whether the sampling was synoptic. Most of the samples collected before the mid-1980's were unfiltered (except for Faith, 1974). If samples collected before the mid-1980's were filtered, the filtration was for suspended sediment and metals, most notably suspended aluminum and iron. When filtering was conducted, 0.45-µm filters were used; no historical water-quality samples were filtered through 0.1-µm filters. Few samples were analyzed for both total and dissolved constituents, although limited samples collected after 1984 were analyzed for both. Similarly, preservation of samples was not common before the mid-1980's (again, Faith, 1974 is an exception to this). Unfortunately, Faith did not collect any samples at the Questa Ranger Station gage.
Table 3 also lists analytical methods used to determine metals and other parameters. Samples collected in the 1960's and early 1970's used colorimetric or flame atomic-absorption spectrometry (AAS) for determination of metals, and consequently, high detection limits were common. However, Faith, (1974) used graphite-furnace AAS for the determination of trace metals, iron and manganese. Standard Methods (American Public Health Association, 1981) and USEPA methods (U.S. Environmental Protection Agency, 1983) were used by New Mexico Department of Game and Fish (NMDGF) (Jacobi and Smolka, 1984; Smolka and Tague, 1987 and 1989; NMDGF, 1992 and 1993) since the mid-1980's. Allen and others (1999) of the University of New Mexico, was the only report in which inductively-coupled argon-plasma—mass spectrometry (ICP-MS) was used for determination of trace metals; other sampling efforts generally used inductively-coupled argon-plasma—atomic emission spectrometry (ICP-AES) for determination of trace and minor metals.
Chemical analyses of surface-water samples were conducted at commercial, government, and university laboratories. Very few of the sampling efforts included sampling plans or QA/QC plans, such as quality assurance project plans (QAPPs). However, sampling performed by New Mexico State agencies usually did include a sampling or QA/QC plan.
Table 2. Sampling events, dates, and analyses.
[Alk, alkalinity; App, appendix; assoc, associated; BLM, Bureau of Land Management; CG, campground; up, upstream; CN, cyanide; DIM, dissolved inorganic matter; diss, dissolved; DO, dissolved oxygen; DOC, dissolved organic carbon; DOM, dissolved organic matter; hard, hardness; down, downstream; ENSR, ENSR Consulting and Engineering; Inc.; FWPCA, Federal Water Pollution Control Authority; NMEID, New Mexico Environmental Improvement Division; NMED, New Mexico Environment Department; NM BMMR, New Mexico Bureau of Mines and Mineral Resources; NMDGF, New Mexico Department of Game and Fish; params, parameters; POTW, publicly-owned treatment works; RGC, Robertson GeoConsultants; SC, specific conductance; SPRI, South Pass Resources, Inc.; SRK, Steffen, Robertson, and Kirsten; T, temperature; TDS, total dissolved solids; TSS, total suspended sediment; trib, tributary; turb, turbidity; UNM, University of New Mexico; USEPA, U.S. Environmental Protection Agency; USGS, U.S. Geological Survey; WC, Woodward-Clyde Consultants; WWTF, waste water treatment facility; --, no data]
| Reference | Sample event dates | Collected by | Water-quality parameters | Flow measured with sampling | Locations | Special sampling events/analyses |
|---|---|---|---|---|---|---|
| FWPCA, 1966 | 11/3-8/1965 | FWPCA | Alk, As, Ca, Cl, Fe, Mg, NO3, Pb, pH, SC, SO4, TDS, TSS, Zn | Yes | Red River (5 locations) | None |
| Molycorp, Inc., 1979 | 1/31/1966 - 9/1979 | USGS, BLM, Molycorp, Inc. NMEID (outfalls) | Ca, Cd, Cu, F, Fe, Mg, Mo, Mn, SO4, TDS, TSS, Zn | Red River, fish hatchery, Red River mouth, outfalls | Red River (7 locations); Red River, fish hatchery; outfalls 001, 002, 003; wells below tailings dam | Tested for CN in Red River |
| USEPA, 1971 | 11/2-5/1970 | USEPA | Alk, Al, As, Ca, Fe, Mg, NO3, Pb, pH, SC, SO4, TDS, TSS, Zn | Yes | Red River (5 locations) | None |
| Pennak, 1972a | Surface water: June, July, Aug, Sept 30, Oct, Nov 1971; Jan 15, Feb 26, Mar 25, Apr 30 1972. Biology: May 17, June 23, July 28, Sept 3, Oct 8, Nov 14, 1971. | Pennak | Ag, As, B, Ba, Be, Bi, Cd, coliform, bacteria, Cr, Cu, CO3, DO, Ga, Ge, hard, Hg, La, Mn, Mo, Nb, Ni, Pb, pH, PO4, Se, SO4, T, turb, TSS, Zn | Yes | Red River (6 locations, not Ranger Station), mine drainage, Sulphur Gulch, tailings pond influent/effluent, Pope Lake, north drainage, 2 wells. Biology: 4 Red River, 1 Pope Creek (settling pond effluent) | In some cases sampled immediately after a storm event or tailings break. |
| Pennak, 1972b | 10/8-9/1971 | Pennak | DO, DIM, DOM, "free/bound CO2," imbeddedness, pH, T, TSS, turb | No | Red River: Molycorp, Inc. line; Eagle Rock CG; Pope Creek; fish hatchery. Pope Creek (settling pond effluent) | None |
| Pennak, 1976 | 10/5-6/1976 | Pennak | DO, DIM, DOM, "free/bound CO2," imbeddedness, pH, T, TSS, turb | No | Red River: Molycorp, Inc. line; Eagle Rock CG; Goat Hill CG; Pope Creek; State Fish Hatchery. Pope Creek (settling pond effluent) | Compared to October 8-9, 1971 sampling (in Pennack, 1972), which occurred the day after a tailings break. |
| Pennak, 1977a | 3/12-13/1977 | Pennak | DO, DIM, DOM, "free/bound CO2," imbeddedness, pH, T, TSS, turb | No | Red River: Molycorp, Inc. line; Eagle Rock CG; Goat Hill CG; Pope Creek; State Fish hatchery. Pope Creek (settling pond effluent). | March 1977 sampling in response to March 8 tailings breaks. |
| Pennak, 1978a | 3/29-30/1978 | Pennak | DO, DIM, DOM, "free/bound CO2," imbeddedness, pH, T, TSS, turb | No | Red River: Molycorp, Inc. line; Eagle Rock CG; Goat Hill CG; Pope Creek; State Fish hatchery. Pope Creek (settling pond effluent). | No chemical data—results similar to earlier samplings. Macroinvertebrate density given. |
| Pennak, 1978b | 3/29-30 and 7/25-26/1978 | Pennak | DO, DIM, DOM, "free/bound CO2," imbeddedness, pH, T, TSS, turb | No | Red River: Molycorp, Inc. line; Eagle Rock CG; Goat Hill CG; Pope Creek; State Fish hatchery. Pope Creek (settling pond effluent). | 26 July 1978: "extremely heavy pollution load" observed at Station 1—no rain, assumed light tan particles from streamside construction upriver. |
| Pennak, 1979 | 8/5-6 and 9/9-10/1979 | Pennak | DO, DIM, DOM, "free/bound CO2," imbeddedness, pH, T, TSS, turb | No | Red River: Molycorp, Inc. line; Eagle Rock CG; Goat Hill CG; Pope Creek; State Fish hatchery (up/down); mouth of Red River. Pope Creek (settling pond effluent). | Highest runoff in 40 years in spring/summer 1979. |
| Pennak, 1981 | 7/18-19/1981 | Pennak | DO, DIM, DOM, "free/bound CO2," imbeddedness, pH, T, TSS, turb | No | Red River: Molycorp, Inc. line; Eagle Rock CG; Goat Hill CG; Pope Creek; State Fish hatchery (up/down); mouth of Red River. Pope Creek (settling pond effluent). | 1981 runoff below normal. Tailings still embedded but better than 1979. Goat Hill and Eagle Rock locations only continuing "problems." |
| Pennak, 1983 | 10/20-22/1982 | Pennak | DO, DIM, DOM, "free/bound CO2," imbeddedness, pH, T, TSS, turb | No | Red River: Molycorp, Inc. line; Eagle Rock CG; Goat Hill CG; Pope Creek; State Fish hatchery (up/down); mouth of Red River. Pope Creek (settling pond effluent). | No macroinverts collected at Station 7 (0.4km upstream of Rio Grande)—river too deep. Pope Creek not sampled - dry. Quintuplicate macroinvertebrate samples taken. |
| Pennak, 1984 | 10/18-20/1983 | Pennak | DO, DIM, DOM, "free/bound CO2," imbeddedness, pH, T, TSS, turb | No | Red River: Molycorp, Inc. line; Eagle Rock CG; Goat Hill CG; Pope Creek; State Fish hatchery (up/down); mouth of Red River. Pope Creek (settling pond effluent). | Big and Little Arsenic Springs (Rio Grande 2-3 mi upstream of Red River)—results in separate report Dec 1983. |
| Faith, 1974 | 6/4-6/1974 | Faith | Al, Alk, Ca, Cl, Cu, Eh, Fe, K, Mg, Mo, Mn, Na, Ni, pH, SO4, Sn | Yes | Red River (not Ranger Station) | Spatial (horizontal across stream) and temporal (diel) variability examined |
| USEPA, 1983 | 9/5-14/1980 | USEPA | Alk, Ag, Al, As, Cd, Cr, Cu, DO, Ni, NO3, Pb, pH, SC, TDS, TOC, TSS, turb, Se, Zn | No | Red River (8 locations, not including Ranger Station) | None |
| Jacobi and Smolka, 1984 | 1/25-27/1984 | NMED | Ag, Al, Alk, As, Ba, Cd, Cr, Cu, DO, Hg, K, Mg, Mo, Mn, Na, Ni, NO3, Pb, pH, SC, Se, SO4, T, TDS, turb, TSS, Zn | No | Red River (7 locations), Cabresto Creek, Red River POTW | None |
| Garn, 1985; USGS, 2003b | 10/17/78–12/24/86 | USGS | Alk, Ca, Cd, Cl, Cu, CN, DOC, F, Fe, K, Mg, Mn, Mo, Na, nutrients, pH, SC, SO4, TDS, TSS, Zn | Yes | Red River (7 locations), Cabresto Creek | None |
| Smolka and Tague, 1987 | 2/27/86, 8/18-21/1986 | NMED | Ag, Al, Alk, As, Ca, Cd, Cr, Cu, Fe, Hg, K, Mg, Mo, Mn, Na, Ni, Pb, pH, SC, Se, SO4, TDS, turb | No | Red River (4 locations), Rio Grande, Cabresto Creek | Runoff event Aug 18, 1986 in arroyo and at WWTF |
| Smolka and Tague, 1989 | 3/25/1988 | Smolka and Tague | Ag, Al, As, Ba, Cd, Cr, Cu, Fe, Hg, Mo, Mn, Ni, Pb, pH, SC, Se, TDS, TSS, turb, Zn | No | Red River (8 locations), Goose Creek, Bitter Creek, Pioneer Creek, Columbine Creek | Rainstorm event Bitter Creek—total and diss metals; seepage study from Zwergle Dam and Ranger Station |
| USEPA, 1988 | ~9/21/1988 | USEPA | Alk, Cl, hard, NH3, pH, salinity, SC | No | Red River (5 locations, including Ranger Station), Bitter Creek | 24-hr bioassays with adult Daphnia pulex and fathead minnow embryos (<18-hr old); chemistry results are from day 0 of tests |
| ENSR, 1988 | 10/10-12/1988 | ENSR | Al, Alk, Ba, Cd, Cl, Cu, DO, Fe, Mo, Mn, Pb, pH, SC, SO4, T, TDS, TSS, turb, Zn | No | 7 stations on Red River (Including Ranger Station), 1 on Pope Creek. | Benthic and algal populations, density, diversity, benthic community indices |
| NMDGF, 1992 | 4/9/1991 | NMED | Ag, Al, Alk, As, B, Ba, Be, Ca, Cd, chl-a,b,c, Cl, Co, Cr, Cu, DO, Fe, Hg, K, Mg, Mo, Mn, Na, Ni, NO3, Pb, pH, PO4, SC, Se, Si, SO4, Sr, T, TDS, turb, V, Zn | No | Fawn and Eagle Rock Lakes | None |
| Smolka and Tague, 1989 | 9/13-26/1988, 10/25/1988 | NMED | Ag, Al, Alk, As, Ba, Cd, Cr, Cu, Fe, Hg, K, Mg, Mo, Mn, Na, Ni, Pb, pH, SC, Se, SO4, TDS, turb, TSS, Zn | No | Red River (6 locations), Columbine Creek, Rio Grande | None |
| Vail Engineering, Inc., 1989 | 11/4/65, 11/4/70, 8/20/81, 7/26/88, 11/29/1988 (11/29/88 also in App. I Vail 1993) | Vail Engineering, Inc. | Al, As, Fe, Mn, Pb, Zn (11/20/88 only); Alk, F, pH, SO4, TDS, turb, TSS | Ranger Station only | Red River (14 locations), Pioneer Creek, Columbine Creek, Eagle Rock Lake | 7/26/88—short thunderstorm |
| NMDGF, 1993 and USEPA, 2003 | 2/26–12/16/1992 | NMED | Ag, Al, As, Ba, Be, Cd, Co, Cr, Cu, Fe, Hg, Mo, Mn, Ni, Pb, Se, Sn, Sr, V, Zn (2/26, 3/25, 4/29 only); Alk, Ca, Cl, K, Mg, Na, NO3, pH, SC, SO4, TDS, turb, TSS | No | Red River (8 locations) | None |
| Vail Engineering, Inc., 1993 | 7/25/1992 | Molycorp | Al, Ca (limited), Cd, Cu, F, Fe, Mg, Mo, Mn, Pb, pH, SO4, TDS, TSS, Zn | Yes | Red River (17 locations), Eagle Rock Lake, Columbine Creek | Rainstorm event July 25, 1992 |
| Vail Engineering, Inc., 1993 | 10/22/1992 | Vail Engineering, Inc. | Al, Alk, F, Fe, Mn, pH, SC, SO4, TDS, turb, TSS, Zn | Yes | Red River (17 locations), Columbine Creek | None |
| Vail Engineering, Inc., 1993 | 2/16/1993 | Molycorp | Al, Alk, F, Fe, Mn, pH, SC, SO4, TDS, TSS, Zn | Yes | Red River (11 locations) | None |
| Vail Engineering, Inc., written commun., 2002 | 11/10/1993 | Vail Engineering, Inc. | Al, Alk, F, Fe, Mn, pH, SC, SO4, TDS, TSS, Zn | Ranger Station only | Red River (21 locations), Columbine Creek | None |
| URS, 2001 | 11/1993 | Vail Engineering, Inc. | Al, Cu, Fe, Mn, SO4, Zn | No | Red River | None |
| Vail Engineering, Inc., written commun., 2002 | 2/11/1994 | Molycorp, Inc. | Al, Alk, F, Fe, Mn, pH, SC, SO4, TDS, TSS, Zn | Ranger Station only | Red River (12 locations) | None |
| Woodward-Clyde Consultants, 1996a | 4/18-27/1994, 6/26-28/94, 11/7-8/1994, 5/9/1995 | NMED | Ag, Al, As, Ba, Be, Ca, Cd, Co, Cr, Cu, Fe, Hg, K, Mg, Mn, Ni, Pb, pH, Sb, SC, Se, T, Tl, V, Zn | No | Red River (7 locations—not Ranger Station), Columbine Creek, 5 seeps | None |
| SPRI, 1995 | 5/15/94, 10/13/1994 | Vail Engineering, Inc. | Al, Alk, Ca, Cd, Cl (5/15 only), Cu, F, Fe, K, Mg, Mo, Mn, Na, Pb, pH, SC, SO4, TDS, TSS, Zn | Ranger Station only | Red River (22 locations), Bitter Creek, Hansen Creek, Columbine Creek, Cabin Spring | None |
| Woodward-Clyde Consultants, 1994; Kent, 1995 | 6/26/1994 | Woodward-Clyde Consultants (field parameters); NMED | Al, Alk, Ba, Ca, Co, Hg, Mg, Mn, NO3, Pb, pH, SC, SO4, TDS, TOC, TSS, Zn | No | Red River (3 locations), Capulin Canyon drainage, Hansen Creek, Goathill seep | None |
| Molycorp, Inc. written commun., 2002 | 6/27/1994 | Unknown | Ag, Al, Alk, Ba, Be, Ca, Cd, Co, Cr, Cu, Fe, Hg, K, Mg, Mo, Mn, Ni, NH3, Pb, Sb, Se, Tl, V, Zn | No | Red River (7 locations), SP-10, SP-8, SP-9, SS-3, SS-4, SS-5, SS-6 | None |
| Woodward-Clyde Consultants, 1994 | 6/26-28/1994 | NMED | Ag, Al, As, Ba, Be, Ca, Cd, Co, Cr, Co, Cu, Fe, Hg, K, Mg, Mn, Ni, Pb, pH, Sb, SC, Sb, Se, T, Tl, V, Zn | No | Red River (7 locations—not Ranger Station), Columbine Creek, 5 seeps | None |
| Woodward-Clyde Consultants, 1996a; Vail Engineering, Inc., written commun., 2002; Kent, 1995 | 11/7-8/1994 | NMED | Ag, Al, Alk, As, Ba, Be, Cd, Co, Cr, Cu, Fe, Hg, Mg, Mo, Mn, Ni, Pb, pH, Sb, SC, Se, SO4, TDS, Tl, TSS, V, Zn | 6 locations on Red River | 9 Red River locations (not Ranger Station), Columbine Creek | None |
| URS, 2001 | 1994-99 | Molycorp, Inc. NMED, SRK, RGC | Ag, Al, Alk, As, Ba, Be, Ca, Cd, Cl, Co, Cr, Cu, F, Fe, Hg, Mg, Mn, Mo, Ni, NO2, NO3, Pb, pH, Sb, SC, Se, TDS, Tl, TOC, TSS, V, Zn | No | Red River | Acid base accounting, shake flask, paste pH, mine rock analysis, leach tests, rinse pH/SC |
| Vail Engineering, Inc., written commun., 2002 | 2/14/1995 | Vail Engineering, Inc. | Al, Alk, F, Fe, Mn, pH, SC, SO4, TDS, TSS, Zn | Ranger Station only | Red River (22 locations), Columbine Creek, Cabin Springs | None |
| Woodward-Clyde Consultants, 1996b | 11/9/1995 | Vail Engineering, Inc., WC | Ag, Al, Alk, As, Ba, Be, Ca, Cd, Cl, Co, Cr, Cu, F, Fe, Hg, K, Mg, Mn, Mo, Na, Ni, NO3, Pb, pH, Sb, SC, Se, SO4, TDS, Tl, TSS, turb, V, Zn | Ranger Station only | Red River (20 locations), Bitter Creek, Hansen Creek, Hottentot, Columbine Creek, mine water, 4 springs | None |
| Vail Engineering, Inc., written commun., 2002 | 2/26/1996 | Vail Engineering, Inc. | Al, F, Mg, Mn, pH, SC, SO4, Zn | Ranger Station only | Red River (21 locations), Portal Spring, Columbine Creek, Cabin Springs, Cabresto Creek | None |
| Vail Engineering, Inc., written commun., 2002 | 11/5/1996 | Vail Engineering, Inc. | Al, Mg, Mn, pH, SC, SO4, Zn | No | Red River (20 locations), Hansen Creek, Columbine Creek, 5 springs | None |
| Vail Engineering, Inc., written commun., 2003 | 3/13/1997 | Vail Engineering, Inc. | Al, Mg, Mn, pH, SC, SO4, turb, Zn | Ranger Station, Hansen, springs only | Red River (24 locations), Hansen Creek, Columbine Creek, 6 springs, Cabresto Creek, Sawmill Creek, 4 wells | None |
| Allen and others, 1999 | 13/5 dates for 3/2 locations between 6/10/97 and 7/16/98 | NM BMMR, UNM | Al, Alk, Ca, Cd, Cl, Co, Cu, DO, Eh, F, Fe, K, Mg, Mn, Na, Ni, NO3, pH, SC, SO4, T, Zn | Yes | Red River (5 locations—not Ranger Station), Columbine Creek | None |
| Allen and others, 1999 | 2/21/98, 7/16/98, 10/22/1998 | NM BMMR, UNM | Al, Co, Cu, Fe, Mn, Mo, Ni, Zn | No | 6 Red River locations | Sediment grab samples |
| Allen and others, 1999 | 7 dates between 8/14/97 and 4/29/98, 9/19/97, 6/4/98 | NM BMMR, UNM | Al, Co, Cu, Fe, Mn, Mo, Ni, Zn | No | 5 Red River locations, Eagle Rock, Fawn Lakes | Sediment trap samples |
| Allen and others, 1999 | 9/19/97, 7/16/98, 10/22-23/98 | NM BMMR, UNM | Al, Co, Cu, Fe, Mn, Mo, Ni, Zn | No | 4 Red River locations | Terrace sediment samples |
| Allen and others, 1999 | 1/1998 | NM BMMR, UNM | Al, Co, Cu, Fe, Mn, Mo, Ni, Zn | No | Eagle Rock, Fawn Lakes | Sediment core samples |
| Allen and others, 1999 | 8/15/97–10/23/98 | NM BMMR, UNM | Al, Co, Cu, Fe, Mn, Mo, Ni, Zn | No | Capulin Canyon, Hansen Creek, Columbine Creek, Goathill Gulch, 2 Red River locations | Crust, cement, sediments assoc with scar areas |
| Allen and others, 1999 | 1997/1998 | NM BMMR, UNM | Mn, Cu, Zn | No | 5 Red River locations | Tree ring samples |
| Vail Engineering, Inc., written commun., 2002 | 6/10/97–7/16/98 | Vail Engineering, Inc. | Al, Fe, Mn, Zn | Ranger Station only | Red River (6 locations; Ranger Station has flow but no chemistry), Columbine Creek | None |
| Vail Engineering, Inc., written commun., 2002 | 7/21/1997 | Vail Engineering, Inc. | Al, Alk, Mg, Mn, pH, SC, SO4, turb, Zn | No | Red River (24 locations), Hansen Creek, Columbine Creek, Bear Creek, 6 springs, 3 wells | None |
| Vail Engineering, Inc., written commun., 2002; URS, 2001 | 9/9/1997 | Vail Engineering, Inc., URS (flow only) | Alk, F, Fe, Mg, Mn, pH, SC, SO4, TDS, TSS, turb, Zn | Ranger Station (URS), Hansen Creek (estimated) | Red River (25 locations), Hansen Creek, Columbine Creek, Bear Creek, Mallette Creek, 4 springs, 4 wells | None |
| Vail Engineering, Inc., written commun., 2002; URS, 2001 | 11/3/1997 | Vail Engineering, Inc., URS (flow only) | Al, F, Mg, Mn, pH, SC, SO4, Zn | Ranger Station (URS) | Red River (19 locations, 15 field params only), Hansen Creek, Cabin Springs, mine water, 3 wells | None |
| Vail Engineering, Inc., written commun., 2002; URS, 2001 | 3/9/1998 | Vail Engineering, Inc., URS (flow only) | Al, F, Mg, Mn, pH, SC, SO4, Zn | Ranger Station (URS) | Red River (22 locations, only 6 with metals, Columbine Creek, 5 springs, mine water, 5 wells | None |
| Vail Engineering, Inc., written commun., 2002 | 4/30/1998 | Vail Engineering, Inc. | Cu, F, hard, Mn, pH, SC, SO4, TSS, Zn | No | Red River (21 locations, 5 field params only), Bitter Creek, Columbine, Mallette Creek, 4 springs, mine water, 3 wells | None |
| Vail Engineering, Inc., written commun., 2002 | 8/27/1998 | Vail Engineering, Inc. | pH, SC | Borehole only | Hansen Creek, Hansen trib, borehole | None |
| Vail Engineering, Inc., written commun., 2002 | 10/20/1998 | Vail Engineering, Inc. | Al, Zn, Mo, Cu (Red River and wells only); F, pH, SC, SO4 | 10 Red River stations, Columbine, Bear Creek | Red River (24 locations, only 3 with metals), Columbine Creek, 2 wells, Bear Creek | None |
| Vail Engineering, Inc., written commun., 2002 | 2/25/1999 | Vail Engineering, Inc. | pH, SC, SO4, turb | No | Red River (23 locations); 2 springs, Columbine Creek, mine water (pH, SC only) | None |
| Vail Engineering, Inc., written commun., 2002 | 9/27/1999 | Vail Engineering, Inc. | SC | No | Red River (17 locations), Columbine Creek, 6 wells | None |
| Vail Engineering, Inc., written commun., 2002; Vail Engineering, Inc., 2000; URS, 2001 | 10/13/1999 | Vail Engineering, Inc., URS (flow only) | Mn, Al, Zn (6 Red River, 3 springs, 4 wells); F, Mg, pH, SC, SO4 | 8 Red River stations, Columbine Creek, South Ditch | Red River (23 locations), Columbine Creek, Mallette Creek, Pioneer Creek, 3 springs, 6 wells | None |
| Vail Engineering, Inc., written commun., 2002; URS, 2001 | 3/15/2000 | Vail Engineering, Inc., URS (flow only) | Al, F, Mg, Mn, pH, SC, SO4, turb, Zn | 13 Red River stations, Columbine Creek | Red River (22 locations), Columbine Creek, Bear Creek, 5 springs, 4 wells, mine water | None |
| Kent, 1995 | 6/26-27/94, 11/7-8/1994 | NMED | Ag, Al, As, Ba, Be, Ca, Cd, Co, Cr, Co, Cu, Fe, Hg, K, Mg, Mn, Ni, Pb, pH, SC, Sb, Se, T, Tl, V, Zn | No | Red River (7 locations—not Ranger Station), Columbine Creek, 5 seeps | None |
| RGC, 2000c | 3/24/00–11/06/00 | RGC | Ag, Al, Alk, As, Ba, Be, Ca, Cd, Cl, Co, Cr, Cu, F, Fe, K, Mg, Mn, Mo, Na, Ni, NO3, Pb, pH, Sb, SC, Se, SO4, T, Tl, TDS, TSS, V, Zn | Yes | Red River (15 locations); Bitter, Columbine, Hottentot, Straight, Little Hansen, Pioneer, Capulin creeks; springs; wells; mine water | Diurnal variability Straight, Hansen Creek. (Apr 16, 2000). Season trends, thunderstorm events (7/18/00 and 8/6/00) |
| Medine, 2000; Molycorp, Inc. written commun., 2002 | 5/1-12/2000 | Unknown | Al, Alk, Ca, Cd, Cl, Co, Cu, F, Fe, K, Mg, Mn, Mo, Na, Ni, NO3, Pb, pH, SC, SO4, TDS, TSS, Zn | 9 Red River locations, Bitter Creek, Columbine Creek | Red River (10 locations), Bitter Creek, Columbine Creek, 1 seep | None |
| Vail Engineering, Inc., written commun., 2002 | 9/6/2000 | Vail Engineering, Inc. | Al, Mn, Zn (6 Red River, 1 spring, 3 wells); F, pH, SC, SO4 | 16 Red River, Columbine Creek, Pioneer Creek | Red River (23 locations), 1 spring, Columbine Creek, Pioneer Creek, 3 wells | None |
| Vail Engineering, Inc., written commun., 2002 | 11/3/2000 | Vail Engineering, Inc. | Al, Zn (6 Red River, 4 wells); Alk, F, pH, SC, SO4 | 13 Red River stations, Columbine Creek | Red River (23 locations), Columbine, 4 wells | None |
| Vail Engineering, Inc., written commun., 2002 | 2/20/2001 | Vail Engineering, Inc. | Al, Cu, Mn, Mo, Zn (9 Red River, 2 springs); F, Mg, pH, SC, SO4, TDS | 13 Red River stations, Columbine Creek, Mallette Creek | Red River (17 locations), Columbine Creek, Mallette Creek, 3 springs, 3 wells | None |
[AAS, atomic absorption spectrometry; alk, alkalinity; APDC, ammonium pyrrolidine dithiocarbamate; APHA, American Public Health Association; CLP, contract laboratory procedure; EDTA, ethylenediaminetetraacetic acid; EMSL-LV, Environmental Monitoring Systems Laboratory, Las Vegas; ENSR, ENSR Consulting and Engineering; EP, extraction procedure; FWPCA, Federal Water Pollution Control Authority; GFAAS, graphite furnace atomic absorption spectrometry; HDPE, high-density polyethylene; hard, hardness; ICP-AES, inductively-coupled argon-plasma—atomic emission spectrometry; ICP-MS, inductively-coupled argon-plasma—mass spectrometry; Lab., laboratory; NMDGF, New Mexico Department of Game and Fish; NMEID, New Mexico Environmental Improvement Division; µg/L, micrograms per liter; NMED, New Mexico Environment Department; µm, micrometer; QAPP, quality assurance project plan; QA/QC, quality assurance/quality control; refrig, refrigerated; RGC, Robertson Geoconsultants; TAL, target analyte list; TDS, total dissolved solids; TSS, total suspended solids; UCLA, University of California at Los Angeles; UNM, University of New Mexico; USGS, U.S. Geological Survey; USEPA, U.S. Environmental Protection Agency; --, no information]
| Reference | Collection methods | Filtered | Preservation | Laboratory methods | Laboratory | QAPP | Comments |
|---|---|---|---|---|---|---|---|
| FWPCA, 1966 | Grabs every 9 hrs, composited at 2-hr intervals, composited 3 8-hr interval samples | No | -- | APHA, 1965. SO4: turbidimetric; hard: EDTA titration; Fe, Zn, As, Pb: colorimetric | New Mexico State Public Health Lab, Albuquerque, New Mex. | No | High detection limits for Pb, Zn |
| USEPA, 1971 | Composite samples: every 2 hrs for 8 hrs; 1 24-hr sampling in 3 8-hr segments. Bacteriological: collected in sterile, glass bottles. Surber sampler, sieving for macroinvertebrates. | TDS only | Bacteria: ice; macroinvertebrates: 5% formalin. | APHA, 1971. Fe, Pb:colorimetric, Zn:AAS, Total, fecal coliform, fecal streptococci. Benthics hand-picked and sugar flotation technique, keyed, classed as clean water, facultative, or tolerant. | New Mexico State Health Department Laboartory, Albuquerque, New Mex. | No | -- |
| Pennak, 1972a and 1972b | No information on water methods; macroinvertebrates: Surber sampler; periphyton scraped from rock with sharp scalpel for 5-10 minutes from 3-8 rocks/location. | Assume unfiltered | Periphyton: formalin. | Ag, As, B, Ba, Cl, CN, Mo, NO3, Se, PO4-colorimetric; Hg-cold vapor; Ba, Cl-titration; Cd, Pb-APDC extraction/flame AAS; Cr, Cu, Fe, Mn, Zn-flame AAS; sulfate, TSS-gravimetric. USEPA 1979; APHA, 1971; Brown and others, 1970 | Geolabs, a division of Natural Resources Laboratory, Inc., Lakewood, Colo. | No | High detection limits for colorimetric methods. Data available only for Sept 1971 and all dates in 1972. |
| Faith, 1974 | -- | 0.45-µm | HNO3 | SO4: gravimetric; Cl: HgNO3 titration; Na, K, Mg: AAS; Ca: EDTA titration; Fe, Mn, Al, Cu, Ni, Sn: GFAAS; Mo, SiO2: colorimetric; filter residue digested. | Assume New Mex. Institute of Mining and Technology | No | -- |
| Pennak, 1976 | -- | Suspended sediment samples only | -- | -- | -- | No | More focus on benthics than water quality. No metals determined. Also sampled on 17 May 1971. |
| Pennak, 1977a | -- | Suspended sediment samples only | -- | -- | -- | No | -- |
| Pennak, 1978a | -- | Suspended sediment samples only | -- | -- | -- | No | Assumes "thin yellowish-tan chemical deposit" above the Eagle Rock from Molycorp, Inc. operations (p. 1). Noted reduction in macroinvertebrates at Eagle Rock, some coated with precipitate (p. 2). |
| Pennak, 1978b | -- | Suspended sediment samples only | -- | -- | -- | No | Now state yellowish-tan chemical deposit is naturally-occurring. Note improvement in 1978 conditions. |
| Molycorp, Inc, 1979 | -- | Some dissolved measurements; assume pore size 0.45-µm | -- | -- | Outfall samples by State Scientific Laboratory and University of Colorado's Molybdenum Project in Boulder, Colo. | No | Monthly record of flow, Cu, Zn at fish hatchery from 1/31/66–4/27/99 and Red River mouth from 1/4/66–5/14/69. In outfall 001, 002, 003 flow, CN. Outfall 001 (decant water tailings) permit violations for CN, F, Fe, foam; 002 for Mn. High Mo concs in outfalls 001, 002 (1,430- 3,200 µg/L) in 1975. High Mo concs up/downstream hatchery in late '70s (BLM data). |
| Pennak, 1979 | -- | Suspended sediment samples only | -- | -- | -- | No | Productivity in 1979 very low compared to other years. Natural stream "catastrophe" of much greater magnitude than man-made events (p. 11). |
| Pennak, 1981 | -- | Suspended sediment samples only | -- | -- | -- | No | More species found at most locations. The stream is now in "better biological shape" than at any previous time sampled. |
| Melancon and others, 1982 | Triplicate grabs at mid depth; automatic sampler: 24-hr composites at 1-hr intervals for metals (eight 3-hr composities) | 0.45-µm | ICP-AES metals: Ultrex HNO3; see Table 4 for volumes, preservation; Table 3 for specifications; Table 5 for methods, precision/ac-curacy | ICP-AES | UCLA—metals Biomedical and Environmental Science Lab.; EMSL-LV for field params | No | Arsenic data questionable for intended use; high Cd and Ag detection limits. |
| Pennak, 1983 | -- | Suspended sediment samples only | -- | -- | -- | No | 1982 summer frequent/heavy rains—flows in Oct ~2x "normal," similar to 1979 summer; lowest variability in pH (7.5-7.7) at all stations; macroinvertebrate species slowly increasing. |
| Pennak, 1984 | -- | Suspended sediment samples only | -- | -- | -- | No | Highest, longest spring runoff sampled; Red River warmer than usual; substrate had higher % rubble, small rubble (1-4 in.) reduced; formed sand and gravel bars. |
| Jacobi and Smolka, 1984 | 1-L polyethylene cubitainers cleaned in 10% v/v HCl, pre-rinsed with sample water. Surface water collected 6x during a 45-hr period beginning on Jan 25, 1984; chain-of-custody used. | No | H2SO4 for PO4 and nitrate; TSS,TDS refrig; Mg, Na, K, Cl, SO4, HCO3, alk refrig (no acid); As, Ba, Cd, Pb, Hg, Mo, Se, Zn HNO3+ice | APHA, 1975; USEPA, 1979 | Scientific Laboratory Division, Albuquerque | NMEID, 1982 | -- |
| Smolka and Tague, 1987 | Turb: 250-mL clean polypropylene bottles; 1-L polyethylene cubitainers for nutrients, TSS, TDS, major cations/anions, trace metals; pre-rinsed with sample water; chain-of-custody forms used. | Mg, Ca, K, Na dissolved; 2/27/86 sample total and dissolved metals | Nutrients: H2SO4, 4°C; anions: 4°C; turbidity: 4°C; metals: HNO3; CN: pH 12, NaOH | USEPA, 1979; USEPA, 1982 | Scientific Laboratory Division, Albuquerque | NMEID, 1986 | -- |
| USEPA, 1988 | -- | No | On ice at 4°C | No information given; bioassays: USEPA Method EPA/600/4-85/013 | Inorganic Laboratory, USEPA, Houston, Region VI | No | Results from day 0 of bioassay tests |
| ENSR, 1988 | Surface water: 1-L containers, mid-depth in thalweg; Macroinvertebrates: Surber sampler or net; rocks scraped with pocket knife. | Suspended sediment and dissolved | On ice, acidified to pH 2 with HNO3 at lab; periphyton preserved with 5% formalin | Detection limits (µg/L) = Cd 5; Pb 50; Mo 20; Cu 10; Al 500, Ba 500. No information on methods. | Molycorp, Inc. 's on site analytical laboratory for surface water | No | High detection limit for Pb |
| Smolka and Tague, 1989 | Turb: 250-mL clean polypropylene bottles; TSS, TDS, major cations/anions, trace metals: 1-L polyethylene cubitainers. | 0.45-µm Millipore | Nutrients: H2SO4, 4°C; anions: 4°C; turbidity: 4°C; metals: HNO3; CN: pH 12, NaOH | Turb: Hach 2100A Turbidimeter; seds screened through 2-µm screen: EP Toxicity test; others same as Smolka and Tague, 1987; APHA, 1976; USEPA, 1979 | Scientific Laboratory Division, Albuquerque | NMEID, 1986 | -- |
| Vail Engineering, Inc., 1989 | 17 samples over a 12-mile segment of river—synoptic over 4 hours. | Yes; assume 0.45-µm | NA | NA | Assay Laboratory at Questa Mine | No | -- |
| NMDGF, 1992 | Turb: 250-mL clean polypropylene bottles; Nutrients, TSS, TDS, major cations/anions, trace metals: 1-L polyethylene cubitainers; fish, macroinvertebrates, diatoms sampled. | Filtered (assume 0.45-µm) and unfiltered samples | Nutrients: H2SO4, 4°C; anions: 4°C; turbidity: 4°C; metals: HNO3 | USEPA, 1979; USEPA, 1982 | Scientific Laboratory Division, Albuquerque | NMEID, 1991 | Only in Fawn Lake and Eagle Rock Lake—fed by water from Red River |
| NMDGF, 1993 | Turb: 250-mL clean polypropylene bottles; nutrients, TSS, TDS, major cations/anions, trace metals: 1-L polyethylene cubitainers. | Yes; assume 0.45-µm | Nutrients: H2SO4, 4°C; anions: 4°C; turbidity: 4°C; metals: HNO3 | USEPA, 1979; USEPA, 1982 | Scientific Laboratory Division, Albuquerque | NMEID, 1991 | -- |
| Vail Engineering, Inc., 1993 | -- | Al only | -- | -- | Assay Laboratory at Questa Mine | No | -- |
| Woodward-Clyde Consultants, 1994 | Collected splits from NMED (June 1994)—pre-preserved sample bottles | Same as Kent, 1995 | Same as Kent, 1995 | Same as Kent, 1995 | ETC Northwest, Redmond, Wash. | CLP methods, TAL list | Field observations of NMED June 1994 sampling event, review of Kent, 1995 |
| Kent, 1995 | 1-L HDPE bottles, 250-mL beaker, plastic scoop, or tygon tubing for collecting seep water; split with Woodward-Clyde Consultants Decontaminated beakers with Alconox between samples; used chain of custody; measured pH with litmus paper; duplicate/blank samples. | Yes (assume 0.45-µm); did not decontaminate with HNO3 between samples | HNO3 to pH 2 for TAL list, H2SO4 for general chem, on ice | CLP for TAL list; Alk: SM2320B; NH3: EPA 350.2; Cl: EPA 325.3; COD: EPA 410.4; NO3/NO2: EPA 353.2; PO4/P: EPA 365.3; SO4: EPA 375.4; TDS/TSS: EPA160.1/160.2; DOC: EPA 9060 | Silver Valley Labs, Kellogg, Idaho | CLP methods, TAL list. Work plan: NMED 1991. | Blew into 4-L cubitainers before filling; did not decontaminate filtration device between samples |
| SPRI, 1995 | -- | Al only | -- | -- | Molycorp, Inc. 's on site analytical laboratory for surface water | No | -- |
| Woodward-Clyde Consultants, 1996a | Collected splits from NMED (June 1994)—pre-preserved sample bottles | Same as Kent, 1995 | Same as Kent, 1995 | Same as Kent, 1995 | ETC Northwest, Redmond, Wash. | CLP methods, TAL list | -- |
| Allen and others, 1999 | Stream samples: peristaltic pump; equipment blanks, field replicates, chain-of-custody. Used sediment traps. Alluvium: natural scar areas. Fe coatings: low -pH seeps; cemented fluvial sand/gravel: <100 mesh. Al crusts: removed with polypropylene spatula and using peristaltic pump over floc. | 0.45-µm in-line Gelman | HNO3 for metals, on ice for anions | Major cations: flame AAS; anions: Dionex-500X; trace metals: ICP-MS. Sed samples dried, 100-mesh sieve, Digestion using 1:1:1.5 mix of HNO3, HClO4, HF. Standard calibration curves basalt working standard UNM B1. Spiked samples. | University of New Mexico | No | -- |
| Vail Engineering, Inc., 2000 | Synoptic sampling, samples collected mid-stream, in upstream direction; bottles filled with mouth pointing upstream; chain of custody used. | Filtered at the lab within 20 hrs of collection (assume 0.45-µm) | Iced after collection; preservation at laboratory within 20 hrs of collection | -- | CDS Labs, Durango, Colo. (now Acculabs, Inc.) | No | -- |
| RGC, 2000b | Duplicates, equipment blanks, chain-of-custody, field blanks; See work plan RGC (2000a) for details. | 0.45-µm, disposable syringe and in-line filters | Metals: HNO3; anions: on ice. See RGC (2000a) | See appendix B RGC (2000c) | ACZ, Steamboat Springs (Mar–Jun 2000); after ~mid-June 2000 Paragon Analytics Inc. Some splits to ACZ and Molycorp, Inc. Lab for QA/QC for F. | Final QA/QC analysis will be completed at end of 2000 field season. See RGC (2000a). | Found thunderstorm generated more contaminant loading than snowmelt event |
| Garn, 1985 | Sampled ~10x/yr ~ monthly; winter bimonthly; spring runoff—near peak flow and rising and falling stages; event samples. | Yes; assume 0.45-µm | Yes | Skougstad and others, 1979. | USGS laboratory in Denver, Colo. | No | Data in USGS, 2003b |
| Medine, 2000 | -- | -- | ICP | -- | No | -- |
Table 4 contains the water-quality data for the Red River at the Questa Ranger Station gage from 1965 to 2001. Although all of the constituents for which determinations were attempted are included in table 2, constituents that were rarely determined or that had concentrations consistently near or below detection were excluded from table 4. A smaller set of water-quality data from stations upstream from the Questa Ranger Station gage but downstream from hydrothermal scar areas also is included in table 5. The source of the water-quality data is indicated in table 4 and corresponds to the 'Reference' columns in tables 2 and 3. The source for all water-quality data in table 5 is Vail Engineering, Inc. (written commun., 2002).
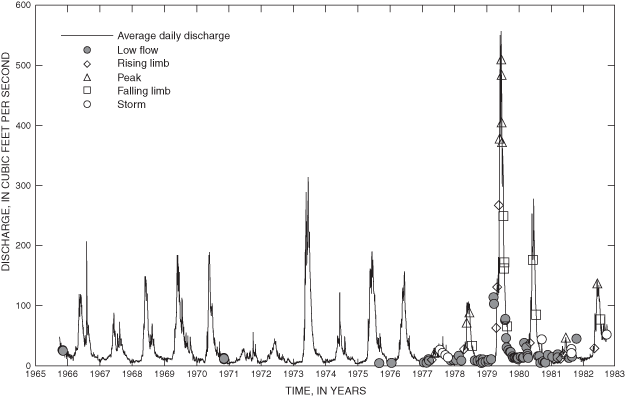
In mineralized or mined areas, it is common to see relationships between concentrations and flow, or between concentrations and changes in hydrologic conditions determined from the hydrograph record. For example, concentrations of metals in streams draining mined areas can increase during the rising limb of the hydrograph before dilution occurs (Jambor and others, 2000). Stored acid and metals from the oxidation of pyrite and other sulfides (unsaturated-zone waters and efflorescent salts) are flushed from soils, mine wastes, and unmined but mineralized areas by melting snow or rain and washed into receiving streams. To determine if similar mechanisms were operating in the study area, hydrographs for all years containing sampling events were examined to find the hydrologic conditions during sampling. Average daily discharge values were taken from the U.S. Geological Survey web site (USGS, 2003a).
Criteria used to discriminate sampling events based on hydrologic conditions are defined in table 6 and used in tables 4 and 5. As shown in table 6, five hydrologic conditions were defined: rising limb, peak, falling limb, storm, and low flow. Rising limb was defined as starting when flows first increased as a result of snowmelt (usually in April) and ending when flows reached 50 percent of the peak flow for that water year. Peak flow was defined as starting and ending at 50 percent of peak flow on either side of the peak (usually late April/early May). Falling limb started after the peak when flows fell to 50 percent of peak values and ended when flows fell to 25 percent of peak values. Low flows started at 25 percent of peak flow after the peak and continued to the start of the rising limb the following year. Storm events are defined as increases in flow superimposed on the low flow portions of the hydrograph (summer thunderstorms). To determine percent of peak flow, average daily flows were compared to maximum daily discharge (peak flow). The relevant peak flow was defined as the previous peak. For example, if the sampling date was between October 1, 1999, and the start of the rising limb in 2000, the relevant peak flow for these dates would be the peak flow for 1999, not 2000.
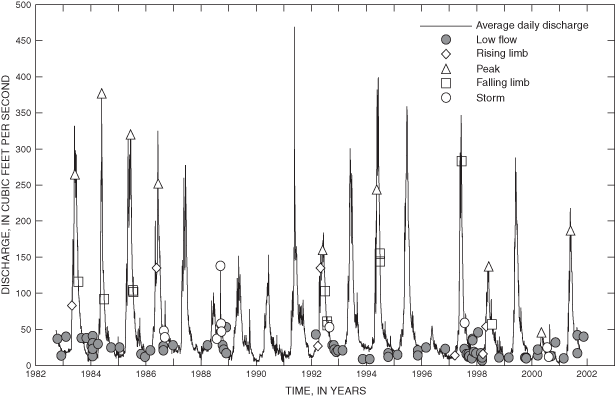
Sampling dates at the Questa Ranger Station gage from water years 1966 to 1982 and 1983 to 2001 are shown on hydrographs in figures 2 and 3, respectively. In total, there were 190 separate sampling dates when water quality samples were collected on the Red River at the Questa Ranger Station gage. On a small number of additional dates, only flow was measured, but those events are not included in figures 2 and 3 or in table 4. Figure 2 shows the wide variability in peak discharge values, ranging from a low of 29 ft3/s in 1977 to a high of 557 ft3/s in 1979. The earliest sampling events were in November 1965 and November 1971, both during low flow. A number of samples collected from 1977 through 1979 were average monthly composites (Molycorp, Inc., 1979; marked with an 'A' in table 4), and some of the most consistent sampling coverage for different flow conditions was during this time. Most samples from water years 1983 to 2001 (fig. 3) were collected during low flow conditions, although there were five summer thunderstorm samples collected in 1988 and a number of non-low-flow samples collected in 1992, 1994, 1997, and 1998. Table 6 shows the years in which samples from different hydrologic conditions were collected. Relationships between hydrologic conditions (for example, low flow) and concentrations are discussed in the following sections.
Table 6. Definition of hydrologic conditions and summary of sampling events.
[NA, not applicable]
| Hydrologic conditions | Definition | Approximate dates | Number of sampling events | Years sampled |
|---|---|---|---|---|
| Rising limb | Starts when flows begin to increase in the spring; stops at 50 percent of peak flow | April 1–May 15 | 17 | 1977-83, 1986, 1992, 1997, 1998 |
| Peak | Rising or falling limb and 50 percent or more of peak flow | May, June | 22 | 1977-79, 1981-86, 1992, 1994, 1998, 2000, 2001 |
| Falling limb | Starts after peak flow when flows decrease to 50 percent of peak flow; stops when flows fall to 25 percent of peak flow | June 1–August 15 | 20 | 1978-80, 1982-85, 1992, 1994, 1997, 1998 |
| Storm | Summer thunderstorm event; generally requires a noticeable peak in flow relative to flows before and after storm. | Summer | 20 | 1977, 1980-82, 1986, 1988, 1992, 1997, 2000 |
| Low flow | Starts at 25 percent of peak flow and ends when flows start to increase in spring1 | August 15–April 1 | 156 | 1965, 1970, 1977-86, 1988, 1992-2001 |
| Unknown | No flow data available | NA | 5 | Water year 2001 |
1If date falls between October 1 and start of rising limb, peak flow used is from previous year.
The sample collection, preservation, and analysis methods are presented in table 3. Analytical issues that may limit the usefulness of previous Red River water-quality studies are discussed in this section. In addition, the results of a limited number of studies are discussed to provide a context for the presentation of historical water-quality data.
Baseline surveys of Red River water quality were conducted by the Federal Water Pollution Control Administration (1966) and the USEPA (1971). The reports concluded that the water quality was good in 1966 and that the chemical quality and biological conditions remained very good in 1971, with the exception of the influences of tailings pipeline breaks (USEPA, 1971). In the early 1970's, the NMDGF, however, noted that fish were absent in the middle reach of the Red River where there had been 572 fish per mile in 1960 (Slifer, 1996).
In 1980, the USEPA performed a preliminary assessment of the Red River-Questa site (Melancon et al., 1982). The study found biologic toxicity, high concentrations of arsenic, and concentrations of cadmium and silver that exceeded water quality standards for the protection of aquatic life. Four surveys were performed between 1984 and 1988 by different bureaus within NMED that indicated progressive degradation in the Red River (Slifer, 1996; URS, 2001). The Bureau of Land Management (BLM) studied Red River water quality between 1978 and 1986 (Garn, 1985; USGS, 2003b), and documented a downstream increase in concentrations of metals and other constituents, at times exceeding water quality standards, and related the impacts to mining. Smolka and Tague (1987, 1989) conducted water studies that showed increased loading from storm events, but concentrations in the Red River did not exceed aquatic toxicity thresholds. However, biological indices were substantially reduced downstream from the Molycorp, Inc. Mine. Summaries of these and other water-quality investigations are discussed and reviewed in the Historical Surface-Water Quality section.
Arsenic, iron, lead, and zinc were determined using colorimetric methods in FWPCA (1966). The detection limits for lead (20 micrograms per liter (µg/L) and zinc (1,000 µg/L) in the FWPCA study are elevated compared to those for graphite furnace AAS, ICP-MS, or even flame AAS and preclude comparisons to criteria for the protection of aquatic life in the Red River. Similarly, detection limits for many of the elements determined using colorimetric methods in the Pennak (1972a) report prohibit comparisons to water-quality standards or criteria. For example, colorimetric detection limits were 1 milligram per liter (mg/L) for silver, 0.5 mg/L for arsenic, and 2 mg/L for beryllium. However, for analytes determined by flame AAS, detection limits were in the parts per billion range (for example, 20 µg/L for copper and 40 µg/L for iron).
Although the later Pennak (1976 to 1984) reports discussed water quality, no metals were determined, and the focus was predominantly on benthic aquatic life. The cause of a "yellowish-tan" precipitate was attributed to Molycorp, Inc. operations in May 1978 and to naturally-occurring streamside deposits upstream from the Eagle Rock campground in October 1978.
The USEPA report by Melancon and others (1982) concluded that concentrations of total arsenic, cadmium, and silver exceeded acute aquatic life criteria in the Red River. However, cadmium and silver detection limits were 7.5 and 12.0 µg/L, respectively, and the arsenic detection limit was 110 µg/L. Arsenic concentrations are higher than those reported in any other water-quality study of the Red River. For example, the highest arsenic concentration reported at the Questa Ranger Station gage (table 4) from 1966 to 2001 was 22 µg/L; arsenic concentrations reported by Melancon and others (1982) ranged from 633 µg/L upstream from the town of Red River to 1,400 µg/L approximately 200 m upstream from the State fish hatchery, which is downstream from the Questa Ranger Station. Arsenic was determined by ICP-AES, which is one of the least sensitive methods available for arsenic. The arsenic values reported in Melancon and others (1982) were not considered reliable because all other arsenic values measured in the Red River were lower. Furthermore, arsenic mineralization is rare in the Red River Valley (Schilling, 1956).
Only three of eight locations sampled by Melancon and others (1982) had detectable cadmium concentrations, and these ranged from 7.8 µg/L at one of the upstream control locations to 11.5 µg/L at the other upstream control location. These values are less than twice the detection limit of 7.5 µg/L and may not be reliable. Similarly, silver was detected at only two of eight locations; the values were 16.0 and 19.2 µg/L, which are only slightly higher than the detection limit of 12.0 µg/L. Silver also is highly insoluble (<1 µg/L) in most freshwaters. Consequently, conclusions by Melancon and others (1982) about exceedences of arsenic, cadmium, and silver aquatic criterion values are questionable.
The detection limits for lead (50 µg/L), copper (10 µg/L), and cadmium (5 µg/L) in ENSR Consulting and Engineering, Inc. (1988) were higher than many detected concentrations in other studies (especially for dissolved metal concentrations). Detection limits for zinc (10 µg/L) in the ENSR Consulting and Engineering, Inc. (1988) study were acceptable, because measured zinc concentrations in the Red River at the Questa Ranger Station gage and other locations were usually substantially higher than 10 µg/L.
The Allen and others (1999) report, prepared for the New Mexico Office of the Natural Resources Trustee, concluded that water quality, sediment chemistry, and aquatic life impacts in the Red River were related more to mining than natural sources at the Molycorp, Inc. mine. Allen and others (1999) compared metal concentrations in sediment from two lakes, Fawn Lakes and Eagle Rock Lake, dug as borrow pits for road construction. Fawn Lakes are located upstream from the mine site near the Elephant Rock Campground, and Eagle Rock Lake is located downstream from the mine site, approximately 700 m downstream from the Questa Ranger Station (see fig. 1). Metal enrichment appeared in the Eagle Rock Lake sediments but not in the Fawn Lakes sediments. Water-quality data were collected during 1997 and 1998 by Allen and others (1999) at five sites along the Red River from near the Questa gage to above the mine site. Their data showed increases in concentrations of sulfate, calcium, magnesium, zinc, nickel, and aluminum at the gage relative to upstream concentrations, and the concentrations increased through the reach adjacent to the mine. Alkalinity decreased from upstream to downstream locations. They concluded that the source of these elevated concentrations and decreased alkalinity values was mining activities, although they also noted that trace metal concentrations in waters upstream from the mine and adjacent to scar areas were elevated relative to those in waters upstream from all scar areas. They found that concentrations at any one site tended to increase during the dry season and decrease during the wet season.
[A, average (monthly composite); Alk, alkalinity; avg, average (monthly composite); Avg, average; BLM, Bureau of Land Management; _d, dissolved; DOC, dissolved organic carbon; FWPCA, Federal Water Pollution Control Authority; final, dissolved if available, total if dissolved not available, unknown if neither available; J, estimated value; JTU, Jackson turbidity units; Max, maximum; mg/L, milligrams per liter; µS/cm, microsiemens per centimeter; mm/dd/yy, month/day/year; NMDGF, New Mexico Department of Game and Fish; NMED, New Mexico Environment Department; NM ONRT, New Mexico Office of the Natural Resource Trustee; NTU, nephelometric turbidity units; RGC, Robertson GeoConsultants; _s, suspended; SC, specific conductance; SPRI, South Pass Resources, Inc.; SRK, Steffen, Robertson & Kirsten, Inc.; SU, standard units; Temp, temperature; _t, total; TDS, total dissolved solids; TSS, total suspended sediment; USEPA, U.S. Environmental Protection Agency; USGS, U.S. Geological Survey; <, less than; _?, not known if total or dissolved; --, no data]
| Date (mm/dd/yy) | 11/03/65 | 11/04/65 | 11/04/65 | 11/04/65 | 11/04/65 |
|---|---|---|---|---|---|
| Time (24-hr) | -- | -- | -- | -- | -- |
| Collected by | FWPCA | FWPCA | FWPCA | FWPCA | Vail Engineering, Inc. |
| Source | FWPCA,1966 | FWPCA,1966 | FWPCA,1966 | FWPCA,1966 | Vail Engineering, Inc., 1989 |
| Measured Discharge (ft3/s) | -- | -- | -- | 26.3 | 26.3 |
| Flow Comments | -- | -- | -- | -- | -- |
| Hydrologic Condition | Low flow | Low flow | Low flow | Low flow | Low flow |
| Avg Daily Discharge (ft3/s) | 26 | 26 | 26 | 26 | 26 |
| Avg Monthly Discharge (ft3/s) | -- | -- | -- | -- | -- |
| Max Avg Daily Discharge snowmelt runoff (ft3/s) | 119 | 119 | 119 | 119 | 119 |
| pH-field (SU) | 7.9 | 8.0 | 8.5 | 8.4 | 8.1 |
| pH-lab (SU) | 7.6 | 7.5 | 7.5 | 7.5 | -- |
| SC-field (µS/cm) | 255 | 260 | 260 | 255 | -- |
| SC-lab (µS/cm) | 242 | 253 | 262 | 253 | -- |
| SC, 25°C (µS/cm) | -- | -- | -- | -- | -- |
| Temp, field (°C) | 5.0 | 4.0 | 4.5 | 2.3 | -- |
| TDS, meas (mg/L) | 180 | 195 | 200 | 170 | 186 |
| TSS (mg/L) | 8.0 | 8.0 | 78.0 | 8.0 | 25 |
| DOC (mg/L) | -- | -- | -- | -- | -- |
| Turbidity, field (NTU) | -- | -- | -- | -- | -- |
| Turbidity, lab (NTU) | -- | -- | -- | -- | -- |
| Turbidity (JTU) | 5 | 4.3 | 5.9 | 8.7 | 5.6 |
| Constituent (mg/L) | |||||
| Ca final | 33 | 34.4 | 34.4 | 34 | -- |
| Mg final | 9.3 | 8.3 | 9.5 | -- | -- |
| Na final | -- | -- | -- | -- | -- |
| K final | -- | -- | -- | -- | -- |
| SO4 final | 62 | 63 | 67 | 62 | 64 |
| Alk final (mg/L CaCO3) | 57.9 | 55 | 58.9 | 54.5 | 56 |
| F final | -- | -- | -- | -- | -- |
| Cl final | 1 | 1.5 | 0.5 | 1.5 | -- |
| Ag_d | -- | -- | -- | -- | -- |
| Ag_t | -- | -- | -- | -- | -- |
| Al_d | -- | -- | -- | -- | -- |
| Al_s | -- | -- | -- | -- | -- |
| Al_t | -- | -- | -- | -- | -- |
| As_d | -- | -- | -- | -- | -- |
| Date (mm/dd/yy) | 11/03/65 | 11/04/65 | 11/04/65 | 11/04/65 | 11/04/65 |
| As_t | <0.01 | <0.01 | <0.01 | <0.01 | -- |
| Ba_d | -- | -- | -- | -- | -- |
| Ba_t | -- | -- | -- | -- | -- |
| Be_d | -- | -- | -- | -- | -- |
| Be_t | -- | -- | -- | -- | -- |
| Cd_d | -- | -- | -- | -- | -- |
| Cd_t | -- | -- | -- | -- | -- |
| Cd_? | -- | -- | -- | -- | -- |
| Co_d | -- | -- | -- | -- | -- |
| Co_t | -- | -- | -- | -- | -- |
| Cr_d | -- | -- | -- | -- | -- |
| Cr_t | -- | -- | -- | -- | -- |
| Cr_? | -- | -- | -- | -- | -- |
| Cu_d | -- | -- | -- | -- | -- |
| Cu_t | -- | -- | -- | -- | -- |
| Cu_? | -- | -- | -- | -- | -- |
| Fe_d | <0.02 | <0.02 | <0.02 | <0.02 | -- |
| Fe_t | -- | -- | -- | -- | -- |
| Fe_? | -- | -- | -- | -- | -- |
| Hg_d | -- | -- | -- | -- | -- |
| Hg_t | -- | -- | -- | -- | -- |
| Mn_d | -- | -- | -- | -- | -- |
| Mn_t | -- | -- | -- | -- | -- |
| Mn_? | -- | -- | -- | -- | -- |
| Mo_d | -- | -- | -- | -- | -- |
| Mo_t | -- | -- | -- | -- | -- |
| Mo_? | -- | -- | -- | -- | -- |
| Ni_d | -- | -- | -- | -- | -- |
| Ni_t | -- | -- | -- | -- | -- |
| P_t | -- | -- | -- | -- | -- |
| Pb_d | -- | -- | -- | -- | -- |
| Pb_t | <0.02 | <0.02 | <0.02 | <0.02 | -- |
| Se_d | -- | -- | -- | -- | -- |
| Se_t | -- | -- | -- | -- | -- |
| SiO2 final | -- | -- | -- | -- | -- |
| Tl_d | -- | -- | -- | -- | -- |
| Tl_t | -- | -- | -- | -- | -- |
| V_d | -- | -- | -- | -- | -- |
| V_t | -- | -- | -- | -- | -- |
| Zn_d | -- | -- | -- | -- | -- |
| Zn_t | 1 | 1 | 1 | 1 | -- |
| Zn_? | -- | -- | -- | -- | -- |
| Total cations (meq/L) | -- | -- | -- | 1.6 | -- |
| Total anions (meq/L) | -- | -- | -- | 1.2 | -- |
| Charge Imbalance (%) | -- | -- | -- | 25.8 | -- |
| Date (mm/dd/yy) | 11/07/65 | 11/08/65 | 11/02/70 | 11/03/70 | 11/04/70 |
| Time (24-hr) | -- | -- | -- | -- | -- |
| Collected by | FWPCA | FWPCA | USEPA | USEPA | USEPA |
| Source | FWPCA,1966 | FWPCA,1966 | USEPA, 1971 | USEPA, 1971 | USEPA, 1971 |
| Measured Discharge (ft3/s) | -- | -- | -- | -- | 11.2 |
| Flow Comments | -- | -- | -- | -- | -- |
| Hydrologic Condition | Low flow | Low flow | Low flow | Low flow | Low flow |
| Avg Daily Discharge (ft3/s) | 25 | 25 | 13 | 12 | 11 |
| Avg Monthly Discharge (ft3/s) | -- | -- | -- | -- | -- |
| Max Avg Daily Discharge snowmelt runoff (ft3/s) | 119 | 119 | 189 | 189 | 189 |
| pH-field (SU) | 7.8 | 7.8 | 6.5 | 6.6 | 7.0 |
| pH-lab (SU) | 7.6 | -- | 7.0 | 7.0 | 7.7 |
| SC-field (µS/cm) | 250 | 250 | 260 | 260 | 250 |
| SC-lab (µS/cm) | 266 | -- | 250 | 260 | 255 |
| SC, 25°C (µS/cm) | -- | -- | -- | -- | -- |
| Temp, field (°C) | 3.8 | 3.0 | 3.9 | 2.8 | 2.2 |
| TDS, meas (mg/L) | -- | -- | 173 | 185 | 90 |
| TSS (mg/L) | -- | -- | 4.0 | 1.0 | 1.0 |
| DOC (mg/L) | -- | -- | -- | -- | -- |
| Turbidity, field (NTU) | -- | -- | -- | -- | -- |
| Turbidity, lab (NTU) | -- | -- | -- | -- | -- |
| Turbidity (JTU) | 4 | 6.3 | 6.1 | 6.5 | 60 |
| Constituent (mg/L) | |||||
| Ca final | 36 | -- | 34 | 36 | 38 |
| Mg final | -- | -- | 4.9 | 9.8 | 6.1 |
| Na final | -- | -- | -- | -- | -- |
| K final | -- | -- | -- | -- | -- |
| SO4 final | -- | -- | 50 | 80 | 69.2 |
| Alk final (mg/L CaCO3) | 55 | -- | 54 | 52 | 55 |
| F final | -- | -- | -- | -- | -- |
| Cl final | 2 | -- | 2 | -- | -- |
| Ag_d | -- | -- | -- | -- | -- |
| Ag_t | -- | -- | -- | -- | -- |
| Al_d | -- | -- | -- | -- | -- |
| Al_s | -- | -- | -- | -- | -- |
| Al_t | -- | -- | -- | -- | -- |
| As_d | -- | -- | -- | -- | -- |
| As_t | <0.01 | <0.01 | <0.01 | <0.01 | <0.01 |
| Ba_d | -- | -- | -- | -- | -- |
| Ba_t | -- | -- | -- | -- | -- |
| Be_d | -- | -- | -- | -- | -- |
| Be_t | -- | -- | -- | -- | -- |
| Date (mm/dd/yy) | 11/07/65 | 11/08/65 | 11/02/70 | 11/03/70 | 11/04/70 |
| Cd_d | -- | -- | -- | -- | -- |
| Cd_t | -- | -- | -- | -- | -- |
| Cd_? | -- | -- | -- | -- | -- |
| Co_d | -- | -- | -- | -- | -- |
| Co_t | -- | -- | -- | -- | -- |
| Cr_d | -- | -- | -- | -- | -- |
| Cr_t | -- | -- | -- | -- | -- |
| Cr_? | -- | -- | -- | -- | -- |
| Cu_d | -- | -- | -- | -- | -- |
| Cu_t | -- | -- | -- | -- | -- |
| Cu_? | -- | -- | -- | -- | -- |
| Fe_d | <0.02 | -- | 0.08 | 0.0 | 0.08 |
| Fe_t | -- | -- | -- | -- | -- |
| Fe_? | -- | -- | -- | -- | -- |
| Hg_d | -- | -- | -- | -- | -- |
| Hg_t | -- | -- | -- | -- | -- |
| Mn_d | -- | -- | -- | -- | -- |
| Mn_t | -- | -- | -- | -- | -- |
| Mn_? | -- | -- | -- | -- | -- |
| Mo_d | -- | -- | -- | -- | -- |
| Mo_t | -- | -- | -- | -- | -- |
| Mo_? | -- | -- | -- | -- | -- |
| Ni_d | -- | -- | -- | -- | -- |
| Ni_t | -- | -- | -- | -- | -- |
| P_t | -- | -- | -- | -- | -- |
| Pb_d | -- | -- | -- | -- | -- |
| Pb_t | <0.02 | <0.02 | <0.02 | <0.02 | <0.02 |
| Se_d | -- | -- | -- | -- | -- |
| Se_t | -- | -- | -- | -- | -- |
| SiO2 final | -- | -- | -- | -- | -- |
| Tl_d | -- | -- | -- | -- | -- |
| Tl_t | -- | -- | -- | -- | -- |
| V_d | -- | -- | -- | -- | -- |
| V_t | -- | -- | -- | -- | -- |
| Zn_d | -- | -- | -- | -- | -- |
| Zn_t | 1 | 1 | 0.02 | 0.01 | 0.01 |
| Zn_? | -- | -- | -- | -- | -- |
| Total cations (meq/L) | -- | -- | -- | -- | -- |
| Total anions (meq/L) | -- | -- | -- | -- | -- |
| Charge Imbalance (%) | -- | -- | -- | -- | -- |
| Date (mm/dd/yy) | 02/15/77 | 03/08/77 | 03/15/77 | 04/15/77 | 05/15/77 |
| Time (24-hr) | -- | -- | -- | -- | -- |
| Collected by | Vail Engineering, Inc. | Vail Engineering, Inc. | Vail Engineering, Inc. | Vail Engineering, Inc. | Vail Engineering, Inc. |
| Source | Molycorp, Inc., 1979 | Molycorp, Inc., 1979 | Molycorp, Inc., 1979 | Molycorp, Inc., 1979 | Molycorp, Inc., 1979 |
| Measured Discharge (ft3/s) | -- | -- | -- | -- | -- |
| Flow Comments | -- | -- | -- | -- | -- |
| Hydrologic Condition | Low flow | Low flow | Low flow | Rising limb | Peak |
| Avg Daily Discharge (ft3/s) | -- | 5.5 | -- | -- | -- |
| Avg Monthly Discharge (ft3/s) | 4.81 | -- | 5.11 | 10.0 | 21.9 |
| Max Avg Daily Discharge snowmelt runoff (ft3/s) | 157 | 29 | 157 | 29 | 29 |
| pH-field (SU) | -- | -- | -- | -- | -- |
| pH-lab (SU) | -- | -- | -- | -- | -- |
| SC-field (µS/cm) | -- | -- | -- | -- | -- |
| SC-lab (µS/cm) | -- | -- | -- | -- | -- |
| SC, 25°C (µS/cm) | -- | -- | -- | -- | -- |
| Temp, field (°C) | -- | -- | -- | -- | -- |
| TDS, meas (mg/L) | 192 A | -- | 201 A | 184 A | 157 A |
| TSS (mg/L) | 18 A | -- | 221 A | 14 A | 13 A |
| DOC (mg/L) | -- | -- | -- | -- | -- |
| Turbidity, field (NTU) | -- | -- | -- | -- | -- |
| Turbidity, lab (NTU) | -- | -- | -- | -- | -- |
| Turbidity (JTU) | 10 | -- | 623 | 11 | 7 |
| Constituent (mg/L) | |||||
| Ca final | -- | -- | -- | -- | -- |
| Mg final | -- | -- | -- | -- | -- |
| Na final | -- | -- | -- | -- | -- |
| K final | -- | -- | -- | -- | -- |
| SO4 final | 107 A | -- | 109 A | 60 A | 40 A |
| Alk final (mg/L CaCO3) | -- | -- | <45 | -- | -- |
| F final | 0.7 A | -- | 0.9 A | 1.1 | 0.5 |
| Cl final | -- | -- | -- | -- | -- |
| Ag_d | -- | -- | -- | -- | -- |
| Ag_t | -- | -- | -- | -- | -- |
| Al_d | -- | -- | -- | -- | -- |
| Al_s | -- | -- | -- | -- | -- |
| Al_t | -- | -- | -- | -- | -- |
| As_d | -- | -- | -- | -- | -- |
| As_t | -- | -- | -- | -- | -- |
| Ba_d | -- | -- | -- | -- | -- |
| Ba_t | -- | -- | -- | -- | -- |
| Be_d | -- | -- | -- | -- | -- |
| Be_t | -- | -- | -- | -- | -- |
| Cd_d | -- | -- | -- | -- | -- |
| Cd_t | -- | -- | -- | -- | -- |
| Cd_? | <0.01 A | -- | <0.01 A | <0.01 A | <0.01 A |
| Co_d | -- | -- | -- | -- | -- |
| Co_t | -- | -- | -- | -- | -- |
| Cr_d | -- | -- | -- | -- | -- |
| Cr_t | -- | -- | -- | -- | -- |
| Cr_? | -- | -- | -- | -- | -- |
| Cu_d | -- | -- | -- | -- | -- |
| Cu_t | -- | -- | -- | -- | -- |
| Cu_? | -- | -- | -- | -- | -- |
| Fe_d | -- | -- | -- | -- | -- |
| Fe_t | -- | -- | -- | -- | -- |
| Fe_? | 0.5 A | -- | 5.02 A | 0.68 A | 0.74 A |
| Hg_d | -- | -- | -- | -- | -- |
| Hg_t | -- | -- | -- | -- | -- |
| Mn_d | -- | -- | -- | -- | -- |
| Mn_t | -- | -- | -- | -- | -- |
| Mn_? | 0.6 A | -- | 1.1 A | 0.48 A | 0.28 A |
| Mo_d | -- | -- | -- | -- | -- |
| Mo_t | -- | -- | -- | -- | -- |
| Mo_? | -- | -- | 0.02 A | -- | -- |
| Ni_d | -- | -- | -- | -- | -- |
| Ni_t | -- | -- | -- | -- | -- |
| P_ | -- | -- | -- | -- | -- |
| Pb_d | -- | -- | -- | -- | -- |
| Pb_t | -- | -- | -- | -- | -- |
| Se_d | -- | -- | -- | -- | -- |
| Se_t | -- | -- | -- | -- | -- |
| SiO2 final | -- | -- | -- | -- | -- |
| Tl_d | -- | -- | -- | -- | -- |
| Tl_t | -- | -- | -- | -- | -- |
| V_d | -- | -- | -- | -- | -- |
| V_t | -- | -- | -- | -- | -- |
| Zn_d | -- | -- | -- | -- | -- |
| Zn_t | -- | -- | -- | -- | -- |
| Zn_? | 0.16 A | -- | 0.36 A | 0.19 A | 0.11 A |
| Total cations (meq/L) | -- | -- | -- | -- | -- |
| Total anions (meq/L) | -- | -- | -- | -- | -- |
| Charge Imbalance (%) | -- | -- | -- | -- | -- |
| Date (mm/dd/yy) | 06/15/77 | 07/15/77 | 08/15/77 | 09/15/77 | 10/15/77 |
|---|---|---|---|---|---|
| Time (24-hr) | -- | -- | -- | -- | -- |
| Collected by | Vail Engineering, Inc. | Vail Engineering, Inc. | Vail Engineering, Inc. | Vail Engineering, Inc. | Vail Engineering, Inc. |
| Source | Molycorp, Inc., Inc., 1979 | Molycorp, Inc., Inc., 1979 | Molycorp, Inc., 1979 | Molycorp, Inc., 1979 | Molycorp, Inc., 1979 |
| Measured Discharge (ft3/s) | -- | -- | -- | -- | -- |
| Flow Comments | -- | -- | -- | -- | -- |
| Hydrologic Condition | Peak | Falling limb | Storm | Storm | Storm |
| Avg Daily Discharge (ft3/s) | -- | -- | -- | -- | -- |
| Avg Monthly Discharge (ft3/s) | 22.7 | 26.8 | 21.4 | 17.8 | 13.8 |
| Max Avg Daily Discharge snowmelt runoff (ft3/s) | 29 | 29 | 29 | 29 | 29 |
| pH-field (SU) | -- | -- | -- | -- | -- |
| pH-lab (SU) | -- | -- | -- | -- | -- |
| SC-field (µS/cm) | -- | -- | -- | -- | -- |
| SC-lab (µS/cm) | -- | -- | -- | -- | -- |
| SC, 25°C (µS/cm) | -- | -- | -- | -- | -- |
| Temp, field (°C) | -- | -- | -- | -- | -- |
| TDS, meas (mg/L) | 217 A | 152 A | 162 A | 155 A | 170 A |
| TSS (mg/L) | 201 A | 112 A | 335 A | 332 A | 28 A |
| DOC (mg/L) | -- | -- | -- | -- | -- |
| Turbidity, field (NTU) | -- | -- | -- | -- | -- |
| Turbidity, lab (NTU) | -- | -- | -- | -- | -- |
| Turbidity (JTU) | 17 | 77 | 61 | 170 | 15 |
| Constituent (mg/L) | |||||
| Ca final | -- | -- | -- | -- | -- |
| Mg final | -- | -- | -- | -- | -- |
| Na final | -- | -- | -- | -- | -- |
| K final | -- | -- | -- | -- | -- |
| SO4 final | 57 A | 58 A | 55 A | 55 A | 53 A |
| Alk final (mg/L CaCO3) | -- | -- | -- | -- | -- |
| F final | 0.7 | 0.6 | 0.5 A | 0.5 A | 0.5 A |
| Cl final | -- | -- | -- | -- | -- |
| Ag_d | -- | -- | -- | -- | -- |
| Ag_t | -- | -- | -- | -- | -- |
| Al_d | -- | -- | -- | -- | -- |
| Al_s | -- | -- | -- | -- | -- |
| Al_t | -- | -- | -- | -- | -- |
| As_d | -- | -- | -- | -- | -- |
| As_t | -- | -- | -- | -- | -- |
| Ba_d | -- | -- | -- | -- | -- |
| Ba_t | -- | -- | -- | -- | -- |
| Be_d | -- | -- | -- | -- | -- |
| Be_t | -- | -- | -- | -- | -- |
| Cd_d | -- | -- | -- | -- | -- |
| Cd_t | -- | -- | -- | -- | -- |
| Cd_? | <0.01 A | <0.01 A | <0.01 A | <0.01 A | <0.01 A |
| Co_d | -- | -- | -- | -- | -- |
| Co_t | -- | -- | -- | -- | -- |
| Cr_d | -- | -- | -- | -- | -- |
| Cr_t | -- | -- | -- | -- | -- |
| Cr_? | -- | -- | -- | -- | -- |
| Cu_d | -- | -- | -- | -- | -- |
| Cu_t | -- | -- | -- | -- | -- |
| Cu_? | -- | -- | -- | -- | -- |
| Fe_d | -- | -- | -- | -- | -- |
| Fe_t | -- | -- | -- | -- | -- |
| Fe_? | 4.45 A | 13.4 A | 4.52 A | 18.4 A | 1.8 A |
| Hg_d | -- | -- | -- | -- | -- |
| Hg_t | -- | -- | -- | -- | -- |
| Mn_d | -- | -- | -- | -- | -- |
| Mn_t | -- | -- | -- | -- | -- |
| Mn_? | 0.83 A | 0.45 A | 0.42 A | 0.58 A | 0.33 A |
| Mo_d | -- | -- | -- | -- | -- |
| Mo_t | -- | -- | -- | -- | -- |
| Mo_? | 0.27 A | 0.01 A | -- | 0.04 A | -- |
| Ni_d | -- | -- | -- | -- | -- |
| Ni_t | -- | -- | -- | -- | -- |
| P_ | -- | -- | -- | -- | -- |
| Pb_d | -- | -- | -- | -- | -- |
| Pb_t | -- | -- | -- | -- | -- |
| Se_d | -- | -- | -- | -- | -- |
| Se_t | -- | -- | -- | -- | -- |
| SiO2 final | -- | -- | -- | -- | -- |
| Tl_d | -- | -- | -- | -- | -- |
| Tl_t | -- | -- | -- | -- | -- |
| V_d | -- | -- | -- | -- | -- |
| V_t | -- | -- | -- | -- | -- |
| Zn_d | -- | -- | -- | -- | -- |
| Zn_t | -- | -- | -- | -- | -- |
| Zn_? | 0.24 A | 0.27 A | 0.17 A | 0.21 A | 0.22 A |
| Total cations (meq/L) | -- | -- | -- | -- | -- |
| Total anions (meq/L) | -- | -- | -- | -- | -- |
| Charge Imbalance (%) | -- | -- | -- | -- | -- |
| Date (mm/dd/yy) | 11/15/77 | 12/15/77 | 01/15/78 | 02/15/78 | 03/15/78 |
| Time (24-hr) | -- | -- | -- | -- | -- |
| Collected by | Vail Engineering, Inc. | Vail Engineering, Inc. | Vail Engineering, Inc. | Vail Engineering, Inc. | Vail Engineering, Inc. |
| Source | Molycorp, Inc., 1979 | Molycorp, Inc., 1979 | Molycorp, Inc., 1979 | Molycorp, Inc., 1979 | Molycorp, Inc., 1979 |
| Measured Discharge (ft3/s) | -- | -- | -- | -- | -- |
| Flow Comments | -- | -- | -- | -- | -- |
| Hydrologic Condition | Low flow | Low flow | Low flow | Low flow | Low flow |
| Avg Daily Discharge (ft3/s) | -- | -- | -- | -- | -- |
| Avg Monthly Discharge (ft3/s) | 10.9 | 8.71 | 9.04 | 9.49 | 9.63 |
| Max Avg Daily Discharge snowmelt runoff (ft3/s) | 29 | 29 | 29 | 29 | 29 |
| pH-field (SU) | -- | -- | -- | -- | -- |
| pH-lab (SU) | -- | -- | -- | -- | -- |
| SC-field (µS/cm) | -- | -- | -- | -- | -- |
| SC-lab (µS/cm) | -- | -- | -- | -- | -- |
| SC, 25°C (µS/cm) | -- | -- | -- | -- | -- |
| Temp, field (°C) | -- | -- | -- | -- | -- |
| TDS, meas (mg/L) | 221 A | 157 A | 201 A | 185 A | 189 A |
| TSS (mg/L) | 25 A | 17 A | 14 A | 18 A | 11 A |
| DOC (mg/L) | -- | -- | -- | -- | -- |
| Turbidity, field (NTU) | -- | -- | -- | -- | -- |
| Turbidity, lab (NTU) | -- | -- | -- | -- | -- |
| Turbidity (JTU) | 20 | 11 | -- | -- | 12 |
| Constituent (mg/L) | |||||
| Ca final | -- | -- | -- | -- | -- |
| Mg final | -- | -- | -- | -- | -- |
| Na final | -- | -- | -- | -- | -- |
| K final | -- | -- | -- | -- | -- |
| SO4 final | 101 A | 82 A | 102 A | 100 A | 81 A |
| Alk final (mg/L CaCO3) | -- | -- | -- | -- | -- |
| F final | 0.7 A | 0.8 A | 0.8 A | 0.7 A | 0.7 A |
| Cl final | -- | -- | -- | -- | -- |
| Ag_d | -- | -- | -- | -- | -- |
| Ag_t | -- | -- | -- | -- | -- |
| Al_d | -- | -- | -- | -- | -- |
| Al_s | -- | -- | -- | -- | -- |
| Al_t | -- | -- | -- | -- | -- |
| As_d | -- | -- | -- | -- | -- |
| As_t | -- | -- | -- | -- | -- |
| Ba_d | -- | -- | -- | -- | -- |
| Ba_t | -- | -- | -- | -- | -- |
| Be_d | -- | -- | -- | -- | -- |
| Be_t | -- | -- | -- | -- | -- |
| Cd_d | -- | -- | -- | -- | -- |
| Cd_t | -- | -- | -- | -- | -- |
| Cd_? | <0.01 A | <0.01 A | <0.01 A | <0.01 A | <0.01 A |
| Co_d | -- | -- | -- | -- | -- |
| Co_t | -- | -- | -- | -- | -- |
| Cr_d | -- | -- | -- | -- | -- |
| Cr_t | -- | -- | -- | -- | -- |
| Cr_? | -- | -- | -- | -- | -- |
| Cu_d | -- | -- | -- | -- | -- |
| Cu_t | -- | -- | -- | -- | -- |
| Cu_? | -- | -- | -- | -- | -- |
| Fe_d | -- | -- | -- | -- | -- |
| Fe_t | -- | -- | -- | -- | -- |
| Fe_? | 1.62 A | 1.13 A | 1.31 A | 0.73 A | 0.88 A |
| Hg_d | -- | -- | -- | -- | -- |
| Hg_t | -- | -- | -- | -- | -- |
| Mn_d | -- | -- | -- | -- | -- |
| Mn_t | -- | -- | -- | -- | -- |
| Mn_? | 0.45 A | 0.62 A | 0.51 A | 0.63 A | 0.49 A |
| Mo_d | -- | -- | -- | -- | -- |
| Mo_t | -- | -- | -- | -- | -- |
| Mo_? | -- | -- | -- | -- | -- |
| Ni_d | -- | -- | -- | -- | -- |
| Ni_t | -- | -- | -- | -- | -- |
| P_ | -- | -- | -- | -- | -- |
| Pb_d | -- | -- | -- | -- | -- |
| Pb_t | -- | -- | -- | -- | -- |
| Se_d | -- | -- | -- | -- | -- |
| Se_t | -- | -- | -- | -- | -- |
| SiO2 final | -- | -- | -- | -- | -- |
| Tl_d | -- | -- | -- | -- | -- |
| Tl_t | -- | -- | -- | -- | -- |
| V_d | -- | -- | -- | -- | -- |
| V_t | -- | -- | -- | -- | -- |
| Zn_d | -- | -- | -- | -- | -- |
| Zn_t | -- | -- | -- | -- | -- |
| Zn_? | 0.11 A | 0.1 A | 0.06 A | 0.12 A | 0.11 A |
| Total cations (meq/L) | -- | -- | -- | -- | -- |
| Total anions (meq/L) | -- | -- | -- | -- | -- |
| Charge Imbalance (%) | -- | -- | -- | -- | -- |
| Date (mm/dd/yy) | 11/04/70 | 11/05/70 | 11/05/70 | 11/05/70 | 01/15/77 |
| Time (24-hr) | -- | -- | -- | -- | -- |
| Collected by | Vail Engineering, Inc. | USEPA | USEPA | USEPA | Vail Engineering, Inc. |
| Source | Vail Engineering, Inc., 1989 | USEPA, 1971 | USEPA, 1971 | USEPA, 1971 | Molycorp, Inc., 1979 |
| Measured Discharge (ft3/s) | 11.9 | -- | -- | -- | -- |
| Flow Comments | -- | -- | -- | -- | -- |
| Hydrologic Condition | Low flow | Low flow | Low flow | Low flow | Low flow |
| Avg Daily Discharge (ft3/s) | 11 | 12 | 12 | 12 | -- |
| Avg Monthly Discharge (ft3/s) | -- | -- | -- | -- | 4.41 |
| Max Avg Daily Discharge snowmelt runoff (ft3/s) | 189 | 189 | 189 | 189 | 157 |
| pH-field (SU) | 6.8 | 6.9 | 6.8 | 6.8 | -- |
| pH-lab (SU) | -- | 7.3 | 7.4 | 7.1 | -- |
| SC-field (µS/cm) | -- | 245 | 255 | 260 | -- |
| SC-lab (µS/cm) | -- | 255 | 250 | 245 | -- |
| SC, 25°C (µS/cm) | -- | -- | -- | -- | -- |
| Temp, field (°C) | -- | 1.0 | 2.8 | 2.8 | -- |
| TDS, meas (mg/L) | 160 | 183 | 170 | 158 | 211 A |
| TSS (mg/L) | 2.7 | 1.0 | 2.0 | 7.0 | 18 A |
| DOC (mg/L) | -- | -- | -- | -- | -- |
| Turbidity, field (NTU) | -- | -- | -- | -- | -- |
| Turbidity, lab (NTU) | -- | -- | -- | -- | -- |
| Turbidity (JTU) | 26.9 | 9 | 8.5 | 10 | 10 |
| Constituent (mg/L) | |||||
| Ca final | -- | 36 | 36 | 34 | -- |
| Mg final | -- | 4.9 | 3.7 | 12.2 | -- |
| Na final | -- | -- | -- | -- | -- |
| K final | -- | -- | -- | -- | -- |
| SO4 final | 66 | 56 | 64 | 80 | 103 A |
| Alk final (mg/L CaCO3) | 54 | 56 | 50 | 55 | -- |
| F final | -- | -- | -- | -- | 0.8 A |
| Cl final | -- | 2 | -- | -- | -- |
| Ag_d | -- | -- | -- | -- | -- |
| Ag_t | -- | -- | -- | -- | -- |
| Al_d | -- | -- | -- | -- | -- |
| Al_s | -- | -- | -- | -- | -- |
| Al_t | -- | -- | -- | -- | -- |
| As_d | -- | -- | -- | -- | -- |
| As_t | <0.01 | <0.01 | <0.01 | <0.01 | -- |
| Ba_d | -- | -- | -- | -- | -- |
| Ba_t | -- | -- | -- | -- | -- |
| Be_d | -- | -- | -- | -- | -- |
| Be_t | -- | -- | -- | -- | -- |
| Cd_d | -- | -- | -- | -- | -- |
| Cd_t | -- | -- | -- | -- | -- |
| Cd_? | -- | -- | -- | -- | <0.01 A |
| Co_d | -- | -- | -- | -- | -- |
| Co_t | -- | -- | -- | -- | -- |
| Cr_d | -- | -- | -- | -- | -- |
| Cr_t | -- | -- | -- | -- | -- |
| Cr_? | -- | -- | -- | -- | -- |
| Cu_d | -- | -- | -- | -- | -- |
| Cu_t | -- | -- | -- | -- | -- |
| Cu_? | -- | -- | -- | -- | -- |
| Fe_d | 0.2 | 0.20 | 0.12 | 0.08 | -- |
| Fe_t | -- | -- | -- | -- | -- |
| Fe_? | -- | -- | -- | -- | 0.73 A |
| Hg_d | -- | -- | -- | -- | -- |
| Hg_t | -- | -- | -- | -- | -- |
| Mn_d | -- | -- | -- | -- | -- |
| Mn_t | -- | -- | -- | -- | -- |
| Mn_? | -- | -- | -- | -- | 0.75 A |
| Mo_d | -- | -- | -- | -- | -- |
| Mo_t | -- | -- | -- | -- | -- |
| Mo_? | -- | -- | -- | -- | -- |
| Ni_d | -- | -- | -- | -- | -- |
| Ni_t | -- | -- | -- | -- | -- |
| P_t | -- | -- | -- | -- | -- |
| Pb_d | -- | -- | -- | -- | -- |
| Pb_t | <0.02 | <0.02 | <0.02 | <0.02 | -- |
| Se_d | -- | -- | -- | -- | -- |
| Se_t | -- | -- | -- | -- | -- |
| SiO2 final | -- | -- | -- | -- | -- |
| Tl_d | -- | -- | -- | -- | -- |
| Tl_t | -- | -- | -- | -- | -- |
| V_d | -- | -- | -- | -- | -- |
| V_t | -- | -- | -- | -- | -- |
| Zn_d | -- | -- | -- | -- | -- |
| Zn_t | 0.01 | 0.01 | 0.02 | 0.02 | -- |
| Zn_? | -- | -- | -- | -- | 0.18 A |
| Total cations (meq/L) | -- | -- | -- | -- | -- |
| Total anions (meq/L) | -- | -- | -- | -- | -- |
| Charge Imbalance (%) | -- | -- | -- | -- | -- |
| Date (mm/dd/yy) | 04/15/78 | 05/15/78 | 06/15/78 | 07/15/78 | 08/15/78 |
| Time (24-hr) | -- | -- | -- | -- | -- |
| Collected by | Vail Engineering, Inc. | Vail Engineering, Inc. | Vail Engineering, Inc. | Vail Engineering, Inc. | Vail Engineering, Inc. |
| Source | Molycorp, Inc., 1979 | Molycorp, Inc., 1979 | Molycorp, Inc., 1979 | Molycorp, Inc., 1979 | Molycorp, Inc., 1979 |
| Measured Discharge (ft3/s) | -- | -- | -- | -- | -- |
| Flow Comments | -- | -- | -- | -- | -- |
| Hydrologic Condition | Rising limb | Peak | Peak | Falling limb | Low flow |
| Avg Daily Discharge (ft3/s) | -- | -- | -- | -- | -- |
| Avg Monthly Discharge (ft3/s) | 27.8 | 71.6 | 88.6 | 33.1 | 16.7 |
| Max Avg Daily Discharge snowmelt runoff (ft3/s) | 107 | 107 | 107 | 107 | 107 |
| pH-field (SU) | -- | -- | -- | -- | -- |
| pH-lab (SU) | -- | -- | -- | -- | -- |
| SC-field (µS/cm) | -- | -- | -- | -- | -- |
| SC-lab (µS/cm) | -- | -- | -- | -- | -- |
| SC, 25°C (µS/cm) | -- | -- | -- | -- | -- |
| Temp, field (°C) | -- | -- | -- | -- | -- |
| TDS, meas (mg/L) | 148 A | 123 A | 115 A | 128 A | 181 A |
| TSS (mg/L) | 38 A | 161 A | 30 A | 69 A | 28 A |
| DOC (mg/L) | -- | -- | -- | -- | -- |
| Turbidity, field (NTU) | -- | -- | -- | -- | -- |
| Turbidity, lab (NTU) | -- | -- | -- | -- | -- |
| Turbidity (JTU) | 25 | 49 | 12 | 18 | 12 |
| Constituent (mg/L) | |||||
| Ca final | -- | -- | -- | -- | -- |
| Mg final | -- | -- | -- | -- | -- |
| Na final | -- | -- | -- | -- | -- |
| K final | -- | -- | -- | -- | -- |
| SO4 final | 40 A | 27 A | 18 A | 45 A | 53 A |
| Alk final (mg/L CaCO3) | -- | -- | -- | -- | -- |
| F final | 0.6 A | 0.6 A | 0.4 A | 0.5 | 0.7 A |
| Cl final | -- | -- | -- | -- | -- |
| Ag_d | -- | -- | -- | -- | -- |
| Ag_t | -- | -- | -- | -- | -- |
| Al_d | -- | -- | -- | -- | -- |
| Al_s | -- | -- | -- | -- | -- |
| Al_t | -- | -- | -- | -- | -- |
| As_d | -- | -- | -- | -- | -- |
| As_t | -- | -- | -- | -- | -- |
| Ba_d | -- | -- | -- | -- | -- |
| Ba_t | -- | -- | -- | -- | -- |
| Be_d | -- | -- | -- | -- | -- |
| Be_t | -- | -- | -- | -- | -- |
| Cd_d | -- | -- | -- | -- | -- |
| Cd_t | -- | -- | -- | -- | -- |
| Cd_? | <0.01 A | <0.01 A | <0.01 A | <0.01 A | <0.01 A |
| Co_d | -- | -- | -- | -- | -- |
| Co_t | -- | -- | -- | -- | -- |
| Cr_d | -- | -- | -- | -- | -- |
| Cr_t | -- | -- | -- | -- | -- |
| Cr_? | -- | -- | -- | -- | -- |
| Cu_d | -- | -- | -- | -- | -- |
| Cu_t | -- | -- | -- | -- | -- |
| Cu_? | -- | -- | -- | -- | -- |
| Fe_d | -- | -- | -- | -- | -- |
| Fe_t | -- | -- | -- | -- | -- |
| Fe_? | 2 A | 7.01 A | 1.26 A | 2.43 A | 0.58 A |
| Hg_d | -- | -- | -- | -- | -- |
| Hg_t | -- | -- | -- | -- | -- |
| Mn_d | -- | -- | -- | -- | -- |
| Mn_t | -- | -- | -- | -- | -- |
| Mn_? | 0.17 A | 0.23 A | 0.12 A | 0.26 A | 0.17 A |
| Mo_d | -- | -- | -- | -- | -- |
| Mo_t | -- | -- | -- | -- | -- |
| Mo_? | -- | 0.06 A | -- | -- | -- |
| Ni_d | -- | -- | -- | -- | -- |
| Ni_t | -- | -- | -- | -- | -- |
| P_ | -- | -- | -- | -- | -- |
| Pb_d | -- | -- | -- | -- | -- |
| Pb_t | -- | -- | -- | -- | -- |
| Se_d | -- | -- | -- | -- | -- |
| Se_t | -- | -- | -- | -- | -- |
| SiO2 final | -- | -- | -- | -- | -- |
| Tl_d | -- | -- | -- | -- | -- |
| Tl_t | -- | -- | -- | -- | -- |
| V_d | -- | -- | -- | -- | -- |
| V_t | -- | -- | -- | -- | -- |
| Zn_d | -- | -- | -- | -- | -- |
| Zn_t | -- | -- | -- | -- | -- |
| Zn_? | 0.11 A | 0.11 A | 0.07 A | 0.07 A | 0.08 A |
| Total cations (meq/L) | -- | -- | -- | -- | -- |
| Total anions (meq/L) | -- | -- | -- | -- | -- |
| Charge Imbalance (%) | -- | -- | -- | -- | -- |
| Date (mm/dd/yy) | 09/15/78 | 10/15/78 | 10/17/78 | 10/17/78 | 11/14/78 |
| Time (24-hr) | -- | -- | 10:00 | 10:20 | 13:35 |
| Collected by | Vail Engineering, Inc. | Vail Engineering, Inc. | BLM | BLM | BLM |
| Source | Molycorp, Inc., 1979 | Molycorp, Inc., 1979 | USGS, 2003b | USGS, 2003b | USGS, 2003b |
| Measured Discharge (ft3/s) | -- | -- | 7.7 | 7.6 | 9.6 |
| Flow Comments | -- | -- | -- | -- | -- |
| Hydrologic Condition | Low flow | Low flow | Low flow | Low flow | Low flow |
| Avg Daily Discharge (ft3/s) | -- | -- | 8.1 | 8.1 | 11 |
| Avg Monthly Discharge (ft3/s) | 8.81 | 9.04 | -- | -- | -- |
| Max Avg Daily Discharge snowmelt runoff (ft3/s) | 107 | 107 | 107 | 107 | 107 |
| pH-field (SU) | -- | -- | 7.7 | -- | -- |
| pH-lab (SU) | -- | -- | -- | -- | -- |
| SC-field (µS/cm) | -- | -- | -- | -- | -- |
| SC-lab (µS/cm) | -- | -- | 278 | -- | -- |
| SC, 25°C (µS/cm) | -- | -- | -- | -- | -- |
| Temp, field (°C) | -- | -- | -- | -- | -- |
| TDS, meas (mg/L) | 191 A | 199 A | -- | -- | -- |
| TSS (mg/L) | 18 A | 5 A | -- | 13 | -- |
| DOC (mg/L) | -- | -- | 1.4 | -- | -- |
| Turbidity, field (NTU) | -- | -- | 3.4 | -- | -- |
| Turbidity, lab (NTU) | -- | -- | -- | -- | -- |
| Turbidity (JTU) | 9 | 8 | -- | -- | -- |
| Constituent (mg/L) | |||||
| Ca final | -- | -- | -- | -- | -- |
| Mg final | -- | -- | -- | -- | -- |
| Na final | -- | -- | -- | -- | -- |
| K final | -- | -- | -- | -- | -- |
| SO4 final | 59 A | 95 A | -- | -- | -- |
| Alk final (mg/L CaCO3) | -- | -- | -- | -- | -- |
| F final | 0.8 A | 1 | -- | -- | -- |
| Cl final | -- | -- | -- | -- | -- |
| Ag_d | -- | -- | -- | -- | -- |
| Ag_t | -- | -- | -- | -- | -- |
| Al_d | -- | -- | -- | -- | -- |
| Al_s | -- | -- | -- | -- | -- |
| Al_t | -- | -- | -- | -- | -- |
| As_d | -- | -- | -- | -- | -- |
| As_t | -- | -- | -- | -- | -- |
| Ba_d | -- | -- | -- | -- | -- |
| Ba_t | -- | -- | -- | -- | -- |
| Be_d | -- | -- | -- | -- | -- |
| Be_t | -- | -- | -- | -- | -- |
| Cd_d | -- | -- | -- | -- | -- |
| Cd_t | -- | -- | -- | -- | -- |
| Cd_? | <0.01 A | <0.01 A | -- | -- | -- |
| Co_d | -- | -- | -- | -- | -- |
| Co_t | -- | -- | -- | -- | -- |
| Cr_d | -- | -- | -- | -- | -- |
| Cr_t | -- | -- | -- | -- | -- |
| Cr_? | -- | -- | -- | -- | -- |
| Cu_d | -- | -- | <0.02 | -- | -- |
| Cu_t | -- | -- | -- | -- | -- |
| Cu_? | -- | -- | -- | -- | -- |
| Fe_d | -- | -- | -- | -- | -- |
| Fe_t | -- | -- | -- | -- | -- |
| Fe_? | 0.59 A | 0.45 A | -- | -- | -- |
| Hg_d | -- | -- | -- | -- | -- |
| Hg_t | -- | -- | -- | -- | -- |
| Mn_d | -- | -- | -- | -- | -- |
| Mn_t | -- | -- | -- | -- | -- |
| Mn_? | 0.33 A | 0.44 A | -- | -- | -- |
| Mo_d | -- | -- | 0.014 | -- | -- |
| Mo_t | -- | -- | 0.012 | -- | -- |
| Mo_? | -- | 0.01 A | -- | -- | -- |
| Ni_d | -- | -- | -- | -- | -- |
| Ni_t | -- | -- | -- | -- | -- |
| P_ | -- | -- | 0.04 | -- | -- |
| Pb_d | -- | -- | -- | -- | -- |
| Pb_t | -- | -- | -- | -- | -- |
| Se_d | -- | -- | -- | -- | -- |
| Se_t | -- | -- | -- | -- | -- |
| SiO2 final | -- | -- | -- | -- | -- |
| Tl_d | -- | -- | -- | -- | -- |
| Tl_t | -- | -- | -- | -- | -- |
| V_d | -- | -- | -- | -- | -- |
| V_t | -- | -- | -- | -- | -- |
| Zn_d | -- | -- | 0.05 | -- | -- |
| Zn_t | -- | -- | 0.09 | -- | -- |
| Zn_? | 0.08 A | 0.11 A | -- | -- | -- |
| Total cations (meq/L) | -- | -- | -- | -- | -- |
| Total anions (meq/L) | -- | -- | -- | -- | -- |
| Charge Imbalance (%) | -- | -- | -- | -- | -- |
| Date (mm/dd/yy) | 11/14/78 | 11/15/78 | 12/15/78 | 01/15/79 | 01/16/79 |
| Time (24-hr) | 13:55 | -- | -- | -- | 10:00 |
| Collected by | BLM | Vail Engineering, Inc. | Vail Engineering, Inc. | Vail Engineering, Inc. | BLM |
| Source | USGS, 2003b | Molycorp, Inc., 1979 | Molycorp, Inc., 1979 | Molycorp, Inc., 1979 | USGS, 2003b |
| Measured Discharge (ft3/s) | 9.6 | -- | -- | -- | 6.8 |
| Flow Comments | -- | -- | -- | -- | -- |
| Hydrologic Condition | Low flow | Low flow | Low flow | Low flow | Low flow |
| Avg Daily Discharge (ft3/s) | 11 | -- | -- | -- | 6.8 |
| Avg Monthly Discharge (ft3/s) | -- | 10.5 | 4.53 | 5.95 | -- |
| Max Avg Daily Discharge snowmelt runoff (ft3/s) | 107 | 107 | 107 | 107 | 107 |
| pH-field (SU) | 7.8 | -- | -- | -- | 7.8 |
| pH-lab (SU) | -- | -- | -- | -- | -- |
| SC-field (µS/cm) | -- | -- | -- | -- | -- |
| SC-lab (µS/cm) | 257 | -- | -- | -- | 250 |
| SC, 25°C (µS/cm) | -- | -- | -- | -- | -- |
| Temp, field (°C) | -- | -- | -- | -- | -- |
| TDS, meas (mg/L) | -- | 178 A | 250 A | 210 A | 187 |
| TSS (mg/L) | 20 | 11 A | 11 A | 36 A | 20 |
| DOC (mg/L) | 0.9 | -- | -- | -- | 0.8 |
| Turbidity, field (NTU) | 6 | -- | -- | -- | 8.2 |
| Turbidity, lab (NTU) | -- | -- | -- | -- | -- |
| Turbidity (JTU) | -- | 11 A | 12 A | 13 A | -- |
| Constituent (mg/L) | |||||
| Ca final | 34 | -- | -- | -- | 42 |
| Mg final | 6.2 | -- | -- | -- | 7 |
| Na final | -- | -- | -- | -- | 4.3 |
| K final | -- | -- | -- | -- | 0.9 |
| SO4 final | -- | 73 A | 144 A | 112 A | 95 |
| Alk final (mg/L CaCO3) | 108 | -- | -- | -- | 38 |
| F final | -- | 0.8 A | 0.9 A | 0.9 A | 0.7 |
| Cl final | -- | -- | -- | -- | 1.8 |
| Ag_d | -- | -- | -- | -- | -- |
| Ag_t | -- | -- | -- | -- | -- |
| Al_d | -- | -- | -- | -- | -- |
| Al_s | -- | -- | -- | -- | -- |
| Al_t | -- | -- | -- | -- | -- |
| As_d | -- | -- | -- | -- | -- |
| As_t | -- | -- | -- | -- | -- |
| Ba_d | -- | -- | -- | -- | -- |
| Ba_t | -- | -- | -- | -- | -- |
| Be_d | -- | -- | -- | -- | -- |
| Be_t | -- | -- | -- | -- | -- |
| Cd_d | -- | -- | -- | -- | -- |
| Cd_t | -- | -- | -- | -- | -- |
| Cd_? | -- | <0.01 A | <0.01 A | <0.01 A | -- |
| Co_d | -- | -- | -- | -- | -- |
| Co_t | -- | -- | -- | -- | -- |
| Cr_d | -- | -- | -- | -- | -- |
| Cr_t | -- | -- | -- | -- | -- |
| Cr_? | -- | -- | -- | -- | -- |
| Cu_d | -- | -- | -- | -- | <0.02 |
| Cu_t | -- | -- | -- | -- | -- |
| Cu_? | -- | -- | -- | -- | -- |
| Fe_d | -- | -- | -- | -- | 0.12 |
| Fe_t | -- | -- | -- | -- | -- |
| Fe_? | -- | 0.97 A | 0.45 A | 0.7 A | -- |
| Hg_d | -- | -- | -- | -- | -- |
| Hg_t | -- | -- | -- | -- | -- |
| Mn_d | -- | -- | -- | -- | 0.48 |
| Mn_t | -- | -- | -- | -- | -- |
| Mn_? | -- | 0.39 A | 0.45 A | 0.4 A | -- |
| Mo_d | -- | -- | -- | -- | 0.009 |
| Mo_t | 0.017 | -- | -- | -- | 0.01 |
| Mo_? | -- | -- | -- | -- | -- |
| Ni_d | -- | -- | -- | -- | -- |
| Ni_t | -- | -- | -- | -- | -- |
| P_ | 0.01 | -- | -- | -- | 0.03 |
| Pb_d | -- | -- | -- | -- | -- |
| Pb_t | -- | -- | -- | -- | -- |
| Se_d | -- | -- | -- | -- | -- |
| Se_t | -- | -- | -- | -- | -- |
| SiO2 final | -- | -- | -- | -- | 11 |
| Tl_d | -- | -- | -- | -- | -- |
| Tl_t | -- | -- | -- | -- | -- |
| V_d | -- | -- | -- | -- | -- |
| V_t | -- | -- | -- | -- | -- |
| Zn_d | -- | -- | -- | -- | 0.1 |
| Zn_t | 0.07 | -- | -- | -- | 0.13 |
| Zn_? | -- | 0.23 A | 0.07 A | 0.06 A | -- |
| Total cations (meq/L) | -- | -- | -- | -- | -- |
| Total anions (meq/L) | -- | -- | -- | -- | -- |
| Charge Imbalance (%) | -- | -- | -- | -- | -- |
| Date (mm/dd/yy) | 02/15/79 | 03/15/79 | 03/20/79 | 04/15/79 | 04/26/79 |
| Time (24-hr) | -- | -- | 11:15 | -- | 8:35 |
| Collected by | Vail Engineering, Inc. | Vail Engineering, Inc. | BLM | Vail Engineering, Inc. | BLM |
| Source | Molycorp, Inc., 1979 | Molycorp, Inc., 1979 | USGS, 2003b | Molycorp, Inc., 1979 | USGS, 2003b |
| Measured Discharge (ft3/s) | -- | -- | 12 | -- | 131 |
| Flow Comments | -- | -- | -- | -- | -- |
| Hydrologic Condition | Low flow | Low flow | Low flow | Rising limb | Rising limb |
| Avg Daily Discharge (ft3/s) | -- | -- | 11 | -- | 131 |
| Avg Monthly Discharge (ft3/s) | 6.65 | 10.2 | -- | 62.9 | -- |
| Max Avg Daily Discharge snowmelt runoff (ft3/s) | 107 | 107 | 107 | 557 | 557 |
| pH-field (SU) | -- | -- | 8.2 | -- | 7.6 |
| pH-lab (SU) | -- | -- | -- | -- | -- |
| SC-field (µS/cm) | -- | -- | -- | -- | -- |
| SC-lab (µS/cm) | -- | -- | 270 | -- | 150 |
| SC, 25°C (µS/cm) | -- | -- | -- | -- | -- |
| Temp, field (°C) | -- | -- | -- | -- | -- |
| TDS, meas (mg/L) | 202 A | 199 A | -- | 185 A | 122 |
| TSS (mg/L) | 16 A | 11 A | 27 | 205 A | 554 |
| DOC (mg/L) | -- | -- | 1.5 | -- | 6.8 |
| Turbidity, field (NTU) | -- | -- | 13 | -- | 99 |
| Turbidity, lab (NTU) | -- | -- | -- | -- | -- |
| Turbidity (JTU) | 12 A | 14 A | -- | 77 A | -- |
| Constituent (mg/L) | |||||
| Ca final | -- | -- | 38 | -- | 25 |
| Mg final | -- | -- | 7.5 | -- | 4.6 |
| Na final | -- | -- | -- | -- | 3.4 |
| K final | -- | -- | -- | -- | 1.1 |
| SO4 final | 104 A | 86 A | -- | 56 A | 46 |
| Alk final (mg/L CaCO3) | -- | -- | 49 | -- | 41 |
| F final | 0.8 A | 0.7 A | -- | 0.9 A | 0.4 |
| Cl final | -- | -- | -- | -- | 2 |
| Ag_d | -- | -- | -- | -- | -- |
| Ag_t | -- | -- | -- | -- | -- |
| Al_d | -- | -- | -- | -- | -- |
| Al_s | -- | -- | -- | -- | -- |
| Al_t | -- | -- | -- | -- | -- |
| As_d | -- | -- | -- | -- | -- |
| As_t | -- | -- | -- | -- | -- |
| Ba_d | -- | -- | -- | -- | -- |
| Ba_t | -- | -- | -- | -- | -- |
| Be_d | -- | -- | -- | -- | -- |
| Be_t | -- | -- | -- | -- | -- |
| Cd_d | -- | -- | -- | -- | -- |
| Cd_t | -- | -- | -- | -- | -- |
| Cd_? | <0.01 A | <0.01 A | -- | <0.01 A | -- |
| Co_d | -- | -- | -- | -- | -- |
| Co_t | -- | -- | -- | -- | -- |
| Cr_d | -- | -- | -- | -- | -- |
| Cr_t | -- | -- | -- | -- | -- |
| Cr_? | -- | -- | -- | -- | -- |
| Cu_d | -- | -- | -- | -- | <0.02 |
| Cu_t | -- | -- | -- | -- | -- |
| Cu_? | -- | -- | -- | -- | -- |
| Fe_d | -- | -- | -- | -- | <0.01 |
| Fe_t | -- | -- | -- | -- | -- |
| Fe_? | 2.46 A | 1.1 A | -- | 25.3 A | -- |
| Hg_d | -- | -- | -- | -- | -- |
| Hg_t | -- | -- | -- | -- | -- |
| Mn_d | -- | -- | -- | -- | 0.25 |
| Mn_t | -- | -- | -- | -- | -- |
| Mn_? | 0.34 A | 0.38 A | -- | 0.77 A | -- |
| Mo_d | -- | -- | -- | -- | <0.01 |
| Mo_t | -- | -- | 0.008 | -- | 0.01 |
| Mo_? | -- | -- | -- | -- | -- |
| Ni_d | -- | -- | -- | -- | -- |
| Ni_t | -- | -- | -- | -- | -- |
| P_ | -- | -- | 0.02 | -- | 0.2 |
| Pb_d | -- | -- | -- | -- | -- |
| Pb_t | -- | -- | -- | -- | -- |
| Se_d | -- | -- | -- | -- | -- |
| Se_t | -- | -- | -- | -- | -- |
| SiO2 final | -- | -- | -- | -- | 12 |
| Tl_d | -- | -- | -- | -- | -- |
| Tl_t | -- | -- | -- | -- | -- |
| V_d | -- | -- | -- | -- | -- |
| V_t | -- | -- | -- | -- | -- |
| Zn_d | -- | -- | -- | -- | 0.2 |
| Zn_t | -- | -- | 0.12 | -- | 0.2 |
| Zn_? | 0.05 A | 0.11 A | -- | 0.09 A | -- |
| Total cations (meq/L) | -- | -- | -- | -- | -- |
| Total anions (meq/L) | -- | -- | -- | -- | -- |
| Charge Imbalance (%) | -- | -- | -- | -- | -- |
| Date (mm/dd/yy) | 05/15/79 | 05/23/79 | 06/10/79 | 06/14/79 | 06/15/79 |
| Time (24-hr) | -- | 12:50 | -- | -- | -- |
| Collected by | Vail Engineering, Inc. | BLM | -- | Obby Davidson | Vail Engineering, Inc. |
| Source | Molycorp, Inc., 1979 | USGS, 2003b | Molycorp, Inc., 1979 | Molycorp, Inc., 1979 | Molycorp, Inc., 1979 |
| Measured Discharge (ft3/s) | -- | 359 | -- | -- | -- |
| Flow Comments | -- | -- | -- | -- | -- |
| Hydrologic Condition | Rising limb | Peak | Peak | Peak | Peak |
| Avg Daily Discharge (ft3/s) | -- | 378 | 510.00 | 484 | -- |
| Avg Monthly Discharge (ft3/s) | 267 | -- | -- | -- | 405 |
| Max Avg Daily Discharge snowmelt runoff (ft3/s) | 557 | 557 | 557 | 557 | 557 |
| pH-field (SU) | -- | 7.7 | -- | 7.6 | -- |
| pH-lab (SU) | -- | -- | -- | -- | -- |
| SC-field (µS/cm) | -- | -- | -- | -- | -- |
| SC-lab (µS/cm) | -- | 150 | -- | -- | -- |
| SC, 25°C (µS/cm) | -- | -- | -- | -- | -- |
| Temp, field (°C) | -- | -- | -- | -- | -- |
| TDS, meas (mg/L) | 127 A | 92 | -- | 99 | 110 A |
| TSS (mg/L) | 367 A | 1370 | 980 | 458 | 296 A |
| DOC (mg/L) | -- | -- | -- | -- | -- |
| Turbidity, field (NTU) | -- | 150 | -- | -- | -- |
| Turbidity, lab (NTU) | -- | -- | -- | -- | -- |
| Turbidity (JTU) | 147 A | -- | -- | -- | 175 A |
| Constituent (mg/L) | |||||
| Ca final | -- | 20 | -- | 18 | -- |
| Mg final | -- | 3.4 | -- | 3 | -- |
| Na final | -- | 2.9 | -- | -- | -- |
| K final | -- | 1.2 | -- | -- | -- |
| SO4 final | 33 A | 29 | -- | 14 | 16 A |
| Alk final (mg/L CaCO3) | -- | 38 | -- | -- | -- |
| F final | 0.4 A | 0.4 | -- | 0.3 | 0.3 A |
| Cl final | -- | 1.4 | -- | -- | -- |
| Ag_d | -- | -- | -- | -- | -- |
| Ag_t | -- | -- | -- | -- | -- |
| Al_d | -- | -- | -- | -- | -- |
| Al_s | -- | -- | -- | -- | -- |
| Al_t | -- | -- | -- | -- | -- |
| As_d | -- | -- | -- | -- | -- |
| As_t | -- | -- | -- | -- | -- |
| Ba_d | -- | -- | -- | -- | -- |
| Ba_t | -- | -- | -- | -- | -- |
| Be_d | -- | -- | -- | -- | -- |
| Be_t | -- | -- | -- | -- | -- |
| Cd_d | -- | -- | -- | -- | -- |
| Cd_t | -- | -- | -- | -- | -- |
| Cd_? | <0.01 A | -- | -- | -- | <0.01 A |
| Co_d | -- | -- | -- | -- | -- |
| Co_t | -- | -- | -- | -- | -- |
| Cr_d | -- | -- | -- | -- | -- |
| Cr_t | -- | -- | -- | -- | -- |
| Cr_? | -- | -- | -- | 0.047 | -- |
| Cu_d | -- | -- | -- | -- | -- |
| Cu_t | -- | -- | -- | -- | -- |
| Cu_? | 0.13 A | -- | -- | <0.01 | 0.03 A |
| Fe_d | -- | 0.03 | -- | -- | -- |
| Fe_t | -- | -- | -- | -- | -- |
| Fe_? | 18.1 A | -- | -- | 14.08 | 14.1 A |
| Hg_d | -- | -- | -- | -- | -- |
| Hg_t | -- | -- | -- | -- | -- |
| Mn_d | -- | 0.08 | -- | -- | -- |
| Mn_t | -- | -- | -- | -- | -- |
| Mn_? | 0.87 A | -- | -- | 0.89 | 0.88 A |
| Mo_d | -- | 0.006 | -- | -- | -- |
| Mo_t | -- | 0.017 | -- | -- | -- |
| Mo_? | 0.03 A | -- | -- | -- | 0.05 A |
| Ni_d | -- | -- | -- | -- | -- |
| Ni_t | -- | -- | -- | -- | -- |
| P_ | -- | 0.36 | -- | -- | -- |
| Pb_d | -- | -- | -- | -- | -- |
| Pb_t | -- | -- | -- | -- | -- |
| Se_d | -- | -- | -- | -- | -- |
| Se_t | -- | -- | -- | -- | -- |
| SiO2 final | -- | 9.8 | -- | -- | -- |
| Tl_d | -- | -- | -- | -- | -- |
| Tl_t | -- | -- | -- | -- | -- |
| V_d | -- | -- | -- | -- | -- |
| V_t | -- | -- | -- | -- | -- |
| Zn_d | -- | <0.2 | -- | -- | -- |
| Zn_t | -- | 0.11 | -- | -- | -- |
| Zn_? | 0.3 A | -- | -- | 0.40 | 0.22 A |
| Total cations (meq/L) | -- | -- | -- | -- | -- |
| Total anions (meq/L) | -- | -- | -- | -- | -- |
| Charge Imbalance (%) | -- | -- | -- | -- | -- |
| Date (mm/dd/yy) | 06/18/79 | 07/05/79 | 07/14/79 | 07/15/79 | 07/24/79 |
| Time (24-hr) | 14:15 | -- | -- | -- | 9:40 |
| Collected by | BLM | Molycorp, Inc. | Obby Davidson | Vail Engineering, Inc. | BLM |
| Source | USGS, 2003b | Molycorp, Inc., 1979 | Molycorp, Inc., 1979 | Molycorp, Inc., 1979 | USGS, 2003b |
| Measured Discharge (ft3/s) | 354 | -- | -- | -- | 117 |
| Flow Comments | -- | -- | -- | -- | -- |
| Hydrologic Condition | Peak | Falling limb | Falling limb | Falling limb | Low flow |
| Avg Daily Discharge (ft3/s) | 372 | 249 | 162 | -- | 114 |
| Avg Monthly Discharge (ft3/s) | -- | -- | -- | 172 | -- |
| Max Avg Daily Discharge snowmelt runoff (ft3/s) | 557 | 557 | 557 | 557 | 557 |
| pH-field (SU) | 7.9 | 7.6 | -- | -- | 8 |
| pH-lab (SU) | -- | -- | -- | -- | -- |
| SC-field (µS/cm) | -- | -- | -- | -- | -- |
| SC-lab (µS/cm) | 147 | -- | -- | -- | 190 |
| SC, 25°C (µS/cm) | -- | -- | -- | -- | -- |
| Temp, field (°C) | -- | -- | -- | -- | -- |
| TDS, meas (mg/L) | -- | 99 | -- | 139 A | -- |
| TSS (mg/L) | 1160 | 458 | -- | 18 A | 12 |
| DOC (mg/L) | 10 | -- | -- | -- | 2.8 |
| Turbidity, field (NTU) | 140 | -- | -- | -- | 2.5 |
| Turbidity, lab (NTU) | -- | -- | -- | -- | -- |
| Turbidity (JTU) | -- | -- | -- | 7 A | -- |
| Constituent (mg/L) | |||||
| Ca final | 19 | 18 | -- | -- | 27 |
| Mg final | 3.1 | 3 | -- | -- | 4.7 |
| Na final | -- | -- | -- | -- | -- |
| K final | -- | -- | -- | -- | -- |
| SO4 final | -- | -- | -- | 28 A | -- |
| Alk final (mg/L CaCO3) | 48 | -- | -- | -- | 56 |
| F final | -- | -- | -- | 0.5 A | -- |
| Cl final | -- | -- | -- | -- | -- |
| Ag_d | -- | -- | -- | -- | -- |
| Ag_t | -- | -- | -- | -- | -- |
| Al_d | -- | -- | -- | -- | -- |
| Al_s | -- | -- | -- | -- | -- |
| Al_t | -- | -- | -- | -- | -- |
| As_d | -- | -- | -- | -- | -- |
| As_t | -- | -- | -- | -- | -- |
| Ba_d | -- | -- | -- | -- | -- |
| Ba_t | -- | -- | -- | -- | -- |
| Be_d | -- | -- | -- | -- | -- |
| Be_t | -- | -- | -- | -- | -- |
| Cd_d | <0.002 | -- | -- | -- | <0.002 |
| Cd_t | 0 | -- | -- | -- | -- |
| Cd_? | 0 | -- | -- | <0.01 A | -- |
| Co_d | -- | -- | -- | -- | -- |
| Co_t | -- | -- | -- | -- | -- |
| Cr_d | -- | -- | -- | -- | -- |
| Cr_t | -- | -- | -- | -- | -- |
| Cr_? | -- | 0.047 | -- | -- | -- |
| Cu_d | -- | -- | -- | -- | -- |
| Cu_t | -- | -- | -- | -- | -- |
| Cu_? | -- | <0.01 | -- | <0.01 A | -- |
| Fe_d | -- | -- | -- | -- | -- |
| Fe_t | -- | -- | -- | -- | -- |
| Fe_? | -- | 14.1 | -- | 1.44 A | -- |
| Hg_d | -- | -- | -- | -- | -- |
| Hg_t | -- | -- | -- | -- | -- |
| Mn_d | -- | -- | -- | -- | -- |
| Mn_t | -- | -- | -- | -- | -- |
| Mn_? | -- | 0.89 | -- | 0.33 A | -- |
| Mo_d | -- | -- | -- | -- | -- |
| Mo_t | 0.009 | -- | -- | -- | 0.004 |
| Mo_? | -- | -- | -- | -- | -- |
| Ni_d | -- | -- | -- | -- | -- |
| Ni_t | -- | -- | -- | -- | -- |
| P_ | 0.3 | -- | -- | -- | 0.01 |
| Pb_d | -- | -- | -- | -- | -- |
| Pb_t | -- | -- | -- | -- | -- |
| Se_d | -- | -- | -- | -- | -- |
| Se_t | -- | -- | -- | -- | -- |
| SiO2 final | -- | -- | -- | -- | -- |
| Tl_d | -- | -- | -- | -- | -- |
| Tl_t | -- | -- | -- | -- | -- |
| V_d | -- | -- | -- | -- | -- |
| V_t | -- | -- | -- | -- | -- |
| Zn_d | -- | -- | -- | -- | -- |
| Zn_t | 0.18 | -- | -- | -- | 0.09 |
| Zn_? | -- | 0.40 | -- | 0.08 A | -- |
| Total cations (meq/L) | -- | -- | -- | -- | -- |
| Total anions (meq/L) | -- | -- | -- | -- | -- |
| Charge Imbalance (%) | -- | -- | -- | -- | -- |
| Date (mm/dd/yy) | 07/27/79 | 08/04/79 | 08/10/79 | 08/15/79 | 08/29/79 |
| Time (24-hr) | -- | -- | -- | -- | 14:30 |
| Collected by | Obby Davidson | Obby Davidson | Obby Davidson | Vail Engineering, Inc. | BLM |
| Source | Molycorp, Inc., 1979 | Molycorp, Inc., 1979 | Molycorp, Inc., 1979 | Molycorp, Inc., 1979 | USGS, 2003b |
| Measured Discharge (ft3/s) | -- | -- | -- | -- | 45 |
| Flow Comments | -- | -- | -- | -- | -- |
| Hydrologic Condition | Low flow | Low flow | Low flow | Falling limb | Low flow |
| Avg Daily Discharge (ft3/s) | 103 | 76 | 78 | -- | 46 |
| Avg Monthly Discharge (ft3/s) | -- | -- | -- | 65.5 | -- |
| Max Avg Daily Discharge snowmelt runoff (ft3/s) | 557 | 557 | 557 | 557 | 557 |
| pH-field (SU) | -- | -- | -- | -- | 7.8 |
| pH-lab (SU) | -- | -- | -- | -- | -- |
| SC-field (µS/cm) | -- | -- | -- | -- | -- |
| SC-lab (µS/cm) | -- | -- | -- | -- | 250 |
| SC, 25°C (µS/cm) | -- | -- | -- | -- | -- |
| Temp, field (°C) | -- | -- | -- | -- | -- |
| TDS, meas (mg/L) | -- | -- | -- | 162 A | 158 |
| TSS (mg/L) | -- | -- | -- | 39 A | 66 |
| DOC (mg/L) | -- | -- | -- | -- | 0.9 |
| Turbidity, field (NTU) | -- | -- | -- | -- | 9.2 |
| Turbidity, lab (NTU) | -- | -- | -- | -- | -- |
| Turbidity (JTU) | -- | -- | -- | 24 A | -- |
| Constituent (mg/L) | |||||
| Ca final | -- | -- | -- | -- | 34 |
| Mg final | -- | -- | -- | -- | 6 |
| Na final | -- | -- | -- | -- | 3.7 |
| K final | -- | -- | -- | -- | 1 |
| SO4 final | -- | -- | -- | 32 A | 64 |
| Alk final (mg/L CaCO3) | -- | -- | -- | -- | 61 |
| F final | -- | -- | -- | 0.6 A | 0.5 |
| Cl final | -- | -- | -- | -- | 1.7 |
| Ag_d | -- | -- | -- | -- | -- |
| Ag_t | -- | -- | -- | -- | -- |
| Al_d | -- | -- | -- | -- | -- |
| Al_s | -- | -- | -- | -- | -- |
| Al_t | -- | -- | -- | -- | -- |
| As_d | -- | -- | -- | -- | -- |
| As_t | -- | -- | -- | -- | -- |
| Ba_d | -- | -- | -- | -- | -- |
| Ba_t | -- | -- | -- | -- | -- |
| Be_d | -- | -- | -- | -- | -- |
| Be_t | -- | -- | -- | -- | -- |
| Cd_d | -- | -- | -- | -- | <0.002 |
| Cd_t | -- | -- | -- | -- | -- |
| Cd_? | -- | -- | -- | <0.01 A | -- |
| Co_d | -- | -- | -- | -- | -- |
| Co_t | -- | -- | -- | -- | -- |
| Cr_d | -- | -- | -- | -- | -- |
| Cr_t | -- | -- | -- | -- | -- |
| Cr_? | -- | -- | -- | -- | -- |
| Cu_d | -- | -- | -- | -- | <0.02 |
| Cu_t | -- | -- | -- | -- | -- |
| Cu_? | -- | -- | -- | <0.01 A | -- |
| Fe_d | -- | -- | -- | -- | <0.01 |
| Fe_t | -- | -- | -- | -- | -- |
| Fe_? | -- | -- | -- | 2.49 A | -- |
| Hg_d | -- | -- | -- | -- | -- |
| Hg_t | -- | -- | -- | -- | -- |
| Mn_d | -- | -- | -- | -- | 0.18 |
| Mn_t | -- | -- | -- | -- | -- |
| Mn_? | -- | -- | -- | 0.26 A | -- |
| Mo_d | -- | -- | -- | -- | 0.012 |
| Mo_t | -- | -- | -- | -- | 0.008 |
| Mo_? | -- | -- | -- | -- | -- |
| Ni_d | -- | -- | -- | -- | -- |
| Ni_t | -- | -- | -- | -- | -- |
| P_ | -- | -- | -- | -- | 0.11 |
| Pb_d | -- | -- | -- | -- | -- |
| Pb_t | -- | -- | -- | -- | -- |
| Se_d | -- | -- | -- | -- | -- |
| Se_t | -- | -- | -- | -- | -- |
| SiO2 final | -- | -- | -- | -- | 10 |
| Tl_d | -- | -- | -- | -- | -- |
| Tl_t | -- | -- | -- | -- | -- |
| V_d | -- | -- | -- | -- | -- |
| V_t | -- | -- | -- | -- | -- |
| Zn_d | -- | -- | -- | -- | <0.003 |
| Zn_t | -- | -- | -- | -- | 0.09 |
| Zn_? | -- | -- | -- | 0.12 A | -- |
| Total cations (meq/L) | -- | -- | -- | -- | -- |
| Total anions (meq/L) | -- | -- | -- | -- | -- |
| Charge Imbalance (%) | -- | -- | -- | -- | -- |
| Date (mm/dd/yy) | 09/15/79 | 09/25/79 | 10/15/79 | 10/24/79 | 11/15/79 |
| Time (24-hr) | -- | 16:00 | -- | 14:50 | -- |
| Collected by | Vail Engineering, Inc. | BLM | Vail Engineering, Inc. | BLM | Vail Engineering, Inc. |
| Source | Molycorp, Inc., 1979 | USGS, 2003b | Molycorp, Inc., 1979 | USGS, 2003b | Molycorp, Inc., 1979 |
| Measured Discharge (ft3/s) | -- | 24 | -- | 24 | -- |
| Flow Comments | -- | -- | -- | -- | -- |
| Hydrologic Condition | Low flow | Low flow | Low flow | Low flow | Low flow |
| Avg Daily Discharge (ft3/s) | -- | 26 | -- | 23 | -- |
| Avg Monthly Discharge (ft3/s) | 30.5 | -- | 23.1 | -- | 15.6 |
| Max Avg Daily Discharge snowmelt runoff (ft3/s) | 557 | 557 | 557 | 557 | 557 |
| pH-field (SU) | -- | 7.7 | -- | 7.7 | -- |
| pH-lab (SU) | -- | -- | -- | -- | -- |
| SC-field (µS/cm) | -- | -- | -- | -- | -- |
| SC-lab (µS/cm) | -- | 240 | -- | 281 | -- |
| SC, 25°C (µS/cm) | -- | -- | -- | -- | -- |
| Temp, field (°C) | -- | -- | -- | -- | -- |
| TDS, meas (mg/L) | -- | -- | -- | 186 | -- |
| TSS (mg/L) | -- | 16 | -- | -- | -- |
| DOC (mg/L) | -- | 3.7 | -- | 2.6 | -- |
| Turbidity, field (NTU) | -- | 5.7 | -- | 4.7 | -- |
| Turbidity, lab (NTU) | -- | -- | -- | -- | -- |
| Turbidity (JTU) | -- | -- | -- | -- | -- |
| Constituent (mg/L) | |||||
| Ca final | -- | 35 | -- | 36 | -- |
| Mg final | -- | 6.5 | -- | 7.3 | -- |
| Na final | -- | -- | -- | 4.6 | -- |
| K final | -- | -- | -- | 1.2 | -- |
| SO4 final | -- | -- | -- | 83 | -- |
| Alk final (mg/L CaCO3) | -- | 51 | -- | 52 | -- |
| F final | -- | -- | -- | 0.6 | -- |
| Cl final | -- | -- | -- | 2 | -- |
| Ag_d | -- | -- | -- | -- | -- |
| Ag_t | -- | -- | -- | -- | -- |
| Al_d | -- | -- | -- | -- | -- |
| Al_s | -- | -- | -- | -- | -- |
| Al_t | -- | -- | -- | -- | -- |
| As_d | -- | -- | -- | -- | -- |
| As_t | -- | -- | -- | -- | -- |
| Ba_d | -- | -- | -- | -- | -- |
| Ba_t | -- | -- | -- | -- | -- |
| Be_d | -- | -- | -- | -- | -- |
| Be_t | -- | -- | -- | -- | -- |
| Cd_d | -- | <0.002 | -- | -- | -- |
| Cd_t | -- | -- | -- | 0 | -- |
| Cd_? | <0.01 A | -- | <0.01 A | -- | <0.01 A |
| Co_d | -- | -- | -- | -- | -- |
| Co_t | -- | -- | -- | -- | -- |
| Cr_d | -- | -- | -- | -- | -- |
| Cr_t | -- | -- | -- | -- | -- |
| Cr_? | -- | -- | -- | -- | -- |
| Cu_d | -- | -- | -- | -- | -- |
| Cu_t | -- | -- | -- | -- | -- |
| Cu_? | -- | -- | -- | -- | -- |
| Fe_d | -- | -- | -- | 0.01 | -- |
| Fe_t | -- | -- | -- | -- | -- |
| Fe_? | -- | -- | -- | -- | -- |
| Hg_d | -- | -- | -- | -- | -- |
| Hg_t | -- | -- | -- | -- | -- |
| Mn_d | -- | -- | -- | 0.31 | -- |
| Mn_t | -- | -- | -- | -- | -- |
| Mn_? | -- | -- | -- | -- | -- |
| Mo_d | -- | -- | -- | 0.001 | -- |
| Mo_t | -- | 0.006 | -- | 0.007 | -- |
| Mo_? | -- | -- | -- | -- | -- |
| Ni_d | -- | -- | -- | -- | -- |
| Ni_t | -- | -- | -- | -- | -- |
| P_ | -- | 0.02 | -- | 0.02 | -- |
| Pb_d | -- | -- | -- | -- | -- |
| Pb_t | -- | -- | -- | -- | -- |
| Se_d | -- | -- | -- | -- | -- |
| Se_t | -- | -- | -- | -- | -- |
| SiO2 final | -- | -- | -- | 19 | -- |
| Tl_d | -- | -- | -- | -- | -- |
| Tl_t | -- | -- | -- | -- | -- |
| V_d | -- | -- | -- | -- | -- |
| V_t | -- | -- | -- | -- | -- |
| Zn_d | -- | -- | -- | 0.05 | -- |
| Zn_t | -- | 0.06 | -- | 0.06 | -- |
| Zn_? | -- | -- | -- | -- | -- |
| Total cations (meq/L) | -- | -- | -- | -- | -- |
| Total anions (meq/L) | -- | -- | -- | -- | -- |
| Charge Imbalance (%) | -- | -- | -- | -- | -- |
| Date (mm/dd/yy) | 12/04/79 | 12/15/79 | 12/17/79 | 12/17/79 | 02/07/80 |
| Time (24-hr) | 11:40 | -- | 13:30 | 14:30 | 11:55 |
| Collected by | BLM | Vail Engineering, Inc. | BLM | BLM | BLM |
| Source | USGS, 2003b | Molycorp, Inc., 1979 | USGS, 2003b | USGS, 2003b | USGS, 2003b |
| Measured Discharge (ft3/s) | 12 | -- | 14 | 13 | 13 |
| Flow Comments | -- | -- | -- | -- | -- |
| Hydrologic Condition | Low flow | Low flow | Low flow | Low flow | Low flow |
| Avg Daily Discharge (ft3/s) | 13 | -- | 14 | 14 | 13 |
| Avg Monthly Discharge (ft3/s) | -- | 13.5 | -- | -- | -- |
| Max Avg Daily Discharge snowmelt runoff (ft3/s) | 557 | 557 | 557 | 557 | 557 |
| pH-field (SU) | 7.1 | -- | 7.8 | 7.5 | 7.5 |
| pH-lab (SU) | -- | -- | -- | -- | -- |
| SC-field (µS/cm) | -- | -- | -- | -- | -- |
| SC-lab (µS/cm) | 340 | -- | 350 | 340 | 290 |
| SC, 25°C (µS/cm) | -- | -- | -- | -- | -- |
| Temp, field (°C) | -- | -- | -- | -- | -- |
| TDS, meas (mg/L) | 198 | -- | 201 | -- | 132 |
| TSS (mg/L) | 41 | -- | 212 | 462 | -- |
| DOC (mg/L) | 2.9 | -- | -- | -- | -- |
| Turbidity, field (NTU) | 12 | -- | 130 | -- | 1 |
| Turbidity, lab (NTU) | -- | -- | -- | -- | -- |
| Turbidity (JTU) | -- | -- | -- | -- | -- |
| Constituent (mg/L) | |||||
| Ca final | 44 | -- | 45 | 55 | 42 |
| Mg final | 8.2 | -- | 7.7 | 8.5 | 8.6 |
| Na final | 5 | -- | 5.1 | 5.3 | 5.8 |
| K final | 1.2 | -- | 1.7 | 2.1 | 1.1 |
| SO4 final | 100 | -- | 100 | -- | 36 |
| Alk final (mg/L CaCO3) | 38 | -- | 45 | -- | 38 |
| F final | 1.1 | -- | 0.5 | -- | 0.4 |
| Cl final | 2.7 | -- | 2.5 | -- | 0.6 |
| Ag_d | -- | -- | -- | -- | -- |
| Ag_t | -- | -- | -- | -- | -- |
| Al_d | -- | -- | -- | -- | -- |
| Al_s | -- | -- | -- | -- | -- |
| Al_t | -- | -- | -- | -- | -- |
| As_d | -- | -- | -- | -- | -- |
| As_t | -- | -- | -- | -- | -- |
| Ba_d | -- | -- | -- | -- | -- |
| Ba_t | -- | -- | -- | -- | -- |
| Be_d | -- | -- | -- | -- | -- |
| Be_t | -- | -- | -- | -- | -- |
| Cd_d | -- | -- | -- | -- | -- |
| Cd_t | 0.001 | -- | 0.001 | -- | 0.001 |
| Cd_? | -- | <0.01 A | -- | -- | -- |
| Co_d | -- | -- | -- | -- | -- |
| Co_t | -- | -- | -- | -- | -- |
| Cr_d | -- | -- | -- | -- | -- |
| Cr_t | -- | -- | -- | -- | -- |
| Cr_? | -- | -- | -- | -- | -- |
| Cu_d | -- | -- | -- | -- | -- |
| Cu_t | -- | -- | -- | -- | -- |
| Cu_? | -- | -- | -- | -- | -- |
| Fe_d | 0.02 | -- | 0.01 | 0.01 | 0.02 |
| Fe_t | -- | -- | -- | -- | -- |
| Fe_? | -- | -- | -- | -- | -- |
| Hg_d | -- | -- | -- | -- | -- |
| Hg_t | -- | -- | -- | -- | -- |
| Mn_d | 0.6 | -- | 0.49 | 0.58 | 0.49 |
| Mn_t | -- | -- | -- | -- | -- |
| Mn_? | -- | -- | -- | -- | -- |
| Mo_d | <0.01 | -- | 0.053 | -- | <0.01 |
| Mo_t | 0.003 | -- | 0.052 | 0.13 | 0.007 |
| Mo_? | -- | -- | -- | -- | -- |
| Ni_d | -- | -- | -- | -- | -- |
| Ni_t | -- | -- | -- | -- | -- |
| P_ | 0.03 | -- | 0.23 | -- | 0.04 |
| Pb_d | -- | -- | -- | -- | -- |
| Pb_t | -- | -- | -- | -- | -- |
| Se_d | -- | -- | -- | -- | -- |
| Se_t | -- | -- | -- | -- | -- |
| SiO2 final | 11 | -- | 10 | -- | 13 |
| Tl_d | -- | -- | -- | -- | -- |
| Tl_t | -- | -- | -- | -- | -- |
| V_d | -- | -- | -- | -- | -- |
| V_t | -- | -- | -- | -- | -- |
| Zn_d | 0.13 | -- | 0.08 | 0.06 | 0.09 |
| Zn_t | 0.14 | -- | 0.17 | 0.27 | 0.16 |
| Zn_? | -- | -- | -- | -- | -- |
| Total cations (meq/L) | -- | -- | -- | -- | -- |
| Total anions (meq/L) | -- | -- | -- | -- | -- |
| Charge Imbalance (%) | -- | -- | -- | -- | -- |
| Date (mm/dd/yy) | 04/02/80 | 04/28/80 | 06/03/80 | 07/09/80 | 08/14/80 |
| Time (24-hr) | 15:30 | 18:30 | 15:40 | 16:00 | 16:45 |
| Collected by | BLM | BLM | BLM | BLM | BLM |
| Source | USGS, 2003b | USGS, 2003b | USGS, 2003b | USGS, 2003b | USGS, 2003b |
| Measured Discharge (ft3/s) | 17 | 38 | 176 | 82 | 32 |
| Flow Comments | -- | -- | -- | -- | -- |
| Hydrologic Condition | Low flow | Rising limb | Falling limb | Falling limb | Low flow |
| Avg Daily Discharge (ft3/s) | 15 | 38 | 176 | 85 | 31 |
| Avg Monthly Discharge (ft3/s) | -- | -- | -- | -- | -- |
| Max Avg Daily Discharge snowmelt runoff (ft3/s) | 557 | 278 | 278 | 278 | 278 |
| pH-field (SU) | 7.6 | 7.7 | 8 | 7.8 | 8 |
| pH-lab (SU) | -- | -- | -- | -- | -- |
| SC-field (µS/cm) | -- | -- | -- | -- | -- |
| SC-lab (µS/cm) | 294 | 278 | 157 | 190 | 238 |
| SC, 25°C (µS/cm) | -- | -- | -- | -- | -- |
| Temp, field (°C) | -- | -- | -- | -- | -- |
| TDS, meas (mg/L) | 132 | 164 | 93 | 118 | 157 |
| TSS (mg/L) | 30 | 478 | -- | -- | 2 |
| DOC (mg/L) | 2.2 | 2 | 4.6 | 1.3 | 4 |
| Turbidity, field (NTU) | 8.8 | 17 | 7.2 | 2.1 | 66 |
| Turbidity, lab (NTU) | -- | -- | -- | -- | -- |
| Turbidity (JTU) | -- | -- | -- | -- | -- |
| Constituent (mg/L) | |||||
| Ca final | 38 | 35 | 21 | 28 | 34 |
| Mg final | 7.7 | 6.9 | 3.5 | 4.6 | 6.3 |
| Na final | 4.5 | 4.6 | 3.1 | 3.4 | 4.5 |
| K final | 1 | 1 | 0.7 | 0.9 | 1.1 |
| SO4 final | 100 | 74 | 28 | 40 | 66 |
| Alk final (mg/L CaCO3) | 44 | 48 | 42 | 51 | 49 |
| F final | 0.7 | 0.5 | 0.1 | 0.5 | 0.6 |
| Cl final | 2.5 | 2.1 | 0.8 | 1 | 2.5 |
| Ag_d | -- | -- | -- | -- | -- |
| Ag_t | -- | -- | -- | -- | -- |
| Al_d | -- | -- | -- | -- | -- |
| Al_s | -- | -- | -- | -- | -- |
| Al_t | -- | -- | -- | -- | -- |
| As_d | -- | -- | -- | -- | -- |
| As_t | -- | -- | -- | -- | -- |
| Ba_d | -- | -- | -- | -- | -- |
| Ba_t | -- | -- | -- | -- | -- |
| Be_d | -- | -- | -- | -- | -- |
| Be_t | -- | -- | -- | -- | -- |
| Cd_d | -- | -- | -- | -- | -- |
| Cd_t | -- | 0.001 | -- | 0.001 | -- |
| Cd_? | -- | -- | -- | -- | -- |
| Co_d | -- | -- | -- | -- | -- |
| Co_t | -- | -- | -- | -- | -- |
| Cr_d | -- | -- | -- | -- | -- |
| Cr_t | -- | -- | -- | -- | -- |
| Cr_? | -- | -- | -- | -- | -- |
| Cu_d | -- | -- | -- | -- | -- |
| Cu_t | -- | -- | -- | -- | -- |
| Cu_? | -- | -- | -- | -- | -- |
| Fe_d | <0.01 | <0.01 | 0.14 | 0.01 | 0.02 |
| Fe_t | -- | -- | -- | -- | -- |
| Fe_? | -- | -- | -- | -- | -- |
| Hg_d | -- | -- | -- | -- | -- |
| Hg_t | -- | -- | -- | -- | -- |
| Mn_d | 0.45 | 0.39 | 0.11 | 0.16 | 0.3 |
| Mn_t | -- | -- | -- | -- | -- |
| Mn_? | -- | -- | -- | -- | -- |
| Mo_d | <0.01 | <0.01 | 0.002 | <0.01 | 0.006 |
| Mo_t | 0.01 | 0.006 | 0 | 0.006 | 0.007 |
| Mo_? | -- | -- | -- | -- | -- |
| Ni_d | -- | -- | -- | -- | -- |
| Ni_t | -- | -- | -- | -- | -- |
| P_ | 0.06 | 0.07 | 0.04 | 0.03 | 0.13 |
| Pb_d | -- | -- | -- | -- | -- |
| Pb_t | -- | -- | -- | -- | -- |
| Se_d | -- | -- | -- | -- | -- |
| Se_t | -- | -- | -- | -- | -- |
| SiO2 final | 10 | 11 | 10 | 9 | 11 |
| Tl_d | -- | -- | -- | -- | -- |
| Tl_t | -- | -- | -- | -- | -- |
| V_d | -- | -- | -- | -- | -- |
| V_t | -- | -- | -- | -- | -- |
| Zn_d | 0.07 | 0.05 | 0.02 | 0.02 | 0.03 |
| Zn_t | 0.12 | 0.11 | 0.05 | 0.05 | 0.11 |
| Zn_? | -- | -- | -- | -- | -- |
| Total cations (meq/L) | -- | -- | -- | -- | -- |
| Total anions (meq/L) | -- | -- | -- | -- | -- |
| Charge Imbalance (%) | -- | -- | -- | -- | -- |
| Date (mm/dd/yy) | 09/10/80 | 10/14/80 | 11/19/80 | 01/08/81 | 03/10/81 |
| Time (24-hr) | 9:00 | 14:45 | 14:20 | 16:15 | 12:45 |
| Collected by | BLM | BLM | BLM | BLM | BLM |
| Source | USGS, 2003b | USGS, 2003b | USGS, 2003b | USGS, 2003b | USGS, 2003b |
| Measured Discharge (ft3/s) | 46 | 12 | 5 | 9.5 | 5.9 |
| Flow Comments | -- | -- | -- | -- | -- |
| Hydrologic Condition | Storm | Low flow | Low flow | Low flow | Low flow |
| Avg Daily Discharge (ft3/s) | 44 | 13 | 4.9 | 7.5 | 5.9 |
| Avg Monthly Discharge (ft3/s) | -- | -- | -- | -- | -- |
| Max Avg Daily Discharge snowmelt runoff (ft3/s) | 278 | 278 | 278 | 278 | 278 |
| pH-field (SU) | 8 | 7.7 | 7 | 7.3 | 7.1 |
| pH-lab (SU) | -- | 7.7 | 7.6 | 7.4 | 7.5 |
| SC-field (µS/cm) | -- | 270 | -- | -- | -- |
| SC-lab (µS/cm) | 220 | 302 | 320 | 290 | 340 |
| SC, 25°C (µS/cm) | -- | -- | 354 | 320 | 362 |
| Temp, field (°C) | -- | -- | -- | -- | -- |
| TDS, meas (mg/L) | 142 | 200 | 209 | 210 | 232 |
| TSS (mg/L) | 144 | -- | -- | -- | 150 |
| DOC (mg/L) | 5.2 | 4.1 | 1 | 14 | 1.6 |
| Turbidity, field (NTU) | 40 | 0.4 | 18 | 13 | 56 |
| Turbidity, lab (NTU) | -- | -- | -- | -- | -- |
| Turbidity (JTU) | -- | -- | -- | -- | -- |
| Constituent (mg/L) | |||||
| Ca final | 33 | 41 | 43 | 43 | 48 |
| Mg final | 5.9 | 8.2 | 8.3 | 8.4 | 9.5 |
| Na final | 3.8 | 5 | 4.8 | 5.2 | 5.1 |
| K final | 1.4 | 1.1 | 1.2 | 1.1 | 1.2 |
| SO4 final | 55 | 100 | 120 | 110 | 140 |
| Alk final (mg/L CaCO3) | 50 | 48 | 33 | 43 | 28 |
| F final | 0.4 | 1.8 | 0.9 | 0.9 | 1.1 |
| Cl final | 2 | 2.2 | 2.2 | 1.9 | 2.2 |
| Ag_d | -- | -- | -- | -- | -- |
| Ag_t | -- | -- | -- | -- | -- |
| Al_d | -- | -- | -- | -- | -- |
| Al_s | -- | -- | -- | -- | -- |
| Al_t | -- | -- | -- | -- | -- |
| As_d | -- | -- | -- | -- | -- |
| As_t | -- | -- | -- | -- | -- |
| Ba_d | -- | -- | -- | -- | -- |
| Ba_t | -- | -- | -- | -- | -- |
| Be_d | -- | -- | -- | -- | -- |
| Be_t | -- | -- | -- | -- | -- |
| Cd_d | -- | -- | -- | -- | -- |
| Cd_t | 0.001 | 0.001 | 0.009 | 0.001 | 0.001 |
| Cd_? | -- | -- | -- | -- | -- |
| Co_d | -- | -- | -- | -- | -- |
| Co_t | -- | -- | -- | -- | -- |
| Cr_d | -- | -- | -- | -- | -- |
| Cr_t | -- | -- | -- | -- | -- |
| Cr_? | -- | -- | -- | -- | -- |
| Cu_d | -- | -- | -- | -- | -- |
| Cu_t | -- | -- | -- | -- | -- |
| Cu_? | -- | -- | -- | -- | -- |
| Fe_d | 0.02 | 0.01 | 0.14 | 0.08 | 0.07 |
| Fe_t | -- | -- | -- | -- | -- |
| Fe_? | -- | -- | -- | -- | -- |
| Hg_d | -- | -- | -- | -- | -- |
| Hg_t | -- | -- | -- | -- | -- |
| Mn_d | 0.19 | 0.49 | 0.94 | 0.6 | 0.95 |
| Mn_t | -- | -- | -- | -- | -- |
| Mn_? | -- | -- | -- | -- | -- |
| Mo_d | <0.01 | 0.006 | <0.01 | 0.01 | <0.01 |
| Mo_t | 0.009 | 0.008 | 0.012 | 0.009 | 0.027 |
| Mo_? | -- | -- | -- | -- | -- |
| Ni_d | -- | -- | -- | -- | -- |
| Ni_t | -- | -- | -- | -- | -- |
| P_ | 0.2 | 0.05 | 0.01 | 0.08 | 0.03 |
| Pb_d | -- | -- | -- | -- | -- |
| Pb_t | -- | -- | -- | -- | -- |
| Se_d | -- | -- | -- | -- | -- |
| Se_t | -- | -- | -- | -- | -- |
| SiO2 final | 9.9 | 11 | 10 | 11 | 10 |
| Tl_d | -- | -- | -- | -- | -- |
| Tl_t | -- | -- | -- | -- | -- |
| V_d | -- | -- | -- | -- | -- |
| V_t | -- | -- | -- | -- | -- |
| Zn_d | 0.03 | 0.07 | 0.19 | 0.11 | 0.16 |
| Zn_t | 0.14 | 0.33 | -- | 0.14 | 0.26 |
| Zn_? | -- | -- | -- | -- | -- |
| Total cations (meq/L) | -- | -- | -- | -- | -- |
| Total anions (meq/L) | -- | -- | -- | -- | -- |
| Charge Imbalance (%) | -- | -- | -- | -- | -- |
| Date (mm/dd/yy) | 03/11/81 | 04/13/81 | 05/14/81 | 06/10/81 | 07/14/81 |
| Time (24-hr) | 12:30 | 16:00 | 16:30 | 14:15 | 15:30 |
| Collected by | BLM | BLM | BLM | BLM | BLM |
| Source | USGS, 2003b | USGS, 2003b | USGS, 2003b | USGS, 2003b | USGS, 2003b |
| Measured Discharge (ft3/s) | 5 | 12 | 19 | 51 | 20 |
| Flow Comments | -- | -- | -- | -- | -- |
| Hydrologic Condition | Low flow | Rising limb | Rising limb | Peak | Low flow |
| Avg Daily Discharge (ft3/s) | 5.3 | 12 | 19 | 47 | 18 |
| Avg Monthly Discharge (ft3/s) | -- | -- | -- | -- | -- |
| Max Avg Daily Discharge snowmelt runoff (ft3/s) | 278 | 47 | 47 | 47 | 47 |
| pH-field (SU) | 7.2 | 7.6 | 7.7 | 7.5 | 7.8 |
| pH-lab (SU) | 7.6 | 7.5 | 7.7 | 7.7 | 7.6 |
| SC-field (µS/cm) | -- | -- | -- | -- | -- |
| SC-lab (µS/cm) | 330 | 278 | 271 | 185 | 270 |
| SC, 25°C (µS/cm) | 350 | 290 | 271 | 200 | 280 |
| Temp, field (°C) | -- | -- | -- | -- | -- |
| TDS, meas (mg/L) | 242 | 174 | 170 | 118 | 173 |
| TSS (mg/L) | 27 | 54 | -- | 63 | 35 |
| DOC (mg/L) | 2.2 | 4.2 | 3 | 4.3 | 2.1 |
| Turbidity, field (NTU) | 31 | 33 | 4.6 | 5.2 | 18 |
| Turbidity, lab (NTU) | -- | -- | -- | -- | -- |
| Turbidity (JTU) | -- | -- | -- | -- | -- |
| Constituent (mg/L) | |||||
| Ca final | 47 | 38 | 37 | 28 | 39 |
| Mg final | 9.6 | 7.4 | 7.2 | 4.8 | 7.5 |
| Na final | 5.4 | 5.2 | 4.4 | 3.4 | 5 |
| K final | 1.2 | 1.3 | 1.1 | 1 | 1.3 |
| SO4 final | 150 | 87 | 77 | 47 | 83 |
| Alk final (mg/L CaCO3) | 34 | 43 | 41 | -- | 48 |
| F final | 1 | 0.8 | 0.6 | 0.4 | 0.7 |
| Cl final | 2.2 | 2.8 | 1.5 | 1 | 1.9 |
| Ag_d | -- | -- | -- | -- | -- |
| Ag_t | -- | -- | -- | -- | -- |
| Al_d | -- | -- | -- | -- | -- |
| Al_s | -- | -- | -- | -- | -- |
| Al_t | -- | -- | -- | -- | -- |
| As_d | -- | -- | -- | -- | -- |
| As_t | -- | -- | -- | -- | -- |
| Ba_d | -- | -- | -- | -- | -- |
| Ba_t | -- | -- | -- | -- | -- |
| Be_d | -- | -- | -- | -- | -- |
| Be_t | -- | -- | -- | -- | -- |
| Cd_d | -- | -- | -- | -- | -- |
| Cd_t | 0.001 | -- | 0.001 | -- | 0.001 |
| Cd_? | -- | -- | -- | -- | -- |
| Co_d | -- | -- | -- | -- | -- |
| Co_t | -- | -- | -- | -- | -- |
| Cr_d | -- | -- | -- | -- | -- |
| Cr_t | -- | -- | -- | -- | -- |
| Cr_? | -- | -- | -- | -- | -- |
| Cu_d | -- | 0.005 | -- | -- | -- |
| Cu_t | -- | -- | -- | -- | -- |
| Cu_? | -- | -- | -- | -- | -- |
| Fe_d | 0.11 | 0.02 | 0.02 | 0.03 | 0.01 |
| Fe_t | -- | -- | -- | -- | -- |
| Fe_? | -- | -- | -- | -- | -- |
| Hg_d | -- | -- | -- | -- | -- |
| Hg_t | -- | -- | -- | -- | -- |
| Mn_d | 0.99 | 0.47 | 0.35 | 0.16 | 0.35 |
| Mn_t | -- | -- | -- | -- | -- |
| Mn_? | -- | -- | -- | -- | -- |
| Mo_d | 0.014 | <0.01 | <0.01 | <0.01 | 0.011 |
| Mo_t | 0.011 | 0.1 | 0.001 | 0.006 | 0.019 |
| Mo_? | -- | -- | -- | -- | -- |
| Ni_d | -- | -- | -- | -- | -- |
| Ni_t | -- | -- | -- | -- | -- |
| P_ | -- | 0.12 | 0.02 | 0.02 | 0.08 |
| Pb_d | -- | -- | -- | -- | -- |
| Pb_t | -- | -- | -- | -- | -- |
| Se_d | -- | -- | -- | -- | -- |
| Se_t | -- | -- | -- | -- | -- |
| SiO2 final | 10 | 9.4 | 10 | 8.2 | 11 |
| Tl_d | -- | -- | -- | -- | -- |
| Tl_t | -- | -- | -- | -- | -- |
| V_d | -- | -- | -- | -- | -- |
| V_t | -- | -- | -- | -- | -- |
| Zn_d | 0.21 | 0.05 | 0.04 | 0.06 | 0.03 |
| Zn_t | 0.22 | 0.13 | 0.16 | 0.06 | 0.09 |
| Zn_? | -- | -- | -- | -- | -- |
| Total cations (meq/L) | -- | -- | -- | -- | -- |
| Total anions (meq/L) | -- | -- | -- | -- | -- |
| Charge Imbalance (%) | -- | -- | -- | -- | -- |
| Date (mm/dd/yy) | 07/17/81 | 08/12/81 | 08/13/81 | 08/20/81 | 10/09/81 |
| Time (24-hr) | 22:00 | -- | 16:00 | -- | 14:00 |
| Collected by | BLM | BLM | BLM | Vail Engineering, Inc. | BLM |
| Source | USGS, 2003b | USGS, 2003b | USGS, 2003b | Vail Engineering, Inc., 1989 | USGS, 2003b |
| Measured Discharge (ft3/s) | 18 | 29 | 19 | 40 | 15 |
| Flow Comments | -- | -- | -- | -- | -- |
| Hydrologic Condition | Low flow | Storm | Storm | Low flow | Low flow |
| Avg Daily Discharge (ft3/s) | 15 | 28 | 21 | 19 | 14 |
| Avg Monthly Discharge (ft3/s) | -- | -- | -- | -- | -- |
| Max Avg Daily Discharge snowmelt runoff (ft3/s) | 47 | 47 | 47 | 47 | 47 |
| pH-field (SU) | 7.5 | -- | 7.5 | 7.2 | 7.5 |
| pH-lab (SU) | 7.5 | 4.1 | 7.2 | -- | 7.7 |
| SC-field (µS/cm) | -- | -- | -- | -- | -- |
| SC-lab (µS/cm) | 270 | -- | 258 | -- | 280 |
| SC, 25°C (µS/cm) | 310 | 508 | 283 | -- | 278 |
| Temp, field (°C) | -- | -- | -- | -- | -- |
| TDS, meas (mg/L) | -- | -- | 169 | -- | 185 |
| TSS (mg/L) | 3970 | 6550 | 41 | -- | 30 |
| DOC (mg/L) | -- | -- | 2 | -- | 1.7 |
| Turbidity, field (NTU) | -- | -- | 9.1 | -- | 8.8 |
| Turbidity, lab (NTU) | -- | -- | -- | -- | -- |
| Turbidity (JTU) | -- | -- | -- | 7.5 | -- |
| Constituent (mg/L) | |||||
| Ca final | 41 | 72 | 37 | -- | 39 |
| Mg final | 7 | 11 | 7.2 | -- | 8.1 |
| Na final | 4.7 | 6 | 5.6 | -- | 4.6 |
| K final | -- | -- | 1.2 | -- | 1.3 |
| SO4 final | -- | -- | 74 | 118 | 92 |
| Alk final (mg/L CaCO3) | -- | -- | 49 | 40 | 48 |
| F final | -- | -- | 0.5 | -- | 0.8 |
| Cl final | -- | -- | 1.6 | -- | 2.7 |
| Ag_d | -- | -- | -- | -- | -- |
| Ag_t | -- | -- | -- | -- | -- |
| Al_d | -- | -- | -- | -- | -- |
| Al_s | -- | -- | -- | -- | -- |
| Al_t | -- | -- | -- | -- | -- |
| As_d | -- | -- | -- | -- | -- |
| As_t | -- | 0.022 | -- | -- | -- |
| Ba_d | 0.03 | 0.026 | -- | -- | -- |
| Ba_t | -- | -- | -- | -- | -- |
| Be_d | 0.001 | 0.002 | -- | -- | -- |
| Be_t | -- | -- | -- | -- | -- |
| Cd_d | <0.001 | 0.002 | -- | -- | -- |
| Cd_t | -- | 0.001 | 0.001 | -- | -- |
| Cd_? | -- | -- | -- | -- | -- |
| Co_d | <0.003 | 0.023 | -- | -- | -- |
| Co_t | -- | -- | -- | -- | -- |
| Cr_d | -- | -- | -- | -- | -- |
| Cr_t | 0.02 | 0.06 | -- | -- | -- |
| Cr_? | -- | -- | -- | -- | -- |
| Cu_d | <0.01 | 0.04 | -- | -- | -- |
| Cu_t | 0.11 | 0.48 | -- | -- | -- |
| Cu_? | -- | -- | -- | -- | -- |
| Fe_d | 0.02 | <0.01 | <0.01 | -- | <0.01 |
| Fe_t | 38 | 180 | -- | -- | -- |
| Fe_? | -- | -- | -- | -- | -- |
| Hg_d | -- | -- | -- | -- | -- |
| Hg_t | -- | -- | -- | -- | -- |
| Mn_d | 0.061 | 1.5 | 0.34 | -- | 0.39 |
| Mn_t | 0.7 | 2.6 | -- | -- | -- |
| Mn_? | -- | -- | -- | -- | -- |
| Mo_d | 0.019 | <0.01 | 0.01 | -- | 0.01 |
| Mo_t | 0.03 | 0.14 | 0.008 | -- | 0.007 |
| Mo_? | -- | -- | -- | -- | -- |
| Ni_d | -- | -- | -- | -- | -- |
| Ni_t | -- | -- | -- | -- | -- |
| P_ | -- | -- | 0.14 | -- | 0.08 |
| Pb_d | <0.01 | <0.01 | -- | -- | -- |
| Pb_t | 0.16 | 0.84 | -- | -- | -- |
| Se_d | -- | -- | -- | -- | -- |
| Se_t | -- | 0.005 | -- | -- | -- |
| SiO2 final | 10 | 14 | 11 | -- | 12 |
| Tl_d | -- | -- | -- | -- | -- |
| Tl_t | -- | -- | -- | -- | -- |
| V_d | <0.006 | <0.006 | -- | -- | -- |
| V_t | -- | -- | -- | -- | -- |
| Zn_d | 0.014 | 0.36 | 0.038 | -- | 0.043 |
| Zn_t | 0.23 | 0.75 | 0.1 | -- | 0.11 |
| Zn_? | -- | -- | -- | -- | -- |
| Total cations (meq/L) | -- | -- | -- | -- | -- |
| Total anions (meq/L) | -- | -- | -- | -- | -- |
| Charge Imbalance (%) | -- | -- | -- | -- | -- |
| Date (mm/dd/yy) | 11/05/81 | 02/17/82 | 03/24/82 | 04/29/82 | 06/02/82 |
| Time (24-hr) | 11:00 | 11:50 | 14:15 | 13:30 | 15:00 |
| Collected by | BLM | BLM | BLM | BLM | BLM |
| Source | USGS, 2003b | USGS, 2003b | USGS, 2003b | USGS, 2003b | USGS, 2003b |
| Measured Discharge (ft3/s) | 13 | 13 | 15 | 30 | 131 |
| Flow Comments | -- | -- | -- | -- | -- |
| Hydrologic Condition | Low flow | Low flow | Low flow | Rising limb | Peak |
| Avg Daily Discharge (ft3/s) | 13 | 13 | 15 | 29 | 137 |
| Avg Monthly Discharge (ft3/s) | -- | -- | -- | -- | -- |
| Max Avg Daily Discharge snowmelt runoff (ft3/s) | 47 | 47 | 47 | 142 | 142 |
| pH-field (SU) | 7.6 | 7.3 | 7.2 | 7.4 | 6.8 |
| pH-lab (SU) | 7.8 | -- | -- | -- | -- |
| SC-field (µS/cm) | -- | -- | -- | -- | -- |
| SC-lab (µS/cm) | 290 | 325 | 320 | 250 | 160 |
| SC, 25°C (µS/cm) | 309 | -- | -- | -- | -- |
| Temp, field (°C) | -- | -- | -- | -- | -- |
| TDS, meas (mg/L) | 190 | -- | -- | -- | -- |
| TSS (mg/L) | 11 | 39 | 32 | -- | 99 |
| DOC (mg/L) | 1.3 | 0.9 | 1.3 | -- | -- |
| Turbidity, field (NTU) | 0.5 | -- | -- | -- | -- |
| Turbidity, lab (NTU) | -- | -- | -- | -- | -- |
| Turbidity (JTU) | -- | -- | -- | -- | -- |
| Constituent (mg/L) | |||||
| Ca final | 41 | -- | -- | -- | -- |
| Mg final | 8.3 | -- | -- | -- | -- |
| Na final | 4.6 | -- | -- | -- | -- |
| K final | 1.3 | -- | -- | -- | -- |
| SO4 final | 97 | -- | -- | -- | -- |
| Alk final (mg/L CaCO3) | 43 | 36 | 39 | -- | -- |
| F final | 0.8 | -- | -- | -- | -- |
| Cl final | 2.5 | -- | -- | -- | -- |
| Ag_d | -- | -- | -- | -- | -- |
| Ag_t | -- | -- | -- | -- | -- |
| Al_d | -- | -- | -- | -- | -- |
| Al_s | -- | -- | -- | -- | -- |
| Al_t | -- | -- | -- | -- | -- |
| As_d | -- | -- | -- | -- | -- |
| As_t | -- | -- | -- | -- | -- |
| Ba_d | -- | -- | -- | -- | -- |
| Ba_t | -- | -- | -- | -- | -- |
| Be_d | -- | -- | -- | -- | -- |
| Be_t | -- | -- | -- | -- | -- |
| Cd_d | -- | -- | -- | -- | -- |
| Cd_t | <0.001 | <0.001 | 0.68 | 0.41 | 0.19 |
| Cd_? | -- | -- | -- | -- | -- |
| Co_d | -- | -- | -- | -- | -- |
| Co_t | -- | -- | -- | -- | -- |
| Cr_d | -- | -- | -- | -- | -- |
| Cr_t | -- | -- | -- | -- | -- |
| Cr_? | -- | -- | -- | -- | -- |
| Cu_d | -- | -- | -- | -- | -- |
| Cu_t | -- | 0.036 | 0.023 | 0.017 | 0.017 |
| Cu_? | -- | -- | -- | -- | -- |
| Fe_d | 0.02 | 0.03 | 0.01 | 0.07 | 0.04 |
| Fe_t | -- | -- | -- | -- | -- |
| Fe_? | -- | -- | -- | -- | -- |
| Hg_d | -- | -- | -- | -- | -- |
| Hg_t | -- | -- | -- | -- | -- |
| Mn_d | 0.46 | 0.59 | 0.51 | 0.27 | 0.086 |
| Mn_t | -- | -- | -- | -- | -- |
| Mn_? | -- | -- | -- | -- | -- |
| Mo_d | <0.01 | 0.01 | 0.007 | 0.004 | 0.002 |
| Mo_t | 0.008 | 0.01 | 0.008 | 0.004 | 0.003 |
| Mo_? | -- | -- | -- | -- | -- |
| Ni_d | -- | -- | -- | -- | -- |
| Ni_t | -- | -- | -- | -- | -- |
| P_ | 0.04 | -- | -- | -- | -- |
| Pb_d | -- | <0.001 | -- | -- | -- |
| Pb_t | -- | -- | -- | -- | -- |
| Se_d | -- | -- | -- | -- | -- |
| Se_t | -- | -- | -- | -- | -- |
| SiO2 final | 11 | -- | -- | -- | -- |
| Tl_d | -- | -- | -- | -- | -- |
| Tl_t | -- | -- | -- | -- | -- |
| V_d | -- | -- | -- | -- | -- |
| V_t | -- | -- | -- | -- | -- |
| Zn_d | 0.078 | 0.11 | 0.072 | 0.046 | 0.03 |
| Zn_t | 0.12 | 0.16 | 0.12 | 0.09 | 0.05 |
| Zn_? | -- | -- | -- | -- | -- |
| Total cations (meq/L) | -- | -- | -- | -- | -- |
| Total anions (meq/L) | -- | -- | -- | -- | -- |
| Charge Imbalance (%) | -- | -- | -- | -- | -- |
| Date (mm/dd/yy) | 07/06/82 | 08/20/82 | 09/16/82 | 10/19/82 | 12/07/82 |
| Time (24-hr) | 15:00 | 17:00 | 14:35 | 16:00 | 16:45 |
| Collected by | BLM | BLM | BLM | BLM | BLM |
| Source | USGS, 2003b | USGS, 2003b | USGS, 2003b | USGS, 2003b | USGS, 2003b |
| Measured Discharge (ft3/s) | 76 | 43 | 51 | 32 | 21 |
| Flow Comments | -- | -- | -- | -- | -- |
| Hydrologic Condition | Falling limb | Low flow | Storm | Low flow | Low flow |
| Avg Daily Discharge (ft3/s) | 77 | 45 | 52 | 35 | 19 |
| Avg Monthly Discharge (ft3/s) | -- | -- | -- | -- | -- |
| Max Avg Daily Discharge snowmelt runoff (ft3/s) | 142 | 142 | 142 | 142 | 142 |
| pH-field (SU) | 7.6 | 7.7 | 7.3 | 7.4 | 7.1 |
| pH-lab (SU) | -- | -- | -- | -- | -- |
| SC-field (µS/cm) | -- | -- | -- | -- | -- |
| SC-lab (µS/cm) | 200 | 285 | 235 | 265 | 295 |
| SC, 25°C (µS/cm) | -- | -- | -- | -- | -- |
| Temp, field (°C) | -- | -- | -- | -- | -- |
| TDS, meas (mg/L) | -- | -- | -- | -- | -- |
| TSS (mg/L) | 22 | 397 | 63 | 3 | 26 |
| DOC (mg/L) | 1.5 | 8.3 | 1.5 | -- | 1.2 |
| Turbidity, field (NTU) | -- | -- | -- | -- | -- |
| Turbidity, lab (NTU) | -- | -- | -- | -- | -- |
| Turbidity (JTU) | -- | -- | -- | -- | -- |
| Constituent (mg/L) | |||||
| Ca final | -- | -- | -- | -- | -- |
| Mg final | -- | -- | -- | -- | -- |
| Na final | -- | -- | -- | -- | -- |
| K final | -- | -- | -- | -- | -- |
| SO4 final | -- | -- | -- | -- | -- |
| Alk final (mg/L CaCO3) | 51 | 51 | 62 | 49 | 41 |
| F final | -- | -- | -- | -- | -- |
| Cl final | -- | -- | -- | -- | -- |
| Ag_d | -- | -- | -- | -- | -- |
| Ag_t | -- | -- | -- | -- | -- |
| Al_d | -- | -- | -- | -- | -- |
| Al_s | -- | -- | -- | -- | -- |
| Al_t | -- | -- | -- | -- | -- |
| As_d | -- | -- | -- | -- | -- |
| As_t | -- | -- | -- | -- | -- |
| Ba_d | -- | -- | -- | -- | -- |
| Ba_t | -- | -- | -- | -- | -- |
| Be_d | -- | -- | -- | -- | -- |
| Be_t | -- | -- | -- | -- | -- |
| Cd_d | -- | -- | -- | -- | -- |
| Cd_t | 0.23 | 0.42 | 0.32 | 0.48 | 0.75 |
| Cd_? | -- | -- | -- | -- | -- |
| Co_d | -- | -- | -- | -- | -- |
| Co_t | -- | -- | -- | -- | -- |
| Cr_d | -- | -- | -- | -- | -- |
| Cr_t | -- | -- | -- | -- | -- |
| Cr_? | -- | -- | -- | -- | -- |
| Cu_d | -- | -- | -- | -- | -- |
| Cu_t | 0.008 | 0.026 | 0.023 | 0.017 | 0.025 |
| Cu_? | -- | -- | -- | -- | -- |
| Fe_d | 0.02 | <0.003 | 0.02 | 0.03 | 0.04 |
| Fe_t | -- | -- | -- | -- | -- |
| Fe_? | -- | -- | -- | -- | -- |
| Hg_d | -- | -- | -- | -- | -- |
| Hg_t | -- | -- | -- | -- | -- |
| Mn_d | 0.005 | 0.27 | 0.26 | 0.39 | 0.53 |
| Mn_t | -- | -- | -- | -- | -- |
| Mn_? | -- | -- | -- | -- | -- |
| Mo_d | 0.002 | 0.045 | 0.003 | 0.005 | 0.004 |
| Mo_t | 0.004 | 0.017 | 0.004 | 0.005 | 0.002 |
| Mo_? | -- | -- | -- | -- | -- |
| Ni_d | -- | -- | -- | -- | -- |
| Ni_t | -- | -- | -- | -- | -- |
| P_ | -- | -- | -- | -- | -- |
| Pb_d | -- | -- | -- | -- | -- |
| Pb_t | -- | -- | -- | -- | -- |
| Se_d | -- | -- | -- | -- | -- |
| Se_t | -- | -- | -- | -- | -- |
| SiO2 final | -- | -- | -- | -- | -- |
| Tl_d | -- | -- | -- | -- | -- |
| Tl_t | -- | -- | -- | -- | -- |
| V_d | -- | -- | -- | -- | -- |
| V_t | -- | -- | -- | -- | -- |
| Zn_d | 0.036 | 0.005 | 0.059 | 0.063 | 0.11 |
| Zn_t | 0.06 | 0.07 | 0.07 | 0.11 | 0.16 |
| Zn_? | -- | -- | -- | -- | -- |
| Total cations (meq/L) | -- | -- | -- | -- | -- |
| Total anions (meq/L) | -- | -- | -- | -- | -- |
| Charge Imbalance (%) | -- | -- | -- | -- | -- |
| Date (mm/dd/yy) | 02/08/83 | 04/26/83 | 06/07/83 | 07/21/83 | 08/31/83 |
| Time (24-hr) | 16:30 | 15:00 | 15:15 | 13:40 | 13:00 |
| Collected by | BLM | BLM | BLM | BLM | BLM |
| Source | USGS, 2003b | USGS, 2003b | USGS, 2003b | USGS, 2003b | USGS, 2003b |
| Measured Discharge (ft3/s) | 22 | 81 | 247 | 123 | 47 |
| Flow Comments | -- | -- | -- | -- | -- |
| Hydrologic Condition | Low flow | Rising limb | Peak | Falling limb | Low flow |
| Avg Daily Discharge (ft3/s) | 17 | 83 | 265 | 116 | 46 |
| Avg Monthly Discharge (ft3/s) | -- | -- | -- | -- | -- |
| Max Avg Daily Discharge snowmelt runoff (ft3/s) | 142 | 332 | 332 | 332 | 332 |
| pH-field (SU) | 7.3 | 6.8 | 7.2 | 7.3 | 7.2 |
| pH-lab (SU) | -- | -- | -- | -- | -- |
| SC-field (µS/cm) | -- | -- | -- | -- | -- |
| SC-lab (µS/cm) | 310 | 240 | 145 | 200 | 290 |
| SC, 25°C (µS/cm) | -- | -- | -- | -- | -- |
| Temp, field (°C) | -- | -- | -- | -- | -- |
| TDS, meas (mg/L) | -- | -- | -- | -- | -- |
| TSS (mg/L) | 47 | 300 | 351 | 63 | 31 |
| DOC (mg/L) | 1.7 | 8.3 | 4.5 | 2.4 | 1 |
| Turbidity, field (NTU) | -- | -- | -- | -- | -- |
| Turbidity, lab (NTU) | -- | -- | -- | -- | -- |
| Turbidity (JTU) | -- | -- | -- | -- | -- |
| Constituent (mg/L) | |||||
| Ca final | -- | -- | -- | -- | -- |
| Mg final | -- | -- | -- | -- | -- |
| Na final | -- | -- | -- | -- | -- |
| K final | -- | -- | -- | -- | -- |
| SO4 final | -- | -- | -- | -- | -- |
| Alk final (mg/L CaCO3) | 44 | 28 | 39 | 48 | 61 |
| F final | -- | -- | -- | -- | -- |
| Cl final | -- | -- | -- | -- | -- |
| Ag_d | -- | -- | -- | -- | -- |
| Ag_t | -- | -- | -- | -- | -- |
| Al_d | -- | -- | -- | -- | -- |
| Al_s | -- | -- | -- | -- | -- |
| Al_t | -- | -- | -- | -- | -- |
| As_d | -- | -- | -- | -- | -- |
| As_t | -- | -- | -- | -- | -- |
| Ba_d | -- | -- | -- | -- | -- |
| Ba_t | -- | -- | -- | -- | -- |
| Be_d | -- | -- | -- | -- | -- |
| Be_t | -- | -- | -- | -- | -- |
| Cd_d | -- | -- | -- | -- | -- |
| Cd_t | 0.8 | 1.4 | 0.35 | 0.49 | 0.48 |
| Cd_? | -- | -- | -- | -- | -- |
| Co_d | -- | -- | -- | -- | -- |
| Co_t | -- | -- | -- | -- | -- |
| Cr_d | -- | -- | -- | -- | -- |
| Cr_t | -- | -- | -- | -- | -- |
| Cr_? | -- | -- | -- | -- | -- |
| Cu_d | -- | -- | -- | -- | -- |
| Cu_t | 0.035 | 0.085 | 0.019 | 0.023 | 0.022 |
| Cu_? | -- | -- | -- | -- | -- |
| Fe_d | 0.03 | -- | 0.05 | -- | -- |
| Fe_t | -- | -- | -- | -- | -- |
| Fe_? | -- | -- | -- | -- | -- |
| Hg_d | -- | -- | -- | -- | -- |
| Hg_t | -- | -- | -- | -- | -- |
| Mn_d | 0.52 | 1.2 | 0.13 | 0.25 | 0.43 |
| Mn_t | -- | -- | -- | -- | -- |
| Mn_? | -- | -- | -- | -- | -- |
| Mo_d | 0.004 | 0.002 | <0.001 | <0.001 | 0.004 |
| Mo_t | 0.005 | 0.005 | 0.006 | 0.005 | 0.004 |
| Mo_? | -- | -- | -- | -- | -- |
| Ni_d | -- | -- | -- | -- | -- |
| Ni_t | -- | -- | -- | -- | -- |
| P_ | -- | -- | -- | -- | -- |
| Pb_d | -- | -- | -- | -- | -- |
| Pb_t | -- | -- | -- | -- | -- |
| Se_d | -- | -- | -- | -- | -- |
| Se_t | -- | -- | -- | -- | -- |
| SiO2 final | -- | -- | -- | -- | -- |
| Tl_d | -- | -- | -- | -- | -- |
| Tl_t | -- | -- | -- | -- | -- |
| V_d | -- | -- | -- | -- | -- |
| V_t | -- | -- | -- | -- | -- |
| Zn_d | 0.091 | 0.19 | 0.028 | 0.04 | 0.053 |
| Zn_t | 0.17 | 0.42 | 0.07 | 0.12 | 0.16 |
| Zn_? | -- | -- | -- | -- | -- |
| Total cations (meq/L) | -- | -- | -- | -- | -- |
| Total anions (meq/L) | -- | -- | -- | -- | -- |
| Charge Imbalance (%) | -- | -- | -- | -- | -- |
| Date (mm/dd/yy) | 11/04/83 | 01/10/84 | 01/25/84 | 01/26/84 | 01/26/84 |
| Time (24-hr) | 11:15 | 14:30 | 17:00 | 9:15 | 12:40 |
| Collected by | BLM | BLM | Jacobi and Smolka | Jacobi and Smolka | Jacobi and Smolka |
| Source | USGS, 2003b | USGS, 2003b | Jacobi and Smolka, 1984 | Jacobi and Smolka, 1984 | Jacobi and Smolka, 1984 |
| Measured Discharge (ft3/s) | 14 | 9.1 | -- | -- | -- |
| Flow Comments | -- | -- | -- | -- | -- |
| Hydrologic Condition | Low flow | Low flow | Low flow | Low flow | Low flow |
| Avg Daily Discharge (ft3/s) | 17 | 7 | 11 | 11 | 11 |
| Avg Monthly Discharge (ft3/s) | -- | -- | -- | -- | -- |
| Max Avg Daily Discharge snowmelt runoff (ft3/s) | 332 | 332 | 332 | 332 | 332 |
| pH-field (SU) | 7.2 | 7.3 | 6.8 | 6.9 | 6.9 |
| pH-lab (SU) | -- | -- | -- | -- | -- |
| SC-field (µS/cm) | -- | -- | 266 | 188 | 173 |
| SC-lab (µS/cm) | 290 | 345 | -- | -- | -- |
| SC, 25°C (µS/cm) | -- | -- | -- | -- | -- |
| Temp, field (°C) | -- | -- | 0.2 | 0.2 | 0.0 |
| TDS, meas (mg/L) | -- | -- | -- | -- | -- |
| TSS (mg/L) | -- | 44 | -- | -- | -- |
| DOC (mg/L) | 1 | 0.7 | -- | -- | -- |
| Turbidity, field (NTU) | -- | -- | -- | -- | -- |
| Turbidity, lab (NTU) | -- | -- | -- | -- | -- |
| Turbidity (JTU) | -- | -- | 8 | 7 | 7 |
| Constituent (mg/L) | |||||
| Ca final | -- | -- | -- | -- | -- |
| Mg final | -- | -- | -- | -- | -- |
| Na final | -- | -- | -- | -- | -- |
| K final | -- | -- | -- | -- | -- |
| SO4 final | -- | -- | -- | -- | -- |
| Alk final (mg/L CaCO3) | 48 | 28 | -- | -- | -- |
| F final | -- | -- | -- | -- | -- |
| Cl final | -- | -- | -- | -- | -- |
| Ag_d | -- | -- | -- | -- | -- |
| Ag_t | -- | -- | -- | -- | -- |
| Al_d | -- | -- | -- | -- | -- |
| Al_s | -- | -- | -- | -- | -- |
| Al_t | -- | -- | -- | -- | -- |
| As_d | -- | -- | -- | -- | -- |
| As_t | -- | -- | -- | -- | -- |
| Ba_d | -- | -- | -- | -- | -- |
| Ba_t | -- | -- | -- | -- | -- |
| Be_d | -- | -- | -- | -- | -- |
| Be_t | -- | -- | -- | -- | -- |
| Cd_d | -- | -- | -- | -- | -- |
| Cd_t | 0.64 | 1.4 | -- | -- | -- |
| Cd_? | -- | -- | -- | -- | -- |
| Co_d | -- | -- | -- | -- | -- |
| Co_t | -- | -- | -- | -- | -- |
| Cr_d | -- | -- | -- | -- | -- |
| Cr_t | -- | -- | -- | -- | -- |
| Cr_? | -- | -- | -- | -- | -- |
| Cu_d | -- | -- | -- | -- | -- |
| Cu_t | 0.027 | 0.048 | -- | -- | -- |
| Cu_? | -- | -- | -- | -- | -- |
| Fe_d | 0.01 | 0.01 | -- | -- | -- |
| Fe_t | -- | -- | -- | -- | -- |
| Fe_? | -- | -- | -- | -- | -- |
| Hg_d | -- | -- | -- | -- | -- |
| Hg_t | -- | -- | -- | -- | -- |
| Mn_d | 0.62 | -- | -- | -- | -- |
| Mn_t | -- | -- | -- | -- | -- |
| Mn_? | -- | -- | -- | -- | -- |
| Mo_d | 0.006 | 0.009 | -- | -- | -- |
| Mo_t | 0.012 | 0.008 | -- | -- | -- |
| Mo_? | -- | -- | -- | -- | -- |
| Ni_d | -- | -- | -- | -- | -- |
| Ni_t | -- | -- | -- | -- | -- |
| P_ | -- | -- | -- | -- | -- |
| Pb_d | -- | -- | -- | -- | -- |
| Pb_t | -- | -- | -- | -- | -- |
| Se_d | -- | -- | -- | -- | -- |
| Se_t | -- | -- | -- | -- | -- |
| SiO2 final | -- | -- | -- | -- | -- |
| Tl_d | -- | -- | -- | -- | -- |
| Tl_t | -- | -- | -- | -- | -- |
| V_d | -- | -- | -- | -- | -- |
| V_t | -- | -- | -- | -- | -- |
| Zn_d | 0.09 | 0.23 | -- | -- | -- |
| Zn_t | 0.2 | 0.31 | -- | -- | -- |
| Zn_? | -- | -- | -- | -- | -- |
| Total cations (meq/L) | -- | -- | -- | -- | -- |
| Total anions (meq/L) | -- | -- | -- | -- | -- |
| Charge Imbalance (%) | -- | -- | -- | -- | -- |
| Date (mm/dd/yy) | 01/26/84 | 01/26/84 | 01/27/84 | 04/05/84 | 05/25/84 |
| Time (24-hr) | 16:30 | 21:45 | 11:00 | 10:00 | 14:45 |
| Collected by | Jacobi and Smolka | Jacobi and Smolka | Jacobi and Smolka | BLM | BLM |
| Source | Jacobi and Smolka, 1984 | Jacobi and Smolka, 1984 | Jacobi and Smolka, 1984 | USGS, 2003b | USGS, 2003b |
| Measured Discharge (ft3/s) | -- | -- | -- | 13 | 351 |
| Flow Comments | -- | -- | -- | -- | -- |
| Hydrologic Condition | Low flow | Low flow | Low flow | Low flow | Peak |
| Avg Daily Discharge (ft3/s) | 11 | 11 | 10 | 14 | 377 |
| Avg Monthly Discharge (ft3/s) | -- | -- | -- | -- | -- |
| Max Avg Daily Discharge snowmelt runoff (ft3/s) | 332 | 332 | 332 | 332 | 377 |
| pH-field (SU) | 6.9 | 6.9 | 6.9 | 7 | 7 |
| pH-lab (SU) | -- | -- | -- | -- | -- |
| SC-field (µS/cm) | 203 | 187 | 186 | -- | -- |
| SC-lab (µS/cm) | -- | -- | -- | 320 | 132 |
| SC, 25°C (µS/cm) | -- | -- | -- | -- | -- |
| Temp, field (°C) | 0.8 | 0.2 | 0.5 | -- | -- |
| TDS, meas (mg/L) | -- | -- | -- | -- | -- |
| TSS (mg/L) | -- | -- | -- | 67 | 1210 |
| DOC (mg/L) | -- | -- | -- | 0.8 | -- |
| Turbidity, field (NTU) | -- | -- | -- | -- | -- |
| Turbidity, lab (NTU) | -- | -- | -- | -- | -- |
| Turbidity (JTU) | 7.2 | 7 | 6.5 | -- | -- |
| Constituent (mg/L) | |||||
| Ca final | -- | -- | -- | -- | -- |
| Mg final | -- | -- | -- | -- | -- |
| Na final | -- | -- | -- | -- | -- |
| K final | -- | -- | -- | -- | -- |
| SO4 final | -- | -- | 131 | -- | -- |
| Alk final (mg/L CaCO3) | -- | -- | -- | 28 | 33 |
| F final | -- | -- | -- | -- | -- |
| Cl final | -- | -- | -- | -- | -- |
| Ag_d | -- | -- | -- | -- | -- |
| Ag_t | -- | -- | -- | -- | -- |
| Al_d | -- | -- | -- | -- | -- |
| Al_s | -- | -- | -- | -- | -- |
| Al_t | -- | -- | -- | -- | -- |
| As_d | -- | -- | -- | -- | -- |
| As_t | -- | -- | 0.005 | -- | -- |
| Ba_d | -- | -- | -- | -- | -- |
| Ba_t | -- | -- | 0.1 | -- | -- |
| Be_d | -- | -- | -- | -- | -- |
| Be_t | -- | -- | -- | -- | -- |
| Cd_d | -- | -- | -- | -- | -- |
| Cd_t | -- | -- | 0.001 | 2.2 | 0.62 |
| Cd_? | -- | -- | -- | -- | -- |
| Co_d | -- | -- | -- | -- | -- |
| Co_t | -- | -- | -- | -- | -- |
| Cr_d | -- | -- | -- | -- | -- |
| Cr_t | -- | -- | -- | -- | -- |
| Cr_? | -- | -- | -- | -- | -- |
| Cu_d | -- | -- | -- | -- | -- |
| Cu_t | -- | -- | -- | 0.049 | 0.08 |
| Cu_? | -- | -- | -- | -- | -- |
| Fe_d | -- | -- | -- | 0.06 | 0.04 |
| Fe_t | -- | -- | -- | -- | -- |
| Fe_? | -- | -- | -- | -- | -- |
| Hg_d | -- | -- | -- | -- | -- |
| Hg_t | -- | -- | 0.0050 | -- | -- |
| Mn_d | -- | -- | -- | 1.4 | 0.15 |
| Mn_t | -- | -- | -- | -- | -- |
| Mn_? | -- | -- | 1.25 | -- | -- |
| Mo_d | -- | -- | -- | 0.006 | 0.002 |
| Mo_t | -- | -- | 0.010 | 0.006 | 0.013 |
| Mo_? | -- | -- | -- | -- | -- |
| Ni_d | -- | -- | -- | -- | -- |
| Ni_t | -- | -- | -- | -- | -- |
| P_ | -- | -- | -- | -- | -- |
| Pb_d | -- | -- | -- | -- | -- |
| Pb_t | -- | -- | 0.005 | -- | -- |
| Se_d | -- | -- | -- | -- | -- |
| Se_t | -- | -- | 0.005 | -- | -- |
| SiO2 final | -- | -- | -- | -- | -- |
| Tl_d | -- | -- | -- | -- | -- |
| Tl_t | -- | -- | -- | -- | -- |
| V_d | -- | -- | -- | -- | -- |
| V_t | -- | -- | -- | -- | -- |
| Zn_d | -- | -- | -- | 0.25 | 0.041 |
| Zn_t | -- | -- | 0.280 | 0.33 | 0.17 |
| Zn_? | -- | -- | -- | -- | -- |
| Total cations (meq/L) | -- | -- | -- | -- | -- |
| Total anions (meq/L) | -- | -- | -- | -- | -- |
| Charge Imbalance (%) | -- | -- | -- | -- | -- |
| Date (mm/dd/yy) | 06/28/84 | 09/27/84 | 01/16/85 | 06/12/85 | 07/12/85 |
| Time (24-hr) | 15:00 | 13:30 | 10:00 | 10:00 | 14:00 |
| Collected by | BLM | BLM | BLM | BLM | BLM |
| Source | USGS, 2003b | USGS, 2003b | USGS, 2003b | USGS, 2003b | USGS, 2003b |
| Measured Discharge (ft3/s) | 95 | 18 | 8.8 | 332 | 93 |
| Flow Comments | -- | -- | -- | -- | -- |
| Hydrologic Condition | Falling limb | Low flow | Low flow | Peak | Falling limb |
| Avg Daily Discharge (ft3/s) | 92 | 22 | 13 | 320 | 104 |
| Avg Monthly Discharge (ft3/s) | -- | -- | -- | -- | -- |
| Max Avg Daily Discharge snowmelt runoff (ft3/s) | 377 | 377 | 377 | 322 | 322 |
| pH-field (SU) | 7.1 | 7 | 6.9 | 7.4 | 8.2 |
| pH-lab (SU) | -- | -- | -- | -- | -- |
| SC-field (µS/cm) | -- | -- | -- | -- | -- |
| SC-lab (µS/cm) | 180 | 310 | 350 | 155 | 225 |
| SC, 25°C (µS/cm) | -- | -- | -- | -- | -- |
| Temp, field (°C) | -- | -- | -- | -- | -- |
| TDS, meas (mg/L) | -- | -- | -- | -- | -- |
| TSS (mg/L) | 19 | 28 | -- | 215 | 19 |
| DOC (mg/L) | 1 | 0.7 | 1 | 4.3 | 1.3 |
| Turbidity, field (NTU) | -- | -- | -- | -- | -- |
| Turbidity, lab (NTU) | -- | -- | -- | -- | -- |
| Turbidity (JTU) | -- | -- | -- | -- | -- |
| Constituent (mg/L) | |||||
| Ca final | -- | -- | -- | -- | -- |
| Mg final | -- | -- | -- | -- | -- |
| Na final | -- | -- | -- | -- | -- |
| K final | -- | -- | -- | -- | -- |
| SO4 final | -- | -- | -- | -- | -- |
| Alk final (mg/L CaCO3) | 48 | 39 | -- | -- | 30 |
| F final | -- | -- | -- | -- | -- |
| Cl final | -- | -- | -- | -- | -- |
| Ag_d | -- | -- | -- | -- | -- |
| Ag_t | -- | -- | -- | -- | -- |
| Al_d | -- | -- | -- | -- | -- |
| Al_s | -- | -- | -- | -- | -- |
| Al_t | -- | -- | -- | -- | -- |
| As_d | -- | -- | -- | -- | -- |
| As_t | -- | -- | -- | -- | -- |
| Ba_d | -- | -- | -- | -- | -- |
| Ba_t | -- | -- | -- | -- | -- |
| Be_d | -- | -- | -- | -- | -- |
| Be_t | -- | -- | -- | -- | -- |
| Date (mm/dd/yy) | 06/28/84 | 09/27/84 | 01/16/85 | 06/12/85 | 07/12/85 |
| Cd_d | -- | -- | -- | -- | -- |
| Cd_t | 0.37 | 0.92 | 1.8 | 0.49 | 0.67 |
| Cd_? | -- | -- | -- | -- | -- |
| Co_d | -- | -- | -- | -- | -- |
| Co_t | -- | -- | -- | -- | -- |
| Cr_d | -- | -- | -- | -- | -- |
| Cr_t | -- | -- | -- | -- | -- |
| Cr_? | -- | -- | -- | -- | -- |
| Cu_d | -- | -- | -- | -- | -- |
| Cu_t | 0.016 | 0.031 | 0.044 | 0.027 | 0.016 |
| Cu_? | -- | -- | -- | -- | -- |
| Fe_d | 0.01 | 0.02 | 0.2 | 0.04 | 0.01 |
| Fe_t | -- | -- | -- | -- | -- |
| Fe_? | -- | -- | -- | -- | -- |
| Hg_d | -- | -- | -- | -- | -- |
| Hg_t | -- | -- | -- | -- | -- |
| Mn_d | 0.27 | 0.84 | 1.7 | 0.28 | 0.001 |
| Mn_t | -- | -- | -- | -- | -- |
| Mn_? | -- | -- | -- | -- | -- |
| Mo_d | 0.004 | 0.004 | 0.004 | 0.002 | 0.002 |
| Mo_t | 0.005 | 0.005 | 0.004 | 0.001 | 0.002 |
| Mo_? | -- | -- | -- | -- | -- |
| Ni_d | -- | -- | -- | -- | -- |
| Ni_t | -- | -- | -- | -- | -- |
| P_ | -- | -- | -- | -- | -- |
| Pb_d | -- | -- | -- | -- | -- |
| Pb_t | -- | -- | -- | -- | -- |
| Se_d | -- | -- | -- | -- | -- |
| Se_t | -- | -- | -- | -- | -- |
| SiO2 final | -- | -- | -- | -- | -- |
| Tl_d | -- | -- | -- | -- | -- |
| Tl_t | -- | -- | -- | -- | -- |
| V_d | -- | -- | -- | -- | -- |
| V_t | -- | -- | -- | -- | -- |
| Zn_d | 0.047 | 0.1 | 0.34 | 0.046 | 0.011 |
| Zn_t | 0.09 | 0.2 | 0.37 | 0.19 | 0.12 |
| Zn_? | -- | -- | -- | -- | -- |
| Total cations (meq/L) | -- | -- | -- | -- | -- |
| Total anions (meq/L) | -- | -- | -- | -- | -- |
| Charge Imbalance (%) | -- | -- | -- | -- | -- |
| Date (mm/dd/yy) | 07/20/85 | 10/29/85 | 12/20/85 | 02/27/86 | 05/22/86 |
| Time (24-hr) | 19:05 | 14:00 | 16:00 | 14:15 | 14:30 |
| Collected by | BLM | BLM | BLM | Smolka and Tague | BLM |
| Source | USGS, 2003b | USGS, 2003b | USGS, 2003b | Smolka and Tague, 1987 | USGS, 2003b |
| Measured Discharge (ft3/s) | 108 | 33 | 12 | -- | 114 |
| Flow Comments | -- | -- | -- | -- | -- |
| Hydrologic Condition | Falling limb | Low flow | Low flow | Low flow | Rising limb |
| Avg Daily Discharge (ft3/s) | 102 | 32 | 10 | 17 | 135 |
| Avg Monthly Discharge (ft3/s) | -- | -- | -- | -- | -- |
| Max Avg Daily Discharge snowmelt runoff (ft3/s) | 322 | 322 | 322 | 332 | 325 |
| pH-field (SU) | 4.7 | -- | -- | 7.2 | -- |
| pH-lab (SU) | 4.6 | -- | -- | -- | 8 |
| SC-field (µS/cm) | -- | -- | -- | 308 | -- |
| SC-lab (µS/cm) | 420 | -- | 345 | -- | 170 |
| SC, 25°C (µS/cm) | 355 | -- | -- | -- | 189 |
| Temp, field (°C) | -- | -- | -- | 8.0 | -- |
| TDS, meas (mg/L) | -- | -- | -- | 210 | -- |
| TSS (mg/L) | -- | 3 | -- | -- | -- |
| DOC (mg/L) | -- | -- | -- | -- | 3.1 |
| Turbidity, field (NTU) | 130 | -- | -- | -- | -- |
| Turbidity, lab (NTU) | -- | -- | -- | -- | -- |
| Turbidity (JTU) | -- | -- | -- | -- | -- |
| Constituent (mg/L) | |||||
| Ca final | -- | -- | -- | 40.8 | -- |
| Mg final | -- | -- | -- | 26.8 | -- |
| Na final | -- | -- | -- | 4.6 | -- |
| K final | -- | -- | -- | 0.8 | -- |
| SO4 final | -- | -- | -- | 123 | -- |
| Alk final (mg/L CaCO3) | -- | -- | -- | 50 | -- |
| F final | -- | -- | -- | -- | -- |
| Cl final | -- | -- | -- | -- | -- |
| Ag_d | -- | -- | -- | -- | -- |
| Ag_t | -- | -- | -- | -- | -- |
| Al_d | -- | -- | -- | -- | -- |
| Al_s | -- | -- | -- | -- | -- |
| Al_t | -- | -- | -- | 3.4 | -- |
| As_d | -- | -- | -- | -- | -- |
| As_t | -- | -- | -- | 0.005 | -- |
| Ba_d | -- | -- | -- | -- | -- |
| Ba_t | -- | -- | -- | 0.04 | -- |
| Be_d | -- | -- | -- | -- | -- |
| Be_t | -- | -- | -- | -- | -- |
| Cd_d | -- | -- | -- | -- | -- |
| Cd_t | -- | -- | -- | 0.001 | 0.27 |
| Cd_? | -- | -- | -- | -- | -- |
| Co_d | -- | -- | -- | -- | -- |
| Co_t | -- | -- | -- | -- | -- |
| Cr_d | -- | -- | -- | -- | -- |
| Cr_t | -- | -- | -- | 0.005 | -- |
| Cr_? | -- | -- | -- | -- | -- |
| Cu_d | -- | -- | -- | -- | -- |
| Cu_t | 0.32 | -- | 0.052 | 0.05 | 0.006 |
| Cu_? | -- | -- | -- | -- | -- |
| Fe_d | 0.03 | -- | 0.12 | -- | 0.02 |
| Fe_t | -- | -- | -- | 0.44 | -- |
| Fe_? | -- | -- | -- | -- | -- |
| Hg_d | -- | -- | -- | -- | -- |
| Hg_t | -- | -- | -- | 0.0005 | -- |
| Mn_d | 0.86 | -- | 1.6 | -- | 0.25 |
| Mn_t | -- | -- | -- | 1 | -- |
| Mn_? | -- | -- | -- | -- | -- |
| Mo_d | <0.001 | -- | 0.004 | -- | 0.002 |
| Mo_t | 0.1 | -- | 0.004 | 0.010 | 0.001 |
| Mo_? | -- | -- | -- | -- | -- |
| Ni_d | -- | -- | -- | -- | -- |
| Ni_t | -- | -- | -- | 0.05 | -- |
| P_ | -- | -- | -- | -- | -- |
| Pb_d | -- | -- | -- | -- | -- |
| Pb_t | -- | -- | -- | 0.010 | -- |
| Se_d | -- | -- | -- | -- | -- |
| Se_t | -- | -- | -- | 0.005 | -- |
| SiO2 final | -- | -- | -- | -- | -- |
| Tl_d | -- | -- | -- | -- | -- |
| Tl_t | -- | -- | -- | -- | -- |
| V_d | -- | -- | -- | -- | -- |
| V_t | -- | -- | -- | -- | -- |
| Zn_d | 0.26 | -- | 0.29 | -- | 0.037 |
| Zn_t | 0.67 | -- | 0.34 | 0.22 | 0.06 |
| Zn_? | -- | -- | -- | -- | -- |
| Total cations (meq/L) | -- | -- | -- | -- | -- |
| Total anions (meq/L) | -- | -- | -- | -- | -- |
| Charge Imbalance (%) | -- | -- | -- | -- | -- |
| Date (mm/dd/yy) | 06/12/86 | 08/18/86 | 08/19/86 | 08/19/86 | 08/20/86 |
| Time (24-hr) | 16:30 | 16:30 | 10:55 | 15:45 | 11:20 |
| Collected by | BLM | Smolka and Tague | Smolka and Tague | Smolka and Tague | Smolka and Tague |
| Source | USGS, 2003b, 1985 | Smolka and Tague, 1987 | Smolka and Tague, 1987 | Smolka and Tague, 1987 | Smolka and Tague, 1987 |
| Measured Discharge (ft3/s) | 240 | -- | -- | -- | -- |
| Flow Comments | -- | storm | -- | -- | -- |
| Hydrologic Condition | Peak | Low flow | Low flow | Low flow | Low flow |
| Avg Daily Discharge (ft3/s) | 252 | 42 | 40 | 40 | 38 |
| Avg Monthly Discharge (ft3/s) | -- | -- | -- | -- | -- |
| Max Avg Daily Discharge snowmelt runoff (ft3/s) | 325 | 325 | 325 | 325 | 325 |
| pH-field (SU) | 7.8 | 7.3 | 7.3 | 7.3 | 7.2 |
| pH-lab (SU) | 8.1 | -- | -- | -- | -- |
| SC-field (µS/cm) | -- | 306 | 298 | 305 | 298 |
| SC-lab (µS/cm) | 160 | -- | -- | -- | -- |
| SC, 25°C (µS/cm) | 170 | -- | -- | -- | -- |
| Temp, field (°C) | -- | 16.2 | 13.0 | 15.9 | 13.5 |
| TDS, meas (mg/L) | -- | 240 | 234 | 294 | 300 |
| TSS (mg/L) | -- | -- | -- | -- | -- |
| DOC (mg/L) | 4.5 | -- | -- | -- | -- |
| Turbidity, field (NTU) | 24 | -- | -- | -- | -- |
| Turbidity, lab (NTU) | -- | -- | -- | -- | -- |
| Turbidity (JTU) | -- | 9.3 | 12 | 8 | 9.4 |
| Constituent (mg/L) | |||||
| Ca final | -- | 46.4 | 40 | -- | 48 |
| Mg final | -- | 18.1 | 16.4 | -- | 11.7 |
| Na final | -- | 10 | 10 | -- | 10 |
| K final | -- | 5 | 5 | -- | 5 |
| SO4 final | -- | 105 | 115 | 160 | 118 |
| Alk final (mg/L CaCO3) | -- | 40 | 40 | -- | 40 |
| F final | -- | -- | -- | -- | -- |
| Cl final | -- | -- | -- | -- | -- |
| Ag_d | -- | -- | -- | -- | -- |
| Ag_t | -- | -- | -- | -- | -- |
| Al_d | -- | -- | -- | -- | -- |
| Al_s | -- | -- | -- | -- | -- |
| Al_t | -- | 3.34 | 3.26 | -- | 3.41 |
| As_d | -- | -- | -- | -- | -- |
| As_t | -- | 0.005 | 0.005 | -- | 0.005 |
| Ba_d | -- | -- | -- | -- | -- |
| Ba_t | -- | 0.1 | 0.1 | -- | 0.1 |
| Be_d | -- | -- | -- | -- | -- |
| Be_t | -- | -- | -- | -- | -- |
| Cd_d | -- | -- | -- | -- | -- |
| Cd_t | 0.29 | 0.001 | 0.001 | -- | 0.001 |
| Cd_? | -- | -- | -- | -- | -- |
| Co_d | -- | -- | -- | -- | -- |
| Co_t | -- | -- | -- | -- | -- |
| Cr_d | -- | -- | -- | -- | -- |
| Cr_t | -- | 0.005 | 0.005 | -- | 0.005 |
| Cr_? | -- | -- | -- | -- | -- |
| Cu_d | -- | -- | -- | -- | -- |
| Cu_t | 0.021 | 0.05 | 0.05 | -- | 0.05 |
| Cu_? | -- | -- | -- | -- | -- |
| Fe_d | 0.29 | -- | -- | -- | -- |
| Fe_t | -- | 1.1 | 4.03 | -- | 0.85 |
| Fe_? | -- | -- | -- | -- | -- |
| Hg_d | -- | -- | -- | -- | -- |
| Hg_t | -- | 0.0005 | 0.0005 | -- | 0.0005 |
| Mn_d | 0.24 | -- | -- | -- | -- |
| Mn_t | -- | 0.89 | 0.95 | -- | 1.04 |
| Mn_? | -- | -- | -- | -- | -- |
| Mo_d | 0.006 | -- | -- | -- | -- |
| Mo_t | 0.003 | 0.010 | 0.010 | -- | 0.010 |
| Mo_? | -- | -- | -- | -- | -- |
| Ni_d | -- | -- | -- | -- | -- |
| Ni_t | -- | 0.05 | 0.05 | -- | 0.05 |
| P_ | -- | -- | -- | -- | -- |
| Pb_d | -- | -- | -- | -- | -- |
| Pb_t | -- | 0.010 | 0.010 | -- | 0.010 |
| Se_d | -- | -- | -- | -- | -- |
| Se_t | -- | 0.005 | 0.005 | -- | 0.005 |
| SiO2 final | -- | -- | -- | -- | -- |
| Tl_d | -- | -- | -- | -- | -- |
| Tl_t | -- | -- | -- | -- | -- |
| V_d | -- | -- | -- | -- | -- |
| V_t | -- | -- | -- | -- | -- |
| Zn_d | 0.07 | -- | -- | -- | -- |
| Zn_t | 0.08 | 0.19 | 0.02 | -- | 0.22 |
| Zn_? | -- | -- | -- | -- | -- |
| Total cations (meq/L) | -- | -- | 3 | -- | 3.1 |
| Total anions (meq/L) | -- | -- | 2.8 | -- | 2.8 |
| Charge Imbalance (%) | -- | -- | 10.2 | -- | 8.4 |
| Date (mm/dd/yy) | 08/20/86 | 08/26/86 | 09/07/86 | 12/24/86 | 03/25/88 |
| Time (24-hr) | 15:35 | 15:30 | 22:00 | 13:00 | 15:00 |
| Collected by | Smolka and Tague | BLM | BLM | BLM | Smolka and Tague |
| Source | Smolka and Tague, 1987 | USGS, 2003b, 1985 | USGS, 2003b, 1985 | USGS, 2003b, 1985 | Smolka and Tague, 1989 |
| Measured Discharge (ft3/s) | -- | 44 | 1100 | 25 | -- |
| Flow Comments | -- | -- | -- | -- | -- |
| Hydrologic Condition | Low flow | Storm | Storm | Low flow | Low flow |
| Avg Daily Discharge (ft3/s) | 38 | 48 | 39 | 27 | 21 |
| Avg Monthly Discharge (ft3/s) | -- | -- | -- | -- | -- |
| Max Avg Daily Discharge snowmelt runoff (ft3/s) | 325 | 325 | 325 | 325 | 277 |
| pH-field (SU) | 7.3 | 7.4 | 3.8 | 7.3 | 6.8 |
| pH-lab (SU) | -- | -- | 3.9 | 6.8 | -- |
| SC-field (µS/cm) | 302 | -- | -- | -- | 381 |
| SC-lab (µS/cm) | -- | 280 | 1100 | 345 | -- |
| SC, 25°C (µS/cm) | -- | -- | 1160 | 390 | -- |
| Temp, field (°C) | 15.0 | -- | -- | -- | 9.0 |
| TDS, meas (mg/L) | 236 | -- | -- | -- | 290 |
| TSS (mg/L) | -- | -- | -- | -- | 21.0 |
| DOC (mg/L) | -- | 2.4 | -- | 1.8 | -- |
| Turbidity, field (NTU) | -- | -- | -- | 10 | -- |
| Turbidity, lab (NTU) | -- | -- | -- | -- | 10 |
| Turbidity (JTU) | 7.5 | -- | -- | -- | -- |
| Constituent (mg/L) | |||||
| Ca final | -- | -- | -- | -- | -- |
| Mg final | -- | -- | -- | -- | -- |
| Na final | -- | -- | -- | -- | -- |
| K final | -- | -- | -- | -- | -- |
| SO4 final | -- | -- | -- | -- | -- |
| Alk final (mg/L CaCO3) | -- | -- | -- | -- | -- |
| F final | -- | -- | -- | -- | -- |
| Cl final | -- | -- | -- | -- | -- |
| Ag_d | -- | -- | -- | -- | -- |
| Ag_t | -- | -- | -- | -- | -- |
| Al_d | -- | -- | 23 | -- | -- |
| Al_s | -- | -- | -- | -- | -- |
| Al_t | -- | -- | 220 | -- | 4.60 |
| As_d | -- | -- | <0.001 | -- | 0.005 |
| As_t | -- | -- | -- | -- | 0.005 |
| Ba_d | -- | -- | 0.024 | -- | -- |
| Ba_t | -- | -- | 0.7 | -- | 0.1 |
| Be_d | -- | -- | -- | -- | -- |
| Be_t | -- | -- | -- | -- | -- |
| Cd_d | -- | -- | 0.006 | -- | -- |
| Cd_t | -- | 1.4 | <1 | 1.1 | 0.001 |
| Cd_? | -- | -- | -- | -- | -- |
| Co_d | -- | -- | -- | -- | -- |
| Co_t | -- | -- | -- | -- | -- |
| Cr_d | -- | -- | <0.01 | -- | -- |
| Cr_t | -- | -- | 0.45 | -- | 0.005 |
| Cr_? | -- | -- | -- | -- | -- |
| Cu_d | -- | -- | 0.51 | -- | -- |
| Cu_t | -- | 0.056 | 2.1 | 0.031 | 0.06 |
| Cu_? | -- | -- | -- | -- | -- |
| Fe_d | -- | 0.02 | 0.13 | 0.08 | -- |
| Fe_t | -- | -- | 940 | -- | 0.34 |
| Fe_? | -- | -- | -- | -- | -- |
| Hg_d | -- | -- | -- | -- | -- |
| Hg_t | -- | -- | -- | -- | 0.0005 |
| Mn_d | -- | 1.4 | 12 | 0.99 | -- |
| Mn_t | -- | -- | 18 | -- | 1.2 |
| Mn_? | -- | -- | -- | -- | -- |
| Mo_d | -- | 0.005 | 0.001 | 0.008 | -- |
| Mo_t | -- | 0.004 | 0.036 | 0.008 | 0.010 |
| Mo_? | -- | -- | -- | -- | -- |
| Ni_d | -- | -- | 0.2 | -- | -- |
| Ni_t | -- | -- | 0.034 | -- | -- |
| P_ | -- | -- | -- | -- | -- |
| Pb_d | -- | -- | <0.01 | -- | -- |
| Pb_t | -- | -- | 3.3 | -- | 0.010 |
| Se_d | -- | -- | -- | -- | -- |
| Se_t | -- | -- | -- | -- | 0.005 |
| SiO2 final | -- | -- | -- | -- | -- |
| Tl_d | -- | -- | -- | -- | -- |
| Tl_t | -- | -- | -- | -- | -- |
| V_d | -- | -- | -- | -- | -- |
| V_t | -- | -- | -- | -- | -- |
| Zn_d | -- | 0.18 | 2.6 | 0.19 | -- |
| Zn_t | 0.21 | 0.29 | 4.4 | 0.21 | 0.26 |
| Zn_? | -- | -- | -- | -- | -- |
| Total cations (meq/L) | -- | -- | -- | -- | -- |
| Total anions (meq/L) | -- | -- | -- | -- | -- |
| Charge Imbalance (%) | -- | -- | -- | -- | -- |
| Date (mm/dd/yy) | 07/26/88 | 09/13/88 | 09/20/88 | 09/21/88 | 09/26/88 |
| Time (24-hr) | -- | 11:00 | 12:15 | -- | 9:40 |
| Collected by | Molycorp | Smolka and Tague | Smolka and Tague | USEPA | Smolka and Tague |
| Source | Vail Engineering, Inc., 1989 | Smolka and Tague, 1989 | Smolka and Tague, 1989 | USEPA, 1988 | Smolka and Tague, 1989 |
| Measured Discharge (ft3/s) | -- | -- | -- | -- | -- |
| Flow Comments | -- | storm | -- | -- | -- |
| Hydrologic Condition | Storm | Storm | Storm | Storm | Storm |
| Avg Daily Discharge (ft3/s) | 37 | 138 | 57 | 58 | 47 |
| Avg Monthly Discharge (ft3/s) | -- | -- | -- | -- | -- |
| Max Avg Daily Discharge snowmelt runoff (ft3/s) | 101 | 101 | 101 | 101 | 101 |
| pH-field (SU) | -- | 6.8 | 7.6 | 7.9 | 7.2 |
| pH-lab (SU) | -- | -- | -- | -- | -- |
| SC-field (µS/cm) | -- | 230 | 210 | -- | 271 |
| SC-lab (µS/cm) | -- | -- | -- | -- | -- |
| SC, 25°C (µS/cm) | -- | -- | -- | -- | -- |
| Temp, field (°C) | -- | 9.2 | 8.2 | -- | 6.5 |
| TDS, meas (mg/L) | 1,112 | 927 | 184 | -- | 200 |
| TSS (mg/L) | 47800 | 210 | 17.0 | -- | 15.0 |
| DOC (mg/L) | -- | -- | -- | -- | -- |
| Turbidity, field (NTU) | -- | -- | -- | -- | -- |
| Turbidity, lab (NTU) | -- | 410 | 8 | -- | 9 |
| Turbidity (JTU) | -- | -- | -- | -- | -- |
| Constituent (mg/L) | |||||
| Ca final | -- | -- | -- | -- | -- |
| Mg final | -- | 20.1 | 18.9 | -- | 15.9 |
| Na final | -- | 4 | 4 | -- | 2 |
| K final | -- | 2 | 1 | -- | 1 |
| SO4 final | 278 | 120 | 85 | -- | 96 |
| Alk final (mg/L CaCO3) | -- | -- | -- | 48 | -- |
| F final | -- | -- | -- | 0.7 | -- |
| Cl final | -- | -- | -- | -- | -- |
| Ag_d | -- | 0.001 | 0.001 | 0.001 | 0.001 |
| Ag_t | -- | 0.002 | 0.001 | -- | 0.001 |
| Al_d | 3 | 0.07 | 0.05 | -- | 0.10 |
| Al_s | 1,453 | 16.9 | 1.95 | -- | 2.00 |
| Al_t | 1,456 | 17.0 | 2.00 | -- | 2.10 |
| As_d | -- | 0.005 | 0.005 | -- | 0.005 |
| As_t | -- | 0.012 | 0.005 | -- | 0.005 |
| Ba_d | -- | 0.1 | 0.1 | -- | 0.1 |
| Ba_t | -- | 0.5 | 0.1 | -- | 0.1 |
| Be_d | -- | -- | -- | -- | -- |
| Be_t | -- | -- | -- | -- | -- |
| Cd_d | -- | 0.001 | 0.001 | -- | 0.001 |
| Cd_t | -- | 0.002 | 0.001 | -- | 0.001 |
| Cd_? | -- | -- | -- | -- | -- |
| Co_d | -- | -- | -- | -- | -- |
| Co_t | -- | -- | -- | -- | -- |
| Cr_d | -- | 0.005 | 0.013 | -- | 0.005 |
| Cr_t | -- | 0.032 | 0.005 | -- | 0.005 |
| Cr_? | -- | -- | -- | -- | -- |
| Cu_d | -- | 0.05 | 0.05 | -- | 0.05 |
| Cu_t | -- | 0.13 | 0.05 | -- | 0.05 |
| Cu_? | -- | -- | -- | -- | -- |
| Fe_d | -- | 0.05 | 0.05 | -- | 0.05 |
| Fe_t | -- | 45 | 0.59 | -- | 0.44 |
| Fe_? | -- | -- | -- | -- | -- |
| Hg_d | -- | 0.0005 | 0.0005 | -- | 0.0005 |
| Hg_t | -- | 0.0005 | 0.0005 | -- | 0.0005 |
| Mn_d | -- | 0.8 | 0.61 | -- | 0.66 |
| Mn_t | -- | 1.3 | 0.6 | -- | 0.64 |
| Mn_? | -- | -- | -- | -- | -- |
| Mo_d | -- | 0.01 | 0.01 | -- | 0.01 |
| Mo_t | -- | 0.033 | 0.010 | -- | 0.010 |
| Mo_? | -- | -- | -- | -- | -- |
| Ni_d | -- | 0.05 | 0.05 | -- | 0.05 |
| Ni_t | -- | 0.05 | 0.05 | -- | 0.05 |
| P_ | -- | -- | -- | -- | -- |
| Pb_d | -- | 0.01 | 0.01 | -- | 0.01 |
| Pb_t | -- | 0.120 | 0.005 | -- | 0.010 |
| Se_d | -- | 0.005 | 0.005 | -- | 0.005 |
| Se_t | -- | 0.005 | 0.005 | -- | 0.005 |
| SiO2 final | -- | -- | -- | -- | -- |
| Tl_d | -- | -- | -- | -- | -- |
| Tl_t | -- | -- | -- | -- | -- |
| V_d | -- | -- | -- | -- | -- |
| V_t | -- | -- | -- | -- | -- |
| Zn_d | -- | 0.07 | 0.12 | -- | 0.10 |
| Zn_t | -- | 0.30 | 0.10 | -- | 0.12 |
| Zn_? | -- | -- | -- | -- | -- |
| Total cations (meq/L) | -- | 1.8 | 1.7 | -- | -- |
| Total anions (meq/L) | -- | 2.3 | 1.7 | -- | -- |
| Charge Imbalance (%) | -- | -28.6 | 0.7 | -- | -- |
| Date (mm/dd/yy) | 10/12/88 | 10/25/88 | 11/29/88 | 11/29/88 | 02/26/92 |
| Time (24-hr) | 9:00 | 16:15 | -- | -- | 13:00 |
| Collected by | ENSR | Smolka and Tague | Vail Engineering, Inc. | Vail Engineering, Inc. | Smolka |
| Source | ENSR, 1988 | Smolka and Tague, 1989 | Vail Engineering, Inc., 1989 | Vail Engineering, Inc., 1993 | NMDGF, 1993 |
| Measured Discharge (ft3/s) | -- | -- | 17 | 17 | -- |
| Flow Comments | -- | -- | -- | -- | -- |
| Hydrologic Condition | Low flow | Low flow | Low flow | Low flow | Low flow |
| Avg Daily Discharge (ft3/s) | 41 | 31 | 13 | 13 | 23 |
| Avg Monthly Discharge (ft3/s) | -- | -- | -- | -- | -- |
| Max Avg Daily Discharge snowmelt runoff (ft3/s) | 152 | 152 | 101 | 101 | 469 |
| pH-field (SU) | -- | 7.3 | 7.1 | 7.1 | 7.4 |
| pH-lab (SU) | 7.5 | -- | -- | -- | -- |
| SC-field (µS/cm) | -- | 311 | -- | -- | 272 |
| SC-lab (µS/cm) | -- | -- | -- | -- | -- |
| SC, 25°C (µS/cm) | -- | -- | -- | -- | -- |
| Temp, field (°C) | -- | 8.3 | -- | -- | 3.1 |
| TDS, meas (mg/L) | 256 | 230 | 263 | 263 | 283 |
| TSS (mg/L) | 17.0 | 17.0 | 50 | 49.6 | 25 |
| DOC (mg/L) | -- | -- | -- | -- | -- |
| Turbidity, field (NTU) | -- | -- | -- | -- | 11.5 |
| Turbidity, lab (NTU) | -- | 1 | -- | -- | -- |
| Turbidity (JTU) | -- | -- | 22 | 22 | -- |
| Constituent (mg/L) | |||||
| Ca final | -- | -- | -- | -- | 49 |
| Mg final | -- | 4.6 | -- | -- | 12.0 |
| Na final | -- | 5 | -- | -- | 6 |
| K final | -- | 1 | -- | -- | 2 |
| SO4 final | -- | 118 | 137 | 137 | 166 |
| Alk final (mg/L CaCO3) | 58 | -- | 26 | 26 | 30.6 |
| F final | -- | -- | 1.2 | 1.2 | -- |
| Cl final | 20 | -- | -- | -- | -- |
| Ag_d | -- | -- | -- | -- | <0.1 |
| Ag_t | -- | 0.001 | -- | -- | -- |
| Al_d | <0.5 | -- | -- | 4.4 | <0.1 |
| Al_s | 1.80 | -- | -- | 7.1 | -- |
| Al_t | -- | 1.31 | -- | 11.5 | 5.20 |
| As_d | -- | 0.005 | -- | -- | <0.005 |
| As_t | -- | 0.005 | -- | -- | -- |
| Ba_d | <0.5 | -- | -- | -- | <0.1 |
| Ba_t | -- | 0.05 | -- | -- | -- |
| Be_d | -- | -- | -- | -- | <0.1 |
| Be_t | -- | -- | -- | -- | -- |
| Cd_d | 0.005 | -- | -- | -- | <0.001 |
| Cd_t | -- | 0.001 | -- | -- | -- |
| Cd_? | -- | -- | -- | -- | -- |
| Co_d | -- | -- | -- | -- | <0.05 |
| Co_t | -- | -- | -- | -- | -- |
| Cr_d | -- | -- | -- | -- | <0.005 |
| Cr_t | -- | 0.005 | -- | -- | -- |
| Cr_? | -- | -- | -- | -- | -- |
| Cu_d | 0.02 | -- | -- | -- | <0.1 |
| Cu_t | -- | 0.05 | -- | -- | -- |
| Cu_? | -- | -- | -- | -- | -- |
| Fe_d | 0.04 | -- | -- | -- | <0.1 |
| Fe_t | -- | 0.44 | -- | -- | -- |
| Fe_? | -- | -- | -- | 2.17 | -- |
| Hg_d | -- | -- | -- | -- | -- |
| Hg_t | -- | 0.0005 | -- | -- | <0.0005 |
| Mn_d | 0.72 | -- | -- | -- | 1.6 |
| Mn_t | -- | 0.78 | -- | -- | -- |
| Mn_? | -- | -- | -- | 1.39 | -- |
| Mo_d | 0.72 | -- | -- | -- | <0.1 |
| Mo_t | -- | 0.010 | -- | -- | -- |
| Mo_? | -- | -- | -- | -- | -- |
| Ni_d | -- | -- | -- | -- | <0.1 |
| Ni_t | -- | -- | -- | -- | -- |
| P_ | -- | -- | -- | -- | -- |
| Pb_d | <0.05 | -- | -- | -- | <0.005 |
| Pb_t | -- | 0.005 | -- | -- | -- |
| Se_d | -- | -- | -- | -- | <0.005 |
| Se_t | -- | 0.005 | -- | -- | -- |
| SiO2 final | -- | -- | -- | -- | -- |
| Tl_d | -- | -- | -- | -- | -- |
| Tl_t | -- | -- | -- | -- | -- |
| V_d | -- | -- | -- | -- | <0.1 |
| V_t | -- | -- | -- | -- | -- |
| Zn_d | 0.12 | -- | -- | -- | 0.30 |
| Zn_t | -- | 0.13 | -- | -- | -- |
| Zn_? | -- | -- | -- | 0.37 | -- |
| Total cations (meq/L) | -- | -- | -- | -- | -- |
| Total anions (meq/L) | -- | -- | -- | -- | -- |
| Charge Imbalance (%) | -- | -- | -- | -- | -- |
| Date (mm/dd/yy) | 03/25/92 | 04/29/92 | 05/27/92 | 06/30/92 | 07/25/92 |
| Time (24-hr) | 12:20 | 12:00 | 12:35 | 12:25 | -- |
| Collected by | Smolka | Smolka | Smolka | Smolka | Molycorp |
| Source | NMDGF, 1993 | NMDGF, 1993 | NMDGF, 1993 | NMDGF, 1993 | Vail Engineering, Inc., 1993 |
| Measured Discharge (ft3/s) | -- | -- | -- | -- | -- |
| Flow Comments | -- | -- | -- | -- | -- |
| Hydrologic Condition | Rising limb | Rising limb | Peak | Falling limb | Falling limb |
| Avg Daily Discharge (ft3/s) | 27 | 135 | 160 | 103 | 61 |
| Avg Monthly Discharge (ft3/s) | -- | -- | -- | -- | -- |
| Max Avg Daily Discharge snowmelt runoff (ft3/s) | 184 | 184 | 184 | 184 | 184 |
| pH-field (SU) | 6.5 | 7.1 | 7.4 | 6.6 | 7.5 |
| pH-lab (SU) | -- | -- | -- | -- | -- |
| SC-field (µS/cm) | 322 | 176 | 186 | 218 | -- |
| SC-lab (µS/cm) | -- | -- | -- | -- | -- |
| SC, 25°C (µS/cm) | -- | -- | -- | -- | -- |
| Temp, field (°C) | 7.6 | 9.0 | 8.5 | 11.9 | -- |
| TDS, meas (mg/L) | 322 | 142 | 148 | 160 | 236 |
| TSS (mg/L) | 49 | 158 | 20 | 12 | 450 |
| DOC (mg/L) | -- | -- | -- | -- | -- |
| Turbidity, field (NTU) | 22.0 | 78.0 | 19.0 | 6.0 | -- |
| Turbidity, lab (NTU) | -- | -- | -- | -- | -- |
| Turbidity (JTU) | -- | -- | -- | -- | -- |
| Constituent (mg/L) | |||||
| Ca final | 57 | 34 | 37 | 33 | -- |
| Mg final | 16.0 | 6.0 | 5.0 | 7.0 | -- |
| Na final | 6 | 3 | 5 | 4 | -- |
| K final | 1 | 1 | 1 | 1 | -- |
| SO4 final | 175 | 58.2 | 49.2 | 67.7 | 59 |
| Alk final (mg/L CaCO3) | 18.4 | 29.6 | 43.4 | 45.4 | -- |
| F final | -- | -- | -- | -- | 0.8 |
| Cl final | -- | <5 | <5 | <5 | -- |
| Ag_d | <0.1 | <0.1 | -- | -- | -- |
| Ag_t | -- | -- | -- | -- | -- |
| Al_d | <0.1 | <0.1 | -- | -- | -- |
| Al_s | -- | -- | -- | -- | -- |
| Al_t | 9.00 | -- | -- | -- | 12.8 |
| As_d | <0.005 | <0.005 | -- | -- | -- |
| As_t | -- | -- | -- | -- | -- |
| Ba_d | <0.1 | <0.1 | -- | -- | -- |
| Ba_t | -- | -- | -- | -- | -- |
| Be_d | <0.1 | <0.1 | -- | -- | -- |
| Be_t | -- | -- | -- | -- | -- |
| Cd_d | 0.003 | <0.001 | -- | -- | -- |
| Cd_t | -- | -- | -- | -- | <0.01 |
| Cd_? | -- | -- | -- | -- | -- |
| Co_d | <0.05 | <0.05 | -- | -- | -- |
| Co_t | -- | -- | -- | -- | -- |
| Cr_d | <0.005 | <0.005 | -- | -- | -- |
| Cr_t | -- | -- | -- | -- | -- |
| Cr_? | -- | -- | -- | -- | -- |
| Cu_d | <0.1 | <0.01 | -- | -- | -- |
| Cu_t | -- | -- | -- | -- | 0.114 |
| Cu_? | -- | -- | -- | -- | -- |
| Fe_d | 0.200 | <0.1 | -- | -- | -- |
| Fe_t | -- | -- | -- | -- | 27.9 |
| Fe_? | -- | -- | -- | -- | -- |
| Hg_d | -- | -- | -- | -- | -- |
| Hg_t | <0.0005 | <0.0005 | -- | -- | -- |
| Mn_d | 3 | 0.760 | -- | -- | -- |
| Mn_t | -- | -- | -- | -- | 1.2 |
| Mn_? | -- | -- | -- | -- | -- |
| Mo_d | <0.1 | <0.01 | -- | -- | -- |
| Mo_t | -- | -- | -- | -- | 0.5 |
| Mo_? | -- | -- | -- | -- | -- |
| Ni_d | <0.1 | <0.1 | -- | -- | -- |
| Ni_t | -- | -- | -- | -- | -- |
| P_ | -- | -- | -- | -- | -- |
| Pb_d | <0.005 | <0.005 | -- | -- | -- |
| Pb_t | -- | -- | -- | -- | 0.12 |
| Se_d | <0.005 | <0.005 | -- | -- | -- |
| Se_t | -- | -- | -- | -- | -- |
| SiO2 final | -- | -- | -- | -- | -- |
| Tl_d | -- | -- | -- | -- | -- |
| Tl_t | -- | -- | -- | -- | -- |
| V_d | <0.1 | <0.1 | -- | -- | -- |
| V_t | -- | -- | -- | -- | -- |
| Zn_d | 0.60 | <0.1 | -- | -- | -- |
| Zn_t | -- | -- | -- | -- | 0.281 |
| Zn_? | -- | -- | -- | -- | -- |
| Total cations (meq/L) | -- | -- | -- | -- | -- |
| Total anions (meq/L) | -- | -- | -- | -- | -- |
| Charge Imbalance (%) | -- | -- | -- | -- | -- |
| Date (mm/dd/yy) | 07/29/92 | 08/26/92 | 09/30/92 | 10/22/92 | 10/28/92 |
| Time (24-hr) | 12:30 | 12:05 | 10:40 | -- | 9:20 |
| Collected by | Smolka | Smolka | Smolka | Vail Engineering, Inc. | Smolka |
| Source | NMDGF, 1993 | NMDGF, 1993 | NMDGF, 1993 | Vail Engineering, Inc., 1993 | NMDGF, 1993 |
| Measured Discharge (ft3/s) | -- | -- | -- | 25.0 | -- |
| Flow Comments | -- | -- | -- | -- | -- |
| Hydrologic Condition | Falling limb | Storm | Low flow | Low flow | Low flow |
| Avg Daily Discharge (ft3/s) | 56 | 53 | 30 | 25 | 25 |
| Avg Monthly Discharge (ft3/s) | -- | -- | -- | -- | -- |
| Max Avg Daily Discharge snowmelt runoff (ft3/s) | 184 | 184 | 184 | 184 | 184 |
| pH-field (SU) | 7.7 | 7.8 | 7.1 | 7.39 | 7.1 |
| pH-lab (SU) | -- | -- | -- | -- | -- |
| SC-field (µS/cm) | 298 | 268 | 371 | 427 | 355 |
| SC-lab (µS/cm) | -- | -- | -- | -- | -- |
| SC, 25°C (µS/cm) | -- | -- | -- | -- | -- |
| Temp, field (°C) | 12.5 | 13.5 | 7.2 | -- | 5.3 |
| TDS, meas (mg/L) | 196 | 186 | 256 | 331 | 280 |
| TSS (mg/L) | 4 | < 3 | 13 | 32 | 18 |
| DOC (mg/L) | -- | -- | -- | -- | -- |
| Turbidity, field (NTU) | 5.0 | 11.6 | 6.8 | -- | 7.6 |
| Turbidity, lab (NTU) | -- | -- | -- | -- | -- |
| Turbidity (JTU) | -- | -- | -- | 9 | -- |
| Constituent (mg/L) | |||||
| Ca final | 49 | 46 | 49 | -- | 56 |
| Mg final | 9.0 | 9.0 | 11.0 | -- | 13.0 |
| Na final | 5 | 4 | 6 | -- | 6 |
| K final | 1 | 1 | 2 | -- | 2 |
| SO4 final | 98.8 | 94.5 | 142 | 152 | 162 |
| Alk final (mg/L CaCO3) | 48.6 | 49.8 | 42.5 | 44 | 34.9 |
| F final | -- | -- | -- | 0.948 | -- |
| Cl final | <5 | 5 | <5 | -- | 5.5 |
| Ag_d | -- | -- | -- | -- | -- |
| Ag_t | -- | -- | -- | -- | -- |
| Al_d | -- | -- | -- | 0.79 | -- |
| Al_s | -- | -- | -- | 3.36 | -- |
| Al_t | -- | -- | -- | 4.15 | -- |
| As_d | -- | -- | -- | -- | -- |
| As_t | -- | -- | -- | -- | -- |
| Ba_d | -- | -- | -- | -- | -- |
| Ba_t | -- | -- | -- | -- | -- |
| Be_d | -- | -- | -- | -- | -- |
| Be_t | -- | -- | -- | -- | -- |
| Cd_d | -- | -- | -- | -- | -- |
| Cd_t | -- | -- | -- | -- | -- |
| Cd_? | -- | -- | -- | -- | -- |
| Co_d | -- | -- | -- | -- | -- |
| Co_t | -- | -- | -- | -- | -- |
| Cr_d | -- | -- | -- | -- | -- |
| Cr_t | -- | -- | -- | -- | -- |
| Cr_? | -- | -- | -- | -- | -- |
| Cu_d | -- | -- | -- | -- | -- |
| Cu_t | -- | -- | -- | -- | -- |
| Cu_? | -- | -- | -- | -- | -- |
| Fe_d | -- | -- | -- | -- | -- |
| Fe_t | -- | -- | -- | -- | -- |
| Fe_? | -- | -- | -- | 0.2 | -- |
| Hg_d | -- | -- | -- | -- | -- |
| Hg_t | -- | -- | -- | -- | -- |
| Mn_d | -- | -- | -- | -- | -- |
| Mn_t | -- | -- | -- | -- | -- |
| Mn_? | -- | -- | -- | 1.13 | -- |
| Mo_d | -- | -- | -- | -- | -- |
| Mo_t | -- | -- | -- | -- | -- |
| Mo_? | -- | -- | -- | -- | -- |
| Ni_d | -- | -- | -- | -- | -- |
| Ni_t | -- | -- | -- | -- | -- |
| P_ | -- | -- | -- | -- | -- |
| Pb_d | -- | -- | -- | -- | -- |
| Pb_t | -- | -- | -- | -- | -- |
| Se_d | -- | -- | -- | -- | -- |
| Se_t | -- | -- | -- | -- | -- |
| SiO2 final | -- | -- | -- | -- | -- |
| Tl_d | -- | -- | -- | -- | -- |
| Tl_t | -- | -- | -- | -- | -- |
| V_d | -- | -- | -- | -- | -- |
| V_t | -- | -- | -- | -- | -- |
| Zn_d | -- | -- | -- | -- | -- |
| Zn_t | -- | -- | -- | -- | -- |
| Zn_? | -- | -- | -- | -- | -- |
| Total cations (meq/L) | -- | -- | -- | -- | -- |
| Total anions (meq/L) | -- | -- | -- | -- | -- |
| Charge Imbalance (%) | -- | -- | -- | -- | -- |
| Date (mm/dd/yy) | 11/24/92 | 12/16/92 | 02/16/93 | 11/10/93 | 02/11/94 |
| Time (24-hr) | 12:15 | 11:55 | -- | -- | -- |
| Collected by | Smolka | Smolka | Molycorp | Vail Engineering, Inc. | Molycorp |
| Source | NMDGF, 1993 | NMDGF, 1993 | Vail Engineering, Inc., 1993 | Vail Engineering, Inc., 2002 | Vail Engineering, Inc., 2002 |
| Measured Discharge (ft3/s) | -- | -- | 22.0 | 25.0 | 16.8 |
| Flow Comments | -- | -- | -- | -- | -- |
| Hydrologic Condition | Low flow | Low flow | Low flow | Low flow | Low flow |
| Avg Daily Discharge (ft3/s) | 16 | 12 | 21 | 26 | 23 |
| Avg Monthly Discharge (ft3/s) | -- | -- | -- | -- | -- |
| Max Avg Daily Discharge snowmelt runoff (ft3/s) | 184 | 184 | 184 | 184 | 184 |
| pH-field (SU) | 6.8 | 7.0 | 7.2 | 7.27 | 6.9 |
| pH-lab (SU) | -- | -- | -- | -- | -- |
| SC-field (µS/cm) | 348 | 358 | 458 | 425 | 450 |
| SC-lab (µS/cm) | -- | -- | -- | -- | -- |
| SC, 25°C (µS/cm) | -- | -- | -- | -- | -- |
| Temp, field (°C) | 0.5 | 0.3 | -- | -- | -- |
| TDS, meas (mg/L) | 333 | 340 | 338 | 262 | 352 |
| TSS (mg/L) | 33 | 24 | 21.0 | 16.0 | 13.0 |
| DOC (mg/L) | -- | -- | -- | -- | -- |
| Turbidity, field (NTU) | 13.2 | 11.2 | -- | -- | -- |
| Turbidity, lab (NTU) | -- | -- | -- | -- | -- |
| Turbidity (JTU) | -- | -- | -- | -- | -- |
| Constituent (mg/L) | |||||
| Ca final | 61 | 61 | -- | -- | -- |
| Mg final | 15.0 | 14.0 | -- | -- | -- |
| Na final | 7 | 7 | -- | -- | -- |
| K final | 2 | 2 | -- | -- | -- |
| SO4 final | 205 | 206 | 202 | 129 | 171 |
| Alk final (mg/L CaCO3) | 21.5 | 24 | 29 | 43 | 25 |
| F final | -- | -- | 1.1 | 1.18 | 1.6 |
| Cl final | 6.5 | 5.4 | -- | -- | -- |
| Ag_d | -- | -- | -- | -- | -- |
| Ag_t | -- | -- | -- | -- | -- |
| Al_d | -- | -- | 0.50 | 2.80 | 0.50 |
| Al_s | -- | -- | 5.10 | 3.30 | 7.60 |
| Al_t | -- | -- | 5.60 | 6.10 | 8.10 |
| As_d | -- | -- | -- | -- | -- |
| As_t | -- | -- | -- | -- | -- |
| Ba_d | -- | -- | -- | -- | -- |
| Ba_t | -- | -- | -- | -- | -- |
| Be_d | -- | -- | -- | -- | -- |
| Be_t | -- | -- | -- | -- | -- |
| Cd_d | -- | -- | -- | -- | -- |
| Cd_t | -- | -- | -- | -- | -- |
| Cd_? | -- | -- | -- | -- | -- |
| Co_d | -- | -- | -- | -- | -- |
| Co_t | -- | -- | -- | -- | -- |
| Cr_d | -- | -- | -- | -- | -- |
| Cr_t | -- | -- | -- | -- | -- |
| Cr_? | -- | -- | -- | -- | -- |
| Cu_d | -- | -- | -- | -- | -- |
| Cu_t | -- | -- | -- | -- | -- |
| Cu_? | -- | -- | -- | -- | -- |
| Fe_d | -- | -- | -- | -- | -- |
| Fe_t | -- | -- | -- | -- | -- |
| Fe_? | -- | -- | 0.524 | 0.301 | 0.36 |
| Hg_d | -- | -- | -- | -- | -- |
| Hg_t | -- | -- | -- | -- | -- |
| Mn_d | -- | -- | -- | -- | -- |
| Mn_t | -- | -- | 1.5 | -- | -- |
| Mn_? | -- | -- | -- | 0.932 | 1.68 |
| Mo_d | -- | -- | -- | -- | -- |
| Mo_t | -- | -- | -- | -- | -- |
| Mo_? | -- | -- | -- | -- | -- |
| Ni_d | -- | -- | -- | -- | -- |
| Ni_t | -- | -- | -- | -- | -- |
| P_ | -- | -- | -- | -- | -- |
| Pb_d | -- | -- | -- | -- | -- |
| Pb_t | -- | -- | -- | -- | -- |
| Se_d | -- | -- | -- | -- | -- |
| Se_t | -- | -- | -- | -- | -- |
| SiO2 final | -- | -- | -- | -- | -- |
| Tl_d | -- | -- | -- | -- | -- |
| Tl_t | -- | -- | -- | -- | -- |
| V_d | -- | -- | -- | -- | -- |
| V_t | -- | -- | -- | -- | -- |
| Zn_d | -- | -- | -- | -- | -- |
| Zn_t | -- | -- | -- | -- | -- |
| Zn_? | -- | -- | 0.348 | 0.225 | 0.355 |
| Total cations (meq/L) | -- | -- | -- | -- | -- |
| Total anions (meq/L) | -- | -- | -- | -- | -- |
| Charge Imbalance (%) | -- | -- | -- | -- | -- |
| Date (mm/dd/yy) | 05/15/94 | 06/26/94 | 06/26/94 | 06/27/94 | 10/13/94 |
| Time (24-hr) | -- | -- | -- | -- | am |
| Collected by | SPRI | Woodward-Clyde Consultants | NMED | -- | SPRI |
| Source | SPRI, 1995 | Woodward-Clyde Consultants, 1994 | Kent, 1995 | Molycorp, Inc., written commun., 2002 | SPRI, 1995 |
| Measured Discharge (ft3/s) | -- | -- | -- | -- | -- |
| Flow Comments | -- | -- | -- | -- | -- |
| Hydrologic Condition | Peak | Falling limb | Falling limb | Falling limb | Low flow |
| Avg Daily Discharge (ft3/s) | -- | 155 | 155 | 144 | 27 |
| Avg Monthly Discharge (ft3/s) | 244 | -- | -- | -- | -- |
| Max Avg Daily Discharge snowmelt runoff (ft3/s) | 399 | 399 | 399 | 399 | 359 |
| pH-field (SU) | -- | 7.2 | -- | -- | -- |
| pH-lab (SU) | -- | -- | -- | -- | -- |
| SC-field (µS/cm) | 171 | 228 | -- | -- | -- |
| SC-lab (µS/cm) | -- | -- | -- | -- | -- |
| SC, 25°C (µS/cm) | -- | -- | -- | -- | -- |
| Temp, field (°C) | 11.1 | 13.7 | -- | -- | -- |
| TDS, meas (mg/L) | 150 | -- | 156 | -- | 278 |
| TSS (mg/L) | 106 | -- | 14.0 | -- | 8.0 |
| DOC (mg/L) | -- | -- | -- | -- | -- |
| Turbidity, field (NTU) | -- | -- | -- | -- | -- |
| Turbidity, lab (NTU) | -- | -- | -- | -- | -- |
| Turbidity (JTU) | -- | -- | -- | -- | -- |
| Constituent (mg/L) | |||||
| Ca final | 22.1 | -- | 29 J | 29 | -- |
| Mg final | 4.5 | -- | 5.89 | 5.84 | 0.946 |
| Na final | 2.7 | -- | -- | 3.24 | -- |
| K final | <1 | -- | -- | 0.719 | -- |
| SO4 final | 28.9 | -- | 53.7 | -- | 196 |
| Alk final (mg/L CaCO3) | 41 | -- | 45.4 | 54 | 49 |
| F final | 0.35 | -- | -- | -- | 1.2 |
| Cl final | 6.5 | -- | -- | -- | -- |
| Ag_d | -- | -- | -- | <0.0024 | -- |
| Ag_t | -- | -- | -- | <0.0024 | -- |
| Al_d | <0.5 | -- | -- | 0.284 | <0.5 |
| Al_s | 0.83 | -- | -- | -- | 2.9 |
| Al_t | -- | -- | 1.36 | 1.05 | 3.4 |
| As_d | -- | -- | -- | <0.0033 | -- |
| As_t | -- | -- | -- | <0.0033 | -- |
| Ba_d | -- | -- | 0.027J | 0.029 | -- |
| Ba_t | -- | -- | 0.04 J | 0.0313 | -- |
| Be_d | -- | -- | -- | <0.0003 | -- |
| Be_t | -- | -- | -- | 0.00049 | -- |
| Cd_d | -- | -- | -- | <0.0017 | -- |
| Cd_t | <0.005 | -- | -- | <0.0017 | <0.01 |
| Cd_? | -- | -- | -- | -- | -- |
| Co_d | -- | -- | 0.005 J | <0.0035 | -- |
| Co_t | -- | -- | 0.006 J | 0.0044 | -- |
| Cr_d | -- | -- | -- | <0.0023 | -- |
| Cr_t | -- | -- | -- | 0.0028 | -- |
| Cr_? | -- | -- | -- | -- | -- |
| Cu_d | -- | -- | -- | <0.0021 | -- |
| Cu_t | 0.024 | -- | -- | 0.0108 | 0.03 |
| Cu_? | -- | -- | -- | -- | -- |
| Fe_d | -- | -- | -- | <0.045 | -- |
| Fe_t | 2.72 | -- | -- | 0.233 | 0.342 |
| Fe_? | -- | -- | -- | -- | -- |
| Hg_d | -- | -- | -- | <0.0001 | -- |
| Hg_t | -- | -- | 0.00022 | <0.0001 | -- |
| Mn_d | -- | -- | 0.369 | 0.378 | -- |
| Mn_t | 0.29 | -- | 0.407 | 0.408 | 0.946 |
| Mn_? | -- | -- | -- | -- | -- |
| Mo_d | -- | -- | -- | <0.02 | -- |
| Mo_t | <0.02 | -- | -- | <0.02 | <0.1 |
| Mo_? | -- | -- | -- | -- | -- |
| Ni_d | -- | -- | -- | 0.0076 | -- |
| Ni_t | -- | -- | -- | 0.0165 | -- |
| P_ | -- | -- | -- | <0.05 | -- |
| Pb_d | -- | -- | -- | <0.0019 | -- |
| Pb_t | 0.014 | -- | 0.002 J | <0.0019 | <0.1 |
| Se_d | -- | -- | -- | <0.01 | -- |
| Se_t | -- | -- | -- | <0.0022 | -- |
| SiO2 final | 14 | -- | -- | -- | -- |
| Tl_d | -- | -- | -- | <0.0019 | -- |
| Tl_t | -- | -- | -- | <0.0019 | -- |
| V_d | -- | -- | -- | <0.0023 | -- |
| V_t | -- | -- | -- | <0.0023 | <0.0039 |
| Zn_d | -- | -- | 0.06 | 0.0583 | -- |
| Zn_t | 0.073 | -- | 0.095 | 0.104 | 0.23 |
| Zn_? | -- | -- | -- | -- | -- |
| Total cations (meq/L) | -- | -- | -- | -- | -- |
| Total anions (meq/L) | -- | -- | -- | -- | -- |
| Charge Imbalance (%) | -- | -- | -- | -- | -- |
| Date (mm/dd/yy) | 10/13/94 | 02/14/95 | 11/09/95 | 11/09/95 | 11/09/95 |
| Time (24-hr) | pm | -- | -- | -- | -- |
| Collected by | SPRI | Vail Engineering, Inc. | Vail Engineering, Inc. | -- | -- |
| Source | SPRI, 1995 | Vail Engineering, Inc., written commun., 2002 | Vail Engineering, Inc., written commun., 2002 | Molycorp, Inc., written commun., 2002 | Woodward-Clyde Consultants, 1996a |
| Measured Discharge (ft3/s) | -- | 21.5 | 27.0 | -- | -- |
| Flow Comments | -- | -- | -- | -- | -- |
| Hydrologic Condition | Low flow | Low flow | Low flow | Low flow | Low flow |
| Avg Daily Discharge (ft3/s) | 27 | 21 | 28 | 28 | 28 |
| Avg Monthly Discharge (ft3/s) | -- | -- | -- | -- | -- |
| Max Avg Daily Discharge snowmelt runoff (ft3/s) | 359 | 399 | 359 | 359 | 359 |
| pH-field (SU) | 7.8 | 7.6 | 7.7 | -- | 7.7 |
| pH-lab (SU) | -- | -- | 7.6 | 7.6 | 7.6 |
| SC-field (µS/cm) | 400 | 438 | 388 | -- | 389 |
| SC-lab (µS/cm) | -- | -- | 367 | 367 | 367 |
| SC, 25°C (µS/cm) | -- | -- | -- | -- | -- |
| Temp, field (°C) | -- | -- | -- | -- | 5.7 |
| TDS, meas (mg/L) | 268 | 286 | 310 | 263 | 263 |
| TSS (mg/L) | 9.3 | 22 | 10.0 | 9.2 | 9.2 |
| DOC (mg/L) | -- | -- | -- | -- | -- |
| Turbidity, field (NTU) | -- | -- | -- | -- | -- |
| Turbidity, lab (NTU) | -- | -- | -- | -- | 5.24 |
| Turbidity (JTU) | -- | -- | -- | -- | -- |
| Constituent (mg/L) | |||||
| Ca final | -- | -- | -- | 47.7 | 47.7 |
| Mg final | 0.92 | -- | 19.2 | 11.6 | 11.6 |
| Na final | -- | -- | -- | 5.59 | 5.59 J |
| K final | -- | -- | -- | <1.24 | <1.24 |
| SO4 final | 197 | 144 | 136 | 133 | 133 |
| Alk final (mg/L CaCO3) | 44 | 39 | 47 | 47.8 | 47.8 |
| F final | 1.1 | 1.0 | 1.2 | 1.1 | 1.1 |
| Cl final | -- | -- | -- | <3 | <3 |
| Ag_d | -- | -- | -- | <0.0055 | <0.005 |
| Ag_t | -- | -- | -- | <0.0055 | <0.005 |
| Al_d | <0.5 | 0.05 | 0.11 | 0.113 | 0.113 J |
| Al_s | 2.9 | 2.70 | 3.80 | -- | -- |
| Al_t | 3.4 | 2.75 | 3.91 | 2.23 | 2.23 |
| As_d | -- | -- | -- | <0.001 | <0.001 |
| As_t | -- | -- | -- | <0.001 | <0.001 |
| Ba_d | -- | -- | -- | 0.0332 | 0.033 J |
| Ba_t | -- | -- | -- | 0.0331 | 0.033 J |
| Be_d | -- | -- | -- | <0.0005 | <0.0005 |
| Be_t | -- | -- | -- | <0.0005 | 0.0005 |
| Cd_d | -- | -- | -- | 0.0011 | 0.001 |
| Cd_t | <0.01 | -- | -- | <0.0031 | <0.003 |
| Cd_? | -- | -- | -- | -- | -- |
| Co_d | -- | -- | -- | 0.0059 | 0.0059 J |
| Co_t | -- | -- | -- | 0.0055 | 0.005 |
| Cr_d | -- | -- | -- | <0.0046 | <0.0046 |
| Cr_t | -- | -- | -- | <0.0046 | <0.0046 |
| Cr_? | -- | -- | -- | -- | -- |
| Cu_d | -- | -- | -- | <0.0042 | <0.0042 |
| Cu_t | 0.03 | -- | -- | 0.0247 | 0.0247 J |
| Cu_? | -- | -- | -- | -- | -- |
| Fe_d | -- | -- | -- | <0.0181 | <0.0181 |
| Fe_t | 0.432 | -- | -- | 0.184 | 0.184 |
| Fe_? | -- | 0.408 | 0.339 | -- | -- |
| Hg_d | -- | -- | -- | -- | <0.0002 |
| Hg_t | -- | -- | -- | <0.0002 | <0.0002 |
| Mn_d | -- | -- | -- | 0.815 | 0.815 |
| Mn_t | 0.902 | 0.828 | 0.87 | 0.759 | 0.759 |
| Mn_? | -- | -- | -- | -- | -- |
| Mo_d | -- | -- | -- | <0.0078 | <0.0078 |
| Mo_t | <0.1 | -- | -- | <0.0078 | <0.0078 |
| Mo_? | -- | -- | -- | -- | -- |
| Ni_d | -- | -- | -- | 0.0299 | 0.0299 J |
| Ni_t | -- | -- | -- | 0.0236 | 0.0236 J |
| P_ | -- | -- | -- | -- | -- |
| Pb_d | -- | -- | -- | -- | <0.001 J |
| Pb_t | <0.1 | -- | -- | <0.001 | <0.001 J |
| Se_d | -- | -- | -- | <0.002 | <0.002 J |
| Se_t | -- | -- | -- | <0.002 | <0.002 J |
| SiO2 final | -- | -- | -- | -- | -- |
| Tl_d | -- | -- | -- | <0.001 | <0.001 |
| Tl_t | -- | -- | -- | <0.0012 | <0.0012 |
| V_d | -- | -- | -- | <0.0039 | <0.0039 |
| V_t | <0.0039 | -- | -- | <0.0039 | <0.0039 |
| Zn_d | -- | -- | -- | 0.126 | 0.126 |
| Zn_t | 0.228 | -- | 0.280 | 0.191 | 0.191 |
| Zn_? | -- | 0.265 | -- | -- | -- |
| Total cations (meq/L) | -- | -- | -- | 3.6 | -- |
| Total anions (meq/L) | -- | -- | -- | 3.8 | -- |
| Charge Imbalance (%) | -- | -- | -- | -1.85 | -- |
| Date (mm/dd/yy) | 02/26/96 | 11/05/96 | 03/13/97 | 06/10/97 | 07/17/97 |
| Time (24-hr) | -- | -- | -- | -- | -- |
| Collected by | Vail Engineering, Inc. | Vail Engineering, Inc. | Vail Engineering, Inc. | NM ONRT | NM ONRT |
| Source | Vail Engineering, Inc., written commun., 2002 | Vail Engineering, Inc., written commun., 2002 | Vail Engineering, Inc., written commun., 2002 | Allen and others, 1999 | Allen and others, 1999 |
| Measured Discharge (ft3/s) | 22.5 | 16.2 | 16.9 | 283 | 53 |
| Flow Comments | -- | -- | -- | -- | -- |
| Hydrologic Condition | Low flow | Low flow | Rising limb | Falling limb | Low flow |
| Avg Daily Discharge (ft3/s) | 22 | 17 | 14 | 283 | 53 |
| Avg Monthly Discharge (ft3/s) | -- | -- | -- | -- | -- |
| Max Avg Daily Discharge snowmelt runoff (ft3/s) | 359 | 55 | 347 | 347 | 347 |
| pH-field (SU) | 7.4 | 6.9 | 6.8 | -- | -- |
| pH-lab (SU) | -- | 7.39 | 7.47 | -- | -- |
| SC-field (µS/cm) | 448 | 478 | 420 | -- | -- |
| SC-lab (µS/cm) | -- | 454 | 415 | -- | -- |
| SC, 25°C (µS/cm) | -- | -- | -- | -- | -- |
| Temp, field (°C) | -- | -- | -- | -- | -- |
| TDS, meas (mg/L) | -- | -- | -- | -- | -- |
| TSS (mg/L) | -- | -- | -- | -- | -- |
| DOC (mg/L) | -- | -- | -- | -- | -- |
| Turbidity, field (NTU) | -- | -- | -- | -- | -- |
| Turbidity, lab (NTU) | -- | -- | -- | -- | -- |
| Turbidity (JTU) | -- | -- | 9 | -- | -- |
| Constituent (mg/L) | |||||
| Ca final | -- | -- | -- | -- | -- |
| Mg final | 12.7 | 15.2 | 12.1 | -- | -- |
| Na final | -- | -- | -- | -- | -- |
| K final | -- | -- | -- | -- | -- |
| SO4 final | 163 | 185 | 148 | -- | -- |
| Alk final (mg/L CaCO3) | -- | -- | -- | -- | -- |
| F final | 1.42 | -- | -- | -- | -- |
| Cl final | -- | -- | -- | -- | -- |
| Ag_d | -- | -- | -- | -- | -- |
| Ag_t | -- | -- | -- | -- | -- |
| Al_d | -- | -- | -- | -- | -- |
| Al_s | -- | -- | -- | -- | -- |
| Al_t | 3.4 | 3.40 | 3.00 | -- | -- |
| As_d | -- | -- | -- | -- | -- |
| As_t | -- | -- | -- | -- | -- |
| Ba_d | -- | -- | -- | -- | -- |
| Ba_t | -- | -- | -- | -- | -- |
| Be_d | -- | -- | -- | -- | -- |
| Be_t | -- | -- | -- | -- | -- |
| Cd_d | -- | -- | -- | -- | -- |
| Cd_t | -- | -- | -- | -- | -- |
| Cd_? | -- | -- | -- | -- | -- |
| Co_d | -- | -- | -- | -- | -- |
| Co_t | -- | -- | -- | -- | -- |
| Cr_d | -- | -- | -- | -- | -- |
| Cr_t | -- | -- | -- | -- | -- |
| Cr_? | -- | -- | -- | -- | -- |
| Cu_d | -- | -- | -- | -- | -- |
| Cu_t | -- | -- | -- | -- | -- |
| Cu_? | -- | -- | -- | -- | -- |
| Fe_d | -- | -- | -- | -- | -- |
| Fe_t | -- | -- | -- | -- | -- |
| Fe_? | -- | -- | -- | -- | -- |
| Hg_d | -- | -- | -- | -- | -- |
| Hg_t | -- | -- | -- | -- | -- |
| Mn_d | -- | -- | -- | -- | -- |
| Mn_t | 0.546 | 1.1 | 0.66 | -- | -- |
| Mn_? | -- | -- | -- | -- | -- |
| Mo_d | -- | -- | -- | -- | -- |
| Mo_t | -- | -- | -- | -- | -- |
| Mo_? | -- | -- | -- | -- | -- |
| Ni_d | -- | -- | -- | -- | -- |
| Ni_t | -- | -- | -- | -- | -- |
| P_ | -- | -- | -- | -- | -- |
| Pb_d | -- | -- | -- | -- | -- |
| Pb_t | -- | -- | -- | -- | -- |
| Se_d | -- | -- | -- | -- | -- |
| Se_t | -- | -- | -- | -- | -- |
| SiO2 final | -- | -- | -- | -- | -- |
| Tl_d | -- | -- | -- | -- | -- |
| Tl_t | -- | -- | -- | -- | -- |
| V_d | -- | -- | -- | -- | -- |
| V_t | -- | -- | -- | -- | -- |
| Zn_d | -- | -- | -- | -- | -- |
| Zn_t | 0.232 | 0.3 | 0.19 | -- | -- |
| Zn_? | -- | -- | -- | -- | -- |
| Total cations (meq/L) | -- | -- | -- | -- | -- |
| Total anions (meq/L) | -- | -- | -- | -- | -- |
| Charge Imbalance (%) | -- | -- | -- | -- | -- |
| Date (mm/dd/yy) | 07/21/97 | 08/14/97 | 09/09/97 | 09/09/97 | 09/18/97 |
| Time (24-hr) | -- | -- | -- | -- | -- |
| Collected by | Vail Engineering, Inc. | NM ONRT | Vail Engineering, Inc. | Vail Engineering, Inc. | NM ONRT |
| Source | Vail Engineering, Inc., written commun., 2002 | Allen and others, 1999 | Vail Engineering, Inc., written commun., 2002 | URS, 2001 | Allen and others, 1999 |
| Measured Discharge (ft3/s) | -- | 43 | -- | 27.93 | 22 |
| Flow Comments | No mill well or river diversions | -- | River diversion was on | -- | -- |
| Hydrologic Condition | Storm | Low flow | Low flow | Low flow | Low flow |
| Avg Daily Discharge (ft3/s) | 59 | 43 | 28 | 28 | 22 |
| Avg Monthly Discharge (ft3/s) | -- | -- | -- | -- | -- |
| Max Avg Daily Discharge snowmelt runoff (ft3/s) | 347 | 347 | 347 | 347 | 347 |
| pH-field (SU) | 7.9 | -- | 7.8 | -- | -- |
| pH-lab (SU) | 7.5 | -- | 7.5 | -- | -- |
| SC-field (µS/cm) | 272 | -- | 333 | -- | -- |
| SC-lab (µS/cm) | 268 | -- | 331 | -- | -- |
| SC, 25°C (µS/cm) | -- | -- | -- | -- | -- |
| Temp, field (°C) | -- | -- | -- | -- | -- |
| TDS, meas (mg/L) | -- | -- | 235 | -- | -- |
| TSS (mg/L) | -- | -- | 11.2 | -- | -- |
| DOC (mg/L) | -- | -- | -- | -- | -- |
| Turbidity, field (NTU) | -- | -- | -- | -- | -- |
| Turbidity, lab (NTU) | -- | -- | -- | -- | -- |
| Turbidity (JTU) | 2.4 | -- | 8.0 | -- | -- |
| Constituent (mg/L) | |||||
| Ca final | -- | -- | -- | -- | -- |
| Mg final | 7.8 | -- | 9.5 | -- | -- |
| Na final | -- | -- | -- | -- | -- |
| K final | -- | -- | -- | -- | -- |
| SO4 final | 70 | -- | 114 | -- | -- |
| Alk final (mg/L CaCO3) | 55 | -- | 45 | -- | -- |
| F final | -- | -- | 0.98 | -- | -- |
| Cl final | -- | -- | -- | -- | -- |
| Ag_d | -- | -- | -- | -- | -- |
| Ag_t | -- | -- | -- | -- | -- |
| Al_d | -- | -- | <0.5 | -- | -- |
| Al_s | -- | -- | -- | -- | -- |
| Al_t | 1.35 | -- | -- | -- | -- |
| As_d | -- | -- | -- | -- | -- |
| As_t | -- | -- | -- | -- | -- |
| Ba_d | -- | -- | -- | -- | -- |
| Ba_t | -- | -- | -- | -- | -- |
| Be_d | -- | -- | -- | -- | -- |
| Be_t | -- | -- | -- | -- | -- |
| Cd_d | -- | -- | -- | -- | -- |
| Cd_t | -- | -- | -- | -- | -- |
| Cd_? | -- | -- | -- | -- | -- |
| Co_d | -- | -- | -- | -- | -- |
| Co_t | -- | -- | -- | -- | -- |
| Cr_d | -- | -- | -- | -- | -- |
| Cr_t | -- | -- | -- | -- | -- |
| Cr_? | -- | -- | -- | -- | -- |
| Cu_d | -- | -- | -- | -- | -- |
| Cu_t | -- | -- | -- | -- | -- |
| Cu_? | -- | -- | -- | -- | -- |
| Fe_d | -- | -- | <0.2 | -- | -- |
| Fe_t | -- | -- | -- | -- | -- |
| Fe_? | -- | -- | -- | -- | -- |
| Hg_d | -- | -- | -- | -- | -- |
| Hg_t | -- | -- | -- | -- | -- |
| Mn_d | -- | -- | -- | -- | -- |
| Mn_t | 0.41 | -- | -- | -- | -- |
| Mn_? | -- | -- | -- | -- | -- |
| Mo_d | -- | -- | -- | -- | -- |
| Mo_t | -- | -- | -- | -- | -- |
| Mo_? | -- | -- | -- | -- | -- |
| Ni_d | -- | -- | -- | -- | -- |
| Ni_t | -- | -- | -- | -- | -- |
| P_ | -- | -- | -- | -- | -- |
| Pb_d | -- | -- | -- | -- | -- |
| Pb_t | -- | -- | -- | -- | -- |
| Se_d | -- | -- | -- | -- | -- |
| Se_t | -- | -- | -- | -- | -- |
| SiO2 final | -- | -- | -- | -- | -- |
| Tl_d | -- | -- | -- | -- | -- |
| Tl_t | -- | -- | -- | -- | -- |
| V_d | -- | -- | -- | -- | -- |
| V_t | -- | -- | -- | -- | -- |
| Zn_d | -- | -- | -- | -- | -- |
| Zn_t | 0.12 | -- | <0.25 | -- | -- |
| Zn_? | -- | -- | -- | -- | -- |
| Total cations (meq/L) | -- | -- | -- | -- | -- |
| Total anions (meq/L) | -- | -- | -- | -- | -- |
| Charge Imbalance (%) | -- | -- | -- | -- | -- |
| Date (mm/dd/yy) | 10/23/97 | 11/03/97 | 11/03/97 | 11/20/97 | 12/19/97 |
| Time (24-hr) | -- | -- | -- | -- | -- |
| Collected by | NM ONRT | Vail Engineering, Inc. | Vail Engineering, Inc. | NM ONRT | NM ONRT |
| Source | Allen and others, 1999 | Vail Engineering, Inc., written commun., 2002 | URS, 2001 | Allen and others, 1999 | Allen and others, 1999 |
| Measured Discharge (ft3/s) | 19 | -- | 23.64 | 9 | 9 |
| Flow Comments | -- | -- | -- | -- | -- |
| Hydrologic Condition | Low flow | Low flow | Low flow | Low flow | Low flow |
| Avg Daily Discharge (ft3/s) | 19 | 21 | 21 | 9 | 8.9 |
| Avg Monthly Discharge (ft3/s) | -- | -- | -- | -- | -- |
| Max Avg Daily Discharge snowmelt runoff (ft3/s) | 347 | 347 | 347 | 347 | 347 |
| pH-field (SU) | -- | 7.5 | -- | -- | -- |
| pH-lab (SU) | -- | 7.3 | -- | -- | -- |
| SC-field (µS/cm) | -- | 346 | -- | -- | -- |
| SC-lab (µS/cm) | -- | 332 | -- | -- | -- |
| SC, 25°C (µS/cm) | -- | -- | -- | -- | -- |
| Temp, field (°C) | -- | -- | -- | -- | -- |
| TDS, meas (mg/L) | -- | -- | -- | -- | -- |
| TSS (mg/L) | -- | -- | -- | -- | -- |
| DOC (mg/L) | -- | -- | -- | -- | -- |
| Turbidity, field (NTU) | -- | -- | -- | -- | -- |
| Turbidity, lab (NTU) | -- | -- | -- | -- | -- |
| Turbidity (JTU) | -- | -- | -- | -- | -- |
| Constituent (mg/L) | |||||
| Ca final | -- | -- | -- | -- | -- |
| Mg final | -- | 10.1 | -- | -- | -- |
| Na final | -- | -- | -- | -- | -- |
| K final | -- | -- | -- | -- | -- |
| SO4 final | -- | 128 | -- | -- | -- |
| Alk final (mg/L CaCO3) | -- | -- | -- | -- | -- |
| F final | -- | 0.90 | -- | -- | -- |
| Cl final | -- | -- | -- | -- | -- |
| Ag_d | -- | -- | -- | -- | -- |
| Ag_t | -- | -- | -- | -- | -- |
| Al_d | -- | -- | -- | -- | -- |
| Al_s | -- | -- | -- | -- | -- |
| Al_t | -- | 2.20 | -- | -- | -- |
| As_d | -- | -- | -- | -- | -- |
| As_t | -- | -- | -- | -- | -- |
| Ba_d | -- | -- | -- | -- | -- |
| Ba_t | -- | -- | -- | -- | -- |
| Be_d | -- | -- | -- | -- | -- |
| Be_t | -- | -- | -- | -- | -- |
| Cd_d | -- | -- | -- | -- | -- |
| Cd_t | -- | -- | -- | -- | -- |
| Cd_? | -- | -- | -- | -- | -- |
| Co_d | -- | -- | -- | -- | -- |
| Co_t | -- | -- | -- | -- | -- |
| Cr_d | -- | -- | -- | -- | -- |
| Cr_t | -- | -- | -- | -- | -- |
| Cr_? | -- | -- | -- | -- | -- |
| Cu_d | -- | -- | -- | -- | -- |
| Cu_t | -- | -- | -- | -- | -- |
| Cu_? | -- | -- | -- | -- | -- |
| Fe_d | -- | -- | -- | -- | -- |
| Fe_t | -- | -- | -- | -- | -- |
| Fe_? | -- | -- | -- | -- | -- |
| Hg_d | -- | -- | -- | -- | -- |
| Hg_t | -- | -- | -- | -- | -- |
| Mn_d | -- | -- | -- | -- | -- |
| Mn_t | -- | 0.6 | -- | -- | -- |
| Mn_? | -- | -- | -- | -- | -- |
| Mo_d | -- | -- | -- | -- | -- |
| Mo_t | -- | -- | -- | -- | -- |
| Mo_? | -- | -- | -- | -- | -- |
| Ni_d | -- | -- | -- | -- | -- |
| Ni_t | -- | -- | -- | -- | -- |
| P_ | -- | -- | -- | -- | -- |
| Pb_d | -- | -- | -- | -- | -- |
| Pb_t | -- | -- | -- | -- | -- |
| Se_d | -- | -- | -- | -- | -- |
| Se_t | -- | -- | -- | -- | -- |
| SiO2 final | -- | -- | -- | -- | -- |
| Tl_d | -- | -- | -- | -- | -- |
| Tl_t | -- | -- | -- | -- | -- |
| V_d | -- | -- | -- | -- | -- |
| V_t | -- | -- | -- | -- | -- |
| Zn_d | -- | -- | -- | -- | -- |
| Zn_t | -- | <0.25 | -- | -- | -- |
| Zn_? | -- | -- | -- | -- | -- |
| Total cations (meq/L) | -- | -- | -- | -- | -- |
| Total anions (meq/L) | -- | -- | -- | -- | -- |
| Charge Imbalance (%) | -- | -- | -- | -- | -- |
| Date (mm/dd/yy) | 01/14/98 | 02/20/98 | 03/09/98 | 03/09/98 | 03/19/98 |
| Time (24-hr) | -- | -- | -- | -- | -- |
| Collected by | NM ONRT | NM ONRT | Vail Engineering, Inc. | Vail Engineering, Inc. | NM ONRT |
| Source | Allen and others, 1999 | Allen and others, 1999 | Vail Engineering, Inc., 2002 | URS, 2001 | Allen and others, 1999 |
| Measured Discharge (ft3/s) | 17 | 12 | -- | 18.13 | 16 |
| Flow Comments | -- | -- | -- | -- | -- |
| Hydrologic Condition | Low flow | Low flow | Low flow | Low flow | Rising limb |
| Avg Daily Discharge (ft3/s) | 17 | 12 | 15 | 15 | 16 |
| Avg Monthly Discharge (ft3/s) | -- | -- | -- | -- | -- |
| Max Avg Daily Discharge snowmelt runoff (ft3/s) | 347 | 347 | 347 | 347 | 139 |
| pH-field (SU) | -- | -- | 6.9 | -- | -- |
| pH-lab (SU) | -- | -- | 7.4 | -- | -- |
| SC-field (µS/cm) | -- | -- | 410 | -- | -- |
| SC-lab (µS/cm) | -- | -- | 396 | -- | -- |
| SC, 25°C (µS/cm) | -- | -- | -- | -- | -- |
| Temp, field (°C) | -- | -- | -- | -- | -- |
| TDS, meas (mg/L) | -- | -- | -- | -- | -- |
| TSS (mg/L) | -- | -- | -- | -- | -- |
| DOC (mg/L) | -- | -- | -- | -- | -- |
| Turbidity, field (NTU) | -- | -- | 12.0 | -- | -- |
| Turbidity, lab (NTU) | -- | -- | 11.9 | -- | -- |
| Turbidity (JTU) | -- | -- | -- | -- | -- |
| Constituent (mg/L) | |||||
| Ca final | -- | -- | -- | -- | -- |
| Mg final | -- | -- | 11.8 | -- | -- |
| Na final | -- | -- | -- | -- | -- |
| K final | -- | -- | -- | -- | -- |
| SO4 final | -- | -- | 150 | -- | -- |
| Alk final (mg/L CaCO3) | 0.0 | -- | -- | -- | -- |
| F final | -- | -- | 1.00 | -- | -- |
| Cl final | -- | -- | -- | -- | -- |
| Ag_d | -- | -- | -- | -- | -- |
| Ag_t | -- | -- | -- | -- | -- |
| Al_d | -- | -- | -- | -- | -- |
| Al_s | -- | -- | -- | -- | -- |
| Al_t | -- | -- | 3.30 | -- | -- |
| As_d | -- | -- | -- | -- | -- |
| As_t | -- | -- | -- | -- | -- |
| Ba_d | -- | -- | -- | -- | -- |
| Ba_t | -- | -- | -- | -- | -- |
| Be_d | -- | -- | -- | -- | -- |
| Be_t | -- | -- | -- | -- | -- |
| Cd_d | -- | -- | -- | -- | -- |
| Cd_t | -- | -- | -- | -- | -- |
| Cd_? | -- | -- | -- | -- | -- |
| Co_d | -- | -- | -- | -- | -- |
| Co_t | -- | -- | -- | -- | -- |
| Cr_d | -- | -- | -- | -- | -- |
| Cr_t | -- | -- | -- | -- | -- |
| Cr_? | -- | -- | -- | -- | -- |
| Cu_d | -- | -- | -- | -- | -- |
| Cu_t | -- | -- | -- | -- | -- |
| Cu_? | -- | -- | -- | -- | -- |
| Fe_d | -- | -- | -- | -- | -- |
| Fe_t | -- | -- | -- | -- | -- |
| Fe_? | -- | -- | -- | -- | -- |
| Hg_d | -- | -- | -- | -- | -- |
| Hg_t | -- | -- | -- | -- | -- |
| Mn_d | -- | -- | -- | -- | -- |
| Mn_t | -- | -- | 0.50 | -- | -- |
| Mn_? | -- | -- | -- | -- | -- |
| Mo_d | -- | -- | -- | -- | -- |
| Mo_t | -- | -- | -- | -- | -- |
| Mo_? | -- | -- | -- | -- | -- |
| Ni_d | -- | -- | -- | -- | -- |
| Ni_t | -- | -- | -- | -- | -- |
| P_ | -- | -- | -- | -- | -- |
| Pb_d | -- | -- | -- | -- | -- |
| Pb_t | -- | -- | -- | -- | -- |
| Se_d | -- | -- | -- | -- | -- |
| Se_t | -- | -- | -- | -- | -- |
| SiO2 final | -- | -- | -- | -- | -- |
| Tl_d | -- | -- | -- | -- | -- |
| Tl_t | -- | -- | -- | -- | -- |
| V_d | -- | -- | -- | -- | -- |
| V_t | -- | -- | -- | -- | -- |
| Zn_d | -- | -- | -- | -- | -- |
| Zn_t | -- | -- | <0.25 | -- | -- |
| Zn_? | -- | -- | -- | -- | -- |
| Total cations (meq/L) | -- | -- | -- | -- | -- |
| Total anions (meq/L) | -- | -- | -- | -- | -- |
| Charge Imbalance (%) | -- | -- | -- | -- | -- |
| Date (mm/dd/yy) | 04/30/98 | 04/30/98 | 06/04/98 | 07/16/98 | 10/20/98 |
| Time (24-hr) | -- | -- | -- | -- | -- |
| Collected by | Vail Engineering, Inc. | NM ONRT | NM ONRT | NM ONRT | Vail Engineering, Inc. |
| Source | Vail Engineering, Inc., written commun., 2002 | Allen and others, 1999 | Allen and others, 1999 | Allen and others, 1999 | Vail Engineering, Inc., written commun., 2002 |
| Measured Discharge (ft3/s) | -- | 54 | 137 | 57 | 21.1 |
| Flow Comments | -- | -- | -- | -- | Erratic mill river diversions |
| Hydrologic Condition | Rising limb | Rising limb | Peak | Falling limb | Low flow |
| Avg Daily Discharge (ft3/s) | 54 | 54 | 137 | 57 | 21 |
| Avg Monthly Discharge (ft3/s) | -- | -- | -- | -- | -- |
| Max Avg Daily Discharge snowmelt runoff (ft3/s) | 139 | 139 | 139 | 139 | 139 |
| pH-field (SU) | 7.0 | -- | -- | -- | 7.9 |
| pH-lab (SU) | 7.8 | -- | -- | -- | -- |
| SC-field (µS/cm) | 246 | -- | -- | -- | 334 |
| SC-lab (µS/cm) | 240 | -- | -- | -- | -- |
| SC, 25°C (µS/cm) | -- | -- | -- | -- | -- |
| Temp, field (°C) | -- | -- | -- | -- | -- |
| TDS, meas (mg/L) | -- | -- | -- | -- | -- |
| TSS (mg/L) | 16.5 | -- | -- | -- | -- |
| DOC (mg/L) | -- | -- | -- | -- | -- |
| Turbidity, field (NTU) | -- | -- | -- | -- | -- |
| Turbidity, lab (NTU) | -- | -- | -- | -- | -- |
| Turbidity (JTU) | -- | -- | -- | -- | -- |
| Constituent (mg/L) | |||||
| Ca final | -- | -- | -- | -- | -- |
| Mg final | -- | -- | -- | -- | -- |
| Na final | -- | -- | -- | -- | -- |
| K final | -- | -- | -- | -- | -- |
| SO4 final | 70 | -- | -- | -- | 110 |
| Alk final (mg/L CaCO3) | -- | -- | -- | -- | -- |
| F final | 0.51 | -- | -- | -- | 0.72 |
| Cl final | -- | -- | -- | -- | -- |
| Ag_d | -- | -- | -- | -- | -- |
| Ag_t | -- | -- | -- | -- | -- |
| Al_d | -- | -- | -- | -- | -- |
| Al_s | -- | -- | -- | -- | -- |
| Al_t | -- | -- | -- | -- | 1.40 |
| As_d | -- | -- | -- | -- | -- |
| As_t | -- | -- | -- | -- | -- |
| Ba_d | -- | -- | -- | -- | -- |
| Ba_t | -- | -- | -- | -- | -- |
| Be_d | -- | -- | -- | -- | -- |
| Be_t | -- | -- | -- | -- | -- |
| Cd_d | -- | -- | -- | -- | -- |
| Cd_t | -- | -- | -- | -- | -- |
| Cd_? | -- | -- | -- | -- | -- |
| Co_d | -- | -- | -- | -- | -- |
| Co_t | -- | -- | -- | -- | -- |
| Cr_d | -- | -- | -- | -- | -- |
| Cr_t | -- | -- | -- | -- | -- |
| Cr_? | -- | -- | -- | -- | -- |
| Cu_d | <0.02 | -- | -- | -- | <0.25 |
| Cu_t | -- | -- | -- | -- | -- |
| Cu_? | -- | -- | -- | -- | -- |
| Fe_d | -- | -- | -- | -- | -- |
| Fe_t | -- | -- | -- | -- | -- |
| Fe_? | -- | -- | -- | -- | -- |
| Hg_d | -- | -- | -- | -- | -- |
| Hg_t | -- | -- | -- | -- | -- |
| Mn_d | -- | -- | -- | -- | -- |
| Mn_t | 0.20 | -- | -- | -- | -- |
| Mn_? | -- | -- | -- | -- | -- |
| Mo_d | -- | -- | -- | -- | -- |
| Mo_t | -- | -- | -- | -- | -- |
| Mo_? | -- | -- | -- | -- | <0.1 |
| Ni_d | -- | -- | -- | -- | -- |
| Ni_t | -- | -- | -- | -- | -- |
| P_ | -- | -- | -- | -- | -- |
| Pb_d | -- | -- | -- | -- | -- |
| Pb_t | -- | -- | -- | -- | -- |
| Se_d | -- | -- | -- | -- | -- |
| Se_t | -- | -- | -- | -- | -- |
| SiO2 final | -- | -- | -- | -- | -- |
| Tl_d | -- | -- | -- | -- | -- |
| Tl_t | -- | -- | -- | -- | -- |
| V_d | -- | -- | -- | -- | -- |
| V_t | -- | -- | -- | -- | -- |
| Zn_d | -- | -- | -- | -- | -- |
| Zn_t | 0.06 | -- | -- | -- | <0.25 |
| Zn_? | -- | -- | -- | -- | -- |
| Total cations (meq/L) | -- | -- | -- | -- | -- |
| Total anions (meq/L) | -- | -- | -- | -- | -- |
| Charge Imbalance (%) | -- | -- | -- | -- | -- |
| Date (mm/dd/yy) | 02/25/99 | 09/27/99 | 10/13/99 | 10/13/99 | 03/15/00 |
| Time (24-hr) | -- | -- | -- | -- | -- |
| Collected by | Vail Engineering, Inc. | Vail Engineering, Inc. | Vail Engineering, Inc. | Vail Engineering, Inc. | Vail Engineering, Inc. |
| Source | Vail Engineering, Inc., written commun., 2002 | Vail Engineering, Inc., written commun., 2002 | Vail Engineering, Inc., written commun., 2002 | URS, 2001 | Vail Engineering, Inc., written commun., 2002 |
| Measured Discharge (ft3/s) | -- | -- | 25.37 | 24.93 | 18.00 |
| Flow Comments | -- | -- | Includes South Ditch | -- | -- |
| Hydrologic Condition | Low flow | Low flow | Low flow | Low flow | Low flow |
| Avg Daily Discharge (ft3/s) | 14 | 25 | 23 | 23 | 16 |
| Avg Monthly Discharge (ft3/s) | -- | -- | -- | -- | -- |
| Max Avg Daily Discharge snowmelt runoff (ft3/s) | 139 | 288 | 288 | 288 | 288 |
| pH-field (SU) | 7.8 | -- | -- | -- | 7.7 |
| pH-lab (SU) | -- | -- | 7.8 | -- | -- |
| SC-field (µS/cm) | 384 | 296 | 312 | -- | 386 |
| SC-lab (µS/cm) | -- | -- | -- | -- | -- |
| SC, 25°C (µS/cm) | -- | -- | -- | -- | -- |
| Temp, field (°C) | -- | -- | -- | -- | -- |
| TDS, meas (mg/L) | -- | -- | -- | -- | -- |
| TSS (mg/L) | -- | -- | -- | -- | -- |
| DOC (mg/L) | -- | -- | -- | -- | -- |
| Turbidity, field (NTU) | 8.7 | -- | -- | -- | -- |
| Turbidity, lab (NTU) | -- | -- | -- | -- | 7.2 |
| Turbidity (JTU) | -- | -- | -- | -- | -- |
| Constituent (mg/L) | |||||
| Ca final | -- | -- | -- | -- | -- |
| Mg final | -- | -- | 9.2 | -- | 12.0 |
| Na final | -- | -- | -- | -- | -- |
| K final | -- | -- | -- | -- | -- |
| SO4 final | 128 | -- | 102 | -- | 136 |
| Alk final (mg/L CaCO3) | -- | -- | -- | -- | -- |
| F final | -- | -- | 0.70 | -- | 0.8 |
| Cl final | -- | -- | -- | -- | -- |
| Ag_d | -- | -- | -- | -- | -- |
| Ag_t | -- | -- | -- | -- | -- |
| Al_d | -- | -- | 0.11 | -- | 0.10 |
| Al_s | -- | -- | -- | -- | -- |
| Al_t | -- | -- | 1.50 | -- | 2.50 |
| As_d | -- | -- | -- | -- | -- |
| As_t | -- | -- | -- | -- | -- |
| Ba_d | -- | -- | -- | -- | -- |
| Ba_t | -- | -- | -- | -- | -- |
| Be_d | -- | -- | -- | -- | -- |
| Be_t | -- | -- | -- | -- | -- |
| Cd_d | -- | -- | -- | -- | -- |
| Cd_t | -- | -- | -- | -- | -- |
| Cd_? | -- | -- | -- | -- | -- |
| Co_d | -- | -- | -- | -- | -- |
| Co_t | -- | -- | -- | -- | -- |
| Cr_d | -- | -- | -- | -- | -- |
| Cr_t | -- | -- | -- | -- | -- |
| Cr_? | -- | -- | -- | -- | -- |
| Cu_d | -- | -- | -- | -- | -- |
| Cu_t | -- | -- | -- | -- | -- |
| Cu_? | -- | -- | -- | -- | -- |
| Fe_d | -- | -- | -- | -- | -- |
| Fe_t | -- | -- | -- | -- | -- |
| Fe_? | -- | -- | -- | -- | -- |
| Hg_d | -- | -- | -- | -- | -- |
| Hg_t | -- | -- | -- | -- | -- |
| Mn_d | -- | -- | -- | -- | -- |
| Mn_t | -- | -- | 0.27 | -- | 0.41 |
| Mn_? | -- | -- | -- | -- | -- |
| Mo_d | -- | -- | -- | -- | -- |
| Mo_t | -- | -- | -- | -- | -- |
| Mo_? | -- | -- | -- | -- | -- |
| Ni_d | -- | -- | -- | -- | -- |
| Ni_t | -- | -- | -- | -- | -- |
| P_ | -- | -- | -- | -- | -- |
| Pb_d | -- | -- | -- | -- | -- |
| Pb_t | -- | -- | -- | -- | -- |
| Se_d | -- | -- | -- | -- | -- |
| Se_t | -- | -- | -- | -- | -- |
| SiO2 final | -- | -- | -- | -- | -- |
| Tl_d | -- | -- | -- | -- | -- |
| Tl_t | -- | -- | -- | -- | -- |
| V_d | -- | -- | -- | -- | -- |
| V_t | -- | -- | -- | -- | -- |
| Zn_d | -- | -- | -- | -- | 0.055 |
| Zn_t | -- | -- | -- | -- | -- |
| Zn_? | -- | -- | -- | -- | -- |
| Total cations (meq/L) | -- | -- | -- | -- | -- |
| Total anions (meq/L) | -- | -- | -- | -- | -- |
| Charge Imbalance (%) | -- | -- | -- | -- | -- |
| Date (mm/dd/yy) | 03/15/00 | 05/01/00 | 05/01/00 | 07/18/00 | 07/18/00 |
| Time (24-hr) | -- | -- | -- | -- | -- |
| Collected by | Vail Engineering, Inc. | -- | Medine | RGC | RGC |
| Source | URS, 2001 | Molycorp, Inc., 2002 | Medine, 2000 | RGC, 2000b | RGC, 2000b |
| Measured Discharge (ft3/s) | 14.68 | -- | 41 | -- | -- |
| Flow Comments | -- | -- | -- | -- | Duplicate |
| Hydrologic Condition | Low flow | Peak | Peak | Storm | Storm |
| Avg Daily Discharge (ft3/s) | 16 | 46 | 46 | 25 | 25 |
| Avg Monthly Discharge (ft3/s) | -- | -- | -- | -- | -- |
| Max Avg Daily Discharge snowmelt runoff (ft3/s) | 288 | 48 | 48 | 48 | 48 |
| pH-field (SU) | -- | -- | 7.8 | -- | -- |
| pH-lab (SU) | -- | 6.9 | -- | 4.8 | -- |
| SC-field (µS/cm) | -- | -- | 277 | -- | -- |
| SC-lab (µS/cm) | -- | -- | -- | 550 | -- |
| SC, 25°C (µS/cm) | -- | -- | -- | -- | -- |
| Temp, field (°C) | -- | -- | -- | -- | -- |
| TDS, meas (mg/L) | -- | 180 | 180 | -- | -- |
| TSS (mg/L) | -- | 6 | 6 | 720 | -- |
| DOC (mg/L) | -- | 2 | 2 | -- | -- |
| Turbidity, field (NTU) | -- | -- | -- | -- | -- |
| Turbidity, lab (NTU) | -- | -- | -- | -- | -- |
| Turbidity (JTU) | -- | -- | -- | -- | -- |
| Constituent (mg/L) | |||||
| Ca final | -- | 38.3 | 38.3 | 86 | -- |
| Mg final | -- | 8.1 | 8.1 | 11 | 14.1 |
| Na final | -- | 4.4 | 4.4 | 6.6 | -- |
| K final | -- | 1 | 1 | 2.1 | -- |
| SO4 final | -- | 80 | 80 | 360 | -- |
| Alk final (mg/L CaCO3) | -- | 51 | 51 | <10 | -- |
| F final | -- | 0.5 | 0.5 | 0.53 | -- |
| Cl final | -- | 2 | 2 | 4.9 | -- |
| Ag_d | -- | -- | -- | <0.01 | -- |
| Ag_t | -- | -- | -- | <0.01 | <0.01 |
| Al_d | -- | 0.21 | 0.21 | 0.23 | -- |
| Al_s | -- | -- | -- | -- | -- |
| Al_t | -- | 1.21 | 1.21 | 10 | 9.57 |
| As_d | -- | -- | -- | -0.01 | -- |
| As_t | -- | -- | -- | <0.01 | <0.01 |
| Ba_d | -- | -- | -- | <0.01 | -- |
| Ba_t | -- | -- | -- | 0.34 | 0.439 |
| Be_d | -- | -- | -- | <0.005 | -- |
| Be_t | -- | -- | -- | <0.005 | -- |
| Cd_d | -- | 0.0005 | 0.0005 | <0.005 | <0.005 |
| Cd_t | -- | -- | -- | <0.005 | <0.005 |
| Cd_? | -- | -- | -- | -- | -- |
| Co_d | -- | 0.0022 | 0.0022 | <0.01 | -- |
| Co_t | -- | 0.0026 | 0.0026 | 0.012 | 0.0126 |
| Cr_d | -- | -- | -- | <0.01 | -- |
| Cr_t | -- | -- | -- | 0.011 | 0.0119 |
| Cr_? | -- | -- | -- | -- | -- |
| Cu_d | -- | 0.005 | 0.005 | <0.01 | -- |
| Cu_t | -- | 0.005 | 0.005 | 0.075 | 0.0848 |
| Cu_? | -- | -- | -- | -- | -- |
| Fe_d | -- | -- | -- | <0.01 | -- |
| Fe_t | -- | 0.33 | 0.33 | 32 | 39.3 |
| Fe_? | -- | -- | -- | -- | -- |
| Hg_d | -- | -- | -- | -- | -- |
| Hg_t | -- | -- | -- | -- | -- |
| Mn_d | -- | 0.182 | 0.182 | 0.74 | -- |
| Mn_t | -- | 0.2 | 0.2 | 0.92 | 0.952 |
| Mn_? | -- | -- | -- | -- | -- |
| Mo_d | -- | 0.0022 | 0.0022 | <0.01 | -- |
| Mo_t | -- | 0.0022 | 0.0022 | 0.014 | 0.0179 |
| Mo_? | -- | -- | -- | -- | -- |
| Ni_d | -- | 0.011 | 0.011 | 0.037 | -- |
| Ni_t | -- | 0.014 | 0.014 | 0.048 | 0.0491 |
| P_ | -- | -- | -- | -- | -- |
| Pb_d | -- | -- | -- | <0.003 | -- |
| Pb_t | -- | -- | -- | 0.13 | 0.167 |
| Se_d | -- | -- | -- | <0.005 | -- |
| Se_t | -- | -- | -- | <0.005 | <0.005 |
| SiO2 final | -- | -- | -- | -- | -- |
| Tl_d | -- | -- | -- | <0.01 | -- |
| Tl_t | -- | -- | -- | <0.01 | <0.01 |
| V_d | -- | -- | -- | <0.01 | -- |
| V_t | -- | -- | -- | 0.014 | 0.0149 |
| Zn_d | -- | 0.06 | 0.06 | 0.12 | -- |
| Zn_t | -- | 0.09 | 0.09 | 0.32 | 0.345 |
| Zn_? | -- | -- | -- | -- | -- |
| Total cations (meq/L) | -- | 2.8 | 2.8 | -- | -- |
| Total anions (meq/L) | -- | 2.8 | 2.8 | -- | -- |
| Charge Imbalance (%) | -- | 0 | 0 | -- | -- |
| Date (mm/dd/yy) | 08/06/00 | 09/06/00 | 11/03/00 | 02/20/01 | 05/22/01 |
| Time (24-hr) | -- | -- | -- | -- | -- |
| Collected by | RGC | Vail Engineering, Inc. | Vail Engineering, Inc. | Vail Engineering, Inc./Martinez | -- |
| Source | RGC, 2000b | Vail Engineering, Inc., written commun., 2002 | Vail Engineering, Inc., written commun., 2002 | Vail Engineering, Inc., written commun., 2002 | Molycorp, Inc., written commun., 2002 |
| Measured Discharge (ft3/s) | -- | 10.73 | +/-15 | 6.37 | 145.5 |
| Flow Comments | -- | -- | -- | -- | -- |
| Hydrologic Condition | Storm | Low flow | Low flow | Low flow | Peak |
| Avg Daily Discharge (ft3/s) | 12 | 12 | 13 | 10 | 187 |
| Avg Monthly Discharge (ft3/s) | -- | -- | -- | -- | -- |
| Max Avg Daily Discharge snowmelt runoff (ft3/s) | 48 | 48 | 48 | 48 | 218 |
| pH-field (SU) | -- | 7.9 | 7.8 | 7.7 | 7.41 |
| pH-lab (SU) | 6.2 | -- | -- | -- | -- |
| SC-field (µS/cm) | -- | 384 | 382 | -- | 174 |
| SC-lab (µS/cm) | 380 | -- | -- | -- | -- |
| SC, 25°C (µS/cm) | -- | -- | -- | -- | -- |
| Temp, field (°C) | -- | -- | -- | -- | 5.7 |
| TDS, meas (mg/L) | 300 | -- | -- | 340 | 110 |
| TSS (mg/L) | 870 | -- | -- | -- | -- |
| DOC (mg/L) | -- | -- | -- | -- | -- |
| Turbidity, field (NTU) | -- | -- | -- | -- | -- |
| Turbidity, lab (NTU) | -- | -- | -- | -- | -- |
| Turbidity (JTU) | -- | -- | -- | -- | -- |
| Constituent (mg/L) | |||||
| Ca final | 57 | -- | -- | -- | 22 |
| Mg final | 12 | -- | -- | 14.0 | 4.2 |
| Na final | 6.1 | -- | -- | -- | <10 |
| K final | 1.7 | -- | -- | -- | 0.76 |
| SO4 final | 160 | 170 | 150 | 190 | 36 |
| Alk final (mg/L CaCO3) | 19 | -- | 48 | -- | 49 |
| F final | 0.92 | 0.7 | 0.8 | 0.94 | <0.5 |
| Cl final | 4.4 | -- | -- | -- | 1.5 |
| Ag_d | <0.01 | -- | -- | -- | <0.002 |
| Ag_t | <0.01 | -- | -- | -- | <0.002 |
| Al_d | <0.2 | -- | -- | <0.05 | 0.23 |
| Al_s | -- | -- | -- | -- | -- |
| Al_t | 18 | 1.70 | 1.70 | 3.30 | 1.2 |
| As_d | <0.01 | -- | -- | -- | <0.005 |
| As_t | <0.01 | -- | -- | -- | <0.005 |
| Ba_d | <0.01 | -- | -- | -- | 0.025 |
| Ba_t | 0.62 | -- | -- | -- | 0.043 |
| Be_d | <0.005 | -- | -- | -- | <0.004 |
| Be_t | <0.005 | -- | -- | -- | <0.004 |
| Cd_d | <0.005 | -- | -- | -- | <0.001 |
| Cd_t | <0.005 | -- | -- | -- | <0.001 |
| Cd_? | -- | -- | -- | -- | -- |
| Co_d | <0.01 | -- | -- | -- | -- |
| Co_t | 0.02 | -- | -- | -- | -- |
| Cr_d | <0.01 | -- | -- | -- | <0.01 |
| Cr_t | 0.013 | -- | -- | -- | <0.01 |
| Cr_? | -- | -- | -- | -- | -- |
| Cu_d | <0.01 | -- | -- | -- | <0.01 |
| Cu_t | 0.18 | -- | -- | 0.033 | 0.01 |
| Cu_? | -- | -- | -- | -- | -- |
| Fe_d | 0.1 | -- | -- | -- | 0.22 |
| Fe_t | 36 | -- | -- | -- | 1.1 |
| Fe_? | -- | -- | -- | -- | -- |
| Hg_d | -- | -- | -- | -- | -- |
| Hg_t | -- | -- | -- | -- | <0.0002 |
| Mn_d | 0.098 | -- | -- | -- | 0.12 |
| Mn_t | 1.1 | 0.34 | -- | 0.62 | 0.17 |
| Mn_? | -- | -- | -- | -- | -- |
| Mo_d | <0.01 | -- | -- | -- | <0.1 |
| Mo_t | 0.019 | -- | -- | <0.01 | <0.1 |
| Mo_? | -- | -- | -- | -- | -- |
| Ni_d | <0.02 | -- | -- | -- | <0.02 |
| Ni_t | 0.077 | -- | -- | -- | <0.02 |
| P_ | -- | -- | -- | -- | -- |
| Pb_d | <0.003 | -- | -- | -- | <0.003 |
| Pb_t | 0.12 | -- | -- | -- | 0.0034 |
| Se_d | <0.005 | -- | -- | -- | <0.005 |
| Se_t | <0.005 | -- | -- | -- | <0.005 |
| SiO2 final | -- | -- | -- | -- | -- |
| Tl_d | <0.01 | -- | -- | -- | -- |
| Tl_t | <0.01 | -- | -- | -- | -- |
| V_d | <0.01 | -- | -- | -- | -- |
| V_t | 0.017 | -- | -- | -- | -- |
| Zn_d | <0.02 | -- | -- | -- | 0.028 |
| Zn_t | 0.77 | 0.110 | 0.14 | 0.22 | 0.052 |
| Zn_? | -- | -- | -- | -- | -- |
| Total cations (meq/L) | -- | -- | -- | -- | -- |
| Total anions (meq/L) | -- | -- | -- | -- | -- |
| Charge Imbalance (%) | -- | -- | -- | -- | -- |
| Date (mm/dd/yy) | 05/22/01 | 08/21/01 | 11/12/01 | 11/12/01 | 11/12/01 |
| Time (24-hr) | -- | -- | -- | -- | -- |
| Collected by | -- | -- | -- | -- | -- |
| Source | Molycorp, Inc., written commun., 2002 | Molycorp, Inc., written commun., 2002 | Molycorp, Inc., written commun., 2002 | Molycorp, Inc., written commun., 2002 | Molycorp, Inc., written commun., 2002 |
| Measured Discharge (ft3/s) | -- | 21.15 | 13.8 | -- | -- |
| Flow Comments | -- | -- | -- | -- | -- |
| Hydrologic Condition | Peak | Low flow | Low flow | Low flow | Low flow |
| Avg Daily Discharge (ft3/s) | 187 | 37 | 14 | 14 | 14 |
| Avg Monthly Discharge (ft3/s) | -- | -- | -- | -- | -- |
| Max Avg Daily Discharge snowmelt runoff (ft3/s) | 218 | 218 | 218 | 218 | 218 |
| pH-field (SU) | 7.41 | 7.88 | 7.74 | 7.74 | 7.74 |
| pH-lab (SU) | -- | -- | -- | -- | -- |
| SC-field (µS/cm) | 174 | 288 | 386 | 386 | -- |
| SC-lab (µS/cm) | -- | -- | -- | -- | -- |
| SC, 25°C (µS/cm) | -- | -- | -- | -- | -- |
| Temp, field (°C) | 5.7 | 14.5 | 5.3 | 5.3 | 5.3 |
| TDS, meas (mg/L) | 110 | 220 | 260 | 260 | 260 |
| TSS (mg/L) | -- | -- | -- | -- | -- |
| DOC (mg/L) | -- | -- | -- | -- | -- |
| Turbidity, field (NTU) | -- | -- | -- | -- | -- |
| Turbidity, lab (NTU) | -- | -- | -- | -- | -- |
| Turbidity (JTU) | -- | -- | -- | -- | -- |
| Constituent (mg/L) | |||||
| Ca final | 22 | 49 | 49 | 49 | -- |
| Mg final | 4.4 | 11 | 11 | 11 | -- |
| Na final | <10 | <10 | 5.2 | 5.1 | -- |
| K final | 0.81 | <1.3 | 1.4 | 1.4 | -- |
| SO4 final | 36 | 110 | 130 | 130 | 130 |
| Alk final (mg/L CaCO3) | 48 | 51 | 45 | 45 | 45 |
| F final | <0.5 | 1 | 0.81 | 0.81 | -- |
| Cl final | 1.5 | 3.7 | 3.5 | 3.4 | -- |
| Ag_d | <0.002 | <0.002 | <0.002 | <0.002 | -- |
| Ag_t | <0.002 | <0.002 | <0.002 | <0.002 | -- |
| Al_d | 0.26 | 0.29 | 0.13 | 0.12 | -- |
| Al_s | -- | -- | -- | -- | -- |
| Al_t | 1.2 | 1.6 | 1.9 | 1.9 | -- |
| As_d | <0.005 | <0.005 | <0.005 | <0.005 | -- |
| As_t | <0.005 | <0.005 | <0.005 | <0.005 | -- |
| Ba_d | 0.026 | 0.032 | 0.031 | 0.03 | -- |
| Ba_t | 0.044 | 0.035 | 0.032 | 0.032 | -- |
| Be_d | <0.004 | <0.004 | <0.004 | <0.004 | -- |
| Be_t | <0.004 | <0.004 | <0.004 | <0.004 | -- |
| Cd_d | <0.001 | <0.001 | <0.001 | <0.001 | -- |
| Cd_t | <0.001 | 0.001 | <0.001 | <0.001 | -- |
| Cd_? | -- | -- | -- | -- | -- |
| Co_d | -- | -- | -- | -- | -- |
| Co_t | -- | -- | -- | -- | -- |
| Cr_d | <0.01 | <0.01 | <0.01 | <0.01 | -- |
| Cr_t | <0.01 | <0.01 | <0.01 | <0.01 | -- |
| Cr_? | -- | -- | -- | -- | -- |
| Cu_d | <0.01 | <0.01 | 0.0016 | 0.002 | -- |
| Cu_t | 0.013 | 0.017 | 0.019 | 0.019 | -- |
| Cu_? | -- | -- | -- | -- | -- |
| Fe_d | <0.1 | <0.1 | <0.1 | <0.1 | -- |
| Fe_t | 1.2 | 0.32 | 0.27 | 0.26 | -- |
| Fe_? | -- | -- | -- | -- | -- |
| Hg_d | -- | -- | -- | -- | -- |
| Hg_t | <0.0002 | <0.0002 | <0.0002 | <0.0002 | -- |
| Mn_d | 0.12 | 0.45 | 0.38 | 0.38 | -- |
| Mn_t | 0.18 | 0.46 | 0.39 | 0.39 | -- |
| Mn_? | -- | -- | -- | -- | -- |
| Mo_d | <0.1 | <0.1 | -- | -- | -- |
| Mo_t | <0.1 | <0.1 | <0.1 | <0.1 | -- |
| Mo_? | -- | -- | -- | -- | -- |
| Ni_d | <0.02 | 0.021 | 0.018 | 0.018 | -- |
| Ni_t | <0.02 | 0.022 | 0.019 | 0.019 | -- |
| P_ | -- | -- | -- | -- | -- |
| Pb_d | <0.003 | <0.003 | <0.003 | <0.003 | -- |
| Pb_t | <0.003 | <0.003 | <0.003 | <0.003 | -- |
| Se_d | <0.005 | <0.005 | <0.005 | <0.005 | -- |
| Se_t | <0.005 | <0.005 | <0.005 | <0.005 | -- |
| SiO2 final | -- | 5.2 | 5.6 | 5.5 | -- |
| Tl_d | -- | -- | -- | -- | -- |
| Tl_t | -- | -- | -- | -- | -- |
| V_d | -- | <0.01 | <0.01 | <0.01 | -- |
| V_t | -- | <0.01 | <0.01 | <0.01 | -- |
| Zn_d | 0.031 | 0.075 | 0.089 | 0.088 | -- |
| Zn_t | 0.06 | 0.15 | 0.13 | 0.13 | -- |
| Zn_? | -- | -- | -- | -- | -- |
| Total cations (meq/L) | -- | -- | -- | -- | -- |
| Total anions (meq/L) | -- | -- | -- | -- | -- |
| Charge Imbalance (%) | -- | -- | -- | -- | -- |
| Date (mm/dd/yy) | 11/12/01 | 11/12/01 | |||
|---|---|---|---|---|---|
| Time (24-hr) | -- | -- | |||
| Collected by | -- | -- | |||
| Source | Molycorp, Inc., written commun., 2002 | Molycorp, Inc., written commun., 2002 | |||
| Measured Discharge (ft3/s) | -- | -- | |||
| Flow Comments | -- | -- | |||
| Hydrologic Condition | Low flow | Low flow | |||
| Avg Daily Discharge (ft3/s) | 14 | 14 | |||
| Avg Monthly Discharge (ft3/s) | -- | -- | |||
| Max Avg Daily Discharge snowmelt runoff (ft3/s) | 218 | 218 | |||
| pH-field (SU) | 7.74 | 7.74 | |||
| pH-lab (SU) | -- | -- | |||
| SC-field (µS/cm) | -- | -- | |||
| SC-lab (µS/cm) | -- | -- | |||
| SC, 25°C (µS/cm) | -- | -- | |||
| Temp, field (°C) | 5.3 | 5.3 | |||
| TDS, meas (mg/L) | 260 | 260 | |||
| TSS (mg/L) | -- | -- | |||
| DOC (mg/L) | -- | -- | |||
| Turbidity, field (NTU) | -- | -- | |||
| Turbidity, lab (NTU) | -- | -- | |||
| Turbidity (JTU) | -- | -- | |||
| Constituent (mg/L) | |||||
| Ca final | 49 | 49 | |||
| Mg final | 11 | 11 | |||
| Na final | 5.1 | 5.2 | |||
| K final | 1.4 | 1.4 | |||
| SO4 final | 130 | 130 | |||
| Alk final (mg/L CaCO3) | 45 | 45 | |||
| F final | 0.81 | 0.81 | |||
| Cl final | 3.5 | 3.4 | |||
| Ag_d | -- | -- | |||
| Ag_t | 0.002 | <0.002 | |||
| Al_d | 0.12 | 0.13 | |||
| Al_s | -- | -- | |||
| Al_t | 1.9 | 1.9 | |||
| As_d | -- | -- | |||
| As_t | 0.005 | <0.005 | |||
| Ba_d | 0.03 | 0.03 | |||
| Ba_t | 0.03 | 0.03 | |||
| Be_d | -- | -- | |||
| Be_t | 0.004 | <0.004 | |||
| Cd_d | -- | -- | |||
| Cd_t | 0.001 | <0.001 | |||
| Cd_? | -- | -- | |||
| Co_d | -- | -- | |||
| Co_t | -- | -- | |||
| Cr_d | -- | -- | |||
| Cr_t | 0.01 | <0.01 | |||
| Cr_? | -- | -- | |||
| Cu_d | 0.002 | 0.0016 | |||
| Cu_t | 0.01 | 0.01 | |||
| Cu_? | -- | -- | |||
| Fe_d | -- | -- | |||
| Fe_t | 0.26 | 0.27 | |||
| Fe_? | -- | -- | |||
| Hg_d | -- | -- | |||
| Hg_t | <0.0002 | <0.0002 | |||
| Mn_d | -- | -- | |||
| Mn_t | 0.39 | 0.39 | |||
| Mn_? | -- | -- | |||
| Mo_d | <0.1 | <0.1 | |||
| Mo_t | 0.1 | <0.1 | |||
| Mo_? | -- | -- | |||
| Ni_d | 0.01 | 0.01 | |||
| Ni_t | 0.01 | 0.01 | |||
| P_ | -- | -- | |||
| Pb_d | -- | -- | |||
| Pb_t | 0.003 | <0.003 | |||
| Se_d | -- | -- | |||
| Se_t | 0.005 | <0.005 | |||
| SiO2 final | 4.9 | 5.0 | |||
| Tl_d | -- | -- | |||
| Tl_t | -- | -- | |||
| V_d | -- | -- | |||
| V_t | 0.01 | <0.01 | |||
| Zn_d | 0.08 | 0.08 | |||
| Zn_t | 0.13 | 0.13 | |||
| Zn_? | -- | -- | |||
| Total cations (meq/L) | -- | -- | |||
| Total anions (meq/L) | -- | -- | |||
| Charge Imbalance (%) | -- | -- | |||
Table 5. Water-quality data upstream from the Molycorp, Inc. molybdenum mine.
[Source, Vail Engineering, Inc., written commun., 2002. Alk, alkalinity; Avg, average; Disch, discharge; _d, dissolved; JTU, Jackson turbidity units; µS/cm, microsiemens per centimeter; mg/L, milligrams per liter; mm/dd/yy, month/day/year; Moly, Molycorp, Inc.; NTU, nephelometric turbidity units; Prop, property; SC, specific conductance; SU, standard units; _s, suspended; _t, total; TDS, total dissolved solids; TSS, total suspended solids; Upstr., upstream; --, no data]
| Station Identifier | 7 | 7 | 7 | 7 | 7 | 7 | 7 | 7 |
|---|---|---|---|---|---|---|---|---|
| Station Number | 33200 | 33200 | 33200 | 33200 | 33200 | 33200 | 33200 | 33200 |
| Date (mm/dd/yy) | 4/30/98 | 10/20/98 | 2/25/99 | 9/27/99 | 10/13/99 | 3/15/00 | 9/6/00 | 11/3/00 |
| Avg Daily Disch (ft3/s) | -- | 14.88 | -- | -- | 15.37 | 9.31 | 9.56 | 8.99 |
| pH field (SU) | 7.5 | 8.1 | 8.2 | -- | -- | 8.3 | 8.3 | 8 |
| pH lab (SU) | 7.66 | -- | -- | -- | 7.86 | -- | -- | -- |
| SC field (µS/cm) | 223 | 279 | 322 | 264 | 273 | 328 | 311 | 308 |
| SC lab (µS/cm) | 218 | -- | -- | -- | -- | -- | -- | -- |
| TDS (mg/L) | -- | -- | -- | -- | -- | -- | -- | -- |
| TSS (mg/L) | 14.6 | -- | -- | -- | -- | -- | -- | -- |
| Turbidity (JTU) | -- | -- | -- | -- | -- | -- | -- | -- |
| Turbidity (NTU) | -- | -- | 7 | -- | -- | -- | -- | -- |
| Mg (mg/L) | -- | -- | -- | -- | 7.7 | 10 | -- | -- |
| SO4 (mg/L) | 49 | 70 | 92 | -- | 78 | 100 | 106 | 87 |
| SO4 Load (kg/d) | -- | 2,550 | -- | -- | 2,930 | 2,280 | 2,480 | 1,910 |
| Alk (mg/L CaCO3) | 99.2 | -- | -- | -- | -- | -- | -- | 58 |
| F (mg/L) | 0.28 | 0.31 | -- | -- | 0.3 | 0.4 | 0.4 | 0.4 |
| Al_t (mg/L) | -- | 0.6 | -- | -- | -- | 1 | 0.75 | 0.81 |
| Al_d (mg/L) | -- | -- | -- | -- | 0.24 | 0.1 | -- | -- |
| Al_s (mg/L) | -- | -- | -- | -- | -- | -- | -- | -- |
| Cu (mg/L) | -- | <0.25 | -- | -- | -- | -- | -- | -- |
| Fe (mg/L) | -- | -- | -- | -- | -- | -- | -- | -- |
| Mo (mg/L) | -- | <0.1 | -- | -- | -- | -- | -- | -- |
| Mn (mg/L) | <0.2 | -- | -- | -- | 0.12 | 0.19 | 0.17 | -- |
| Zn (mg/L) | <0.05 | <0.25 | -- | -- | -- | 0.014 | <0.05 | 0.045 |
| Station Identifier | 7 | Upstr. Moly Prop Line | Upstr. Moly Prop Line | Upstr. Moly Prop Line | Upstr. Moly Prop Line | 6A | 6A | 6A |
| Station Number | 33200 | 34300 | 34300 | 34300 | 34300 | 39800 | 39800 | 39800 |
| Date (mm/dd/yy) | 2/20/01 | 9/13/88 | 9/20/88 | 9/26/88 | 10/25/88 | 11/29/88 | 10/22/92 | 2/16/93 |
| Avg Daily Disch (ft3/s) | 5.05 | -- | -- | -- | 20 | -- | -- | -- |
| pH field (SU) | 7.9 | 7.2 | 7.9 | 7.5 | 7.8 | -- | -- | -- |
| pH lab (SU) | -- | -- | -- | -- | -- | -- | -- | -- |
| SC field (µS/cm) | 358 | 213 | 166 | 199 | 237 | -- | -- | -- |
| SC lab (µS/cm) | -- | -- | -- | -- | -- | -- | -- | -- |
| TDS (mg/L) | 230 | 198 | 144 | 150 | 174 | -- | -- | -- |
| TSS (mg/L) | -- | 198 | 10 | 6 | 3 | -- | -- | -- |
| Turbidity (JTU) | -- | 320 | 5 | 5 | -- | -- | -- | -- |
| Turbidity (NTU) | -- | -- | -- | -- | -- | -- | -- | -- |
| Mg (mg/L) | 12 | -- | -- | -- | -- | -- | -- | -- |
| SO4 (mg/L) | 120 | 103 | 46 | 51 | 67 | -- | -- | -- |
| SO4 Load (kg/d) | 1,480 | -- | -- | -- | 3,280 | -- | -- | -- |
| Alk (mg/L CaCO3) | -- | 18 | 55 | 56 | 58 | -- | -- | -- |
| F (mg/L) | 0.7 | -- | -- | -- | -- | -- | -- | -- |
| Al_t (mg/L) | 2 | 8.9 | 0.6 | 0.7 | 1.08 | -- | -- | -- |
| Al_d (mg/L) | 0.064 | 0.05 | 0.14 | 0.1 | -- | -- | -- | -- |
| Al_s (mg/L) | -- | 8.85 | 0.46 | 0.6 | -- | -- | -- | -- |
| Cu (mg/L) | -- | -- | -- | -- | -- | -- | -- | -- |
| Fe (mg/L) | 0.041 | 33 | 0.54 | 0.35 | 0.23 | -- | -- | -- |
| Mo (mg/L) | <0.1 | -- | -- | -- | -- | -- | -- | -- |
| Mn (mg/L) | 0.33 | 0.62 | 0.1 | 0.1 | 0.15 | -- | -- | -- |
| Zn (mg/L) | 0.11 | 0.15 | 0.05 | 0.05 | 0.05 | -- | -- | -- |
| Station Identifier | 6A | 6A | 6A | 6A | 6A | 6A | 6A | 6A |
| Station Number | 39800 | 39800 | 39800 | 39800 | 39800 | 39800 | 39800 | 39800 |
| Date (mm/dd/yy) | 11/10/93 | 2/11/94 | 10/13/94 | 2/14/95 | 11/9/95 | 2/26/96 | 11/5/96 | 3/13/97 |
| Avg Daily Disch (ft3/s) | -- | -- | -- | -- | -- | -- | -- | -- |
| pH field (SU) | 7.63 | -- | 7.2 | 7.7 | 7.7 | 7.4 | 6.7 | 7 |
| pH lab (SU) | -- | -- | -- | -- | 7.6 | -- | 7.32 | 7.3 |
| SC field (µS/cm) | 330 | -- | 291 | 340 | 286 | 330 | 334 | 350 |
| SC lab (µS/cm) | -- | -- | -- | -- | 281 | -- | 321 | 348 |
| TDS (mg/L) | 184 | -- | 224 | 260 | 206 | -- | -- | -- |
| TSS (mg/L) | 8 | -- | 7.3 | 9.5 | 4 | -- | -- | -- |
| Turbidity (JTU) | -- | -- | -- | -- | 2.82 | -- | -- | 47 |
| Turbidity (NTU) | -- | -- | -- | -- | -- | -- | -- | -- |
| Mg (mg/L) | -- | -- | -- | -- | 5.2 | 11.4 | 10.1 | 9.9 |
| SO4 (mg/L) | 83 | -- | 97 | 96 | 77 | 96 | 98 | 104 |
| SO4 Load (kg/d) | -- | -- | -- | -- | -- | -- | -- | -- |
| Alk (mg/L CaCO3) | 56 | -- | 76 | 50 | 62 | -- | -- | -- |
| F (mg/L) | 0.378 | -- | 0.5 | 0.472 | 0.3 | 0.386 | -- | -- |
| Al_t (mg/L) | 2.7 | -- | 1.25 | 1.16 | 1.88 | 0.8 | 1.5 | 2.3 |
| Al_d (mg/L) | 1.4 | -- | 0.5 | 0.06 | 0.08 | -- | -- | -- |
| Al_s (mg/L) | 1.3 | -- | 0.75 | 1.1 | 1.8 | -- | -- | -- |
| Cu (mg/L) | -- | -- | -- | -- | -- | -- | -- | -- |
| Fe (mg/L) | 0.604 | -- | 0.27 | 0.323 | 0.329 | -- | -- | -- |
| Mo (mg/L) | -- | -- | -- | -- | -- | -- | -- | -- |
| Mn (mg/L) | 0.254 | -- | 0.121 | 0.168 | 0.17 | 0.149 | 0.3 | 0.3 |
| Zn (mg/L) | 0.084 | -- | 0.044 | 0.066 | 0.09 | 0.06 | <0.09 | <0.09 |
| Station Identifier | 6A | 6A | 6A | 6A | 6A | 6A | 6A | 6A |
| Station Number | 39800 | 39800 | 39800 | 39800 | 39800 | 39800 | 39800 | 39800 |
| Date (mm/dd/yy) | 7/21/97 | 9/9/97 | 11/3/97 | 3/9/98 | 4/30/98 | 10/20/98 | 2/25/99 | 9/27/99 |
| Avg Daily Disch (ft3/s) | -- | -- | -- | -- | -- | 15.4 | -- | -- |
| pH field (SU) | 8.1 | 7.9 | 6.9 | 7.6 | -- | 7.8 | 7.6 | -- |
| pH lab (SU) | -- | 7.56 | -- | -- | -- | -- | -- | -- |
| SC field (µS/cm) | 223 | 259 | 307 | 355 | -- | 279 | 327 | 259 |
| SC lab (µS/cm) | -- | 257 | -- | 334 | -- | -- | -- | -- |
| TDS (mg/L) | -- | 180 | -- | -- | -- | -- | -- | -- |
| TSS (mg/L) | -- | 5.8 | -- | 10.7 | -- | -- | -- | -- |
| Turbidity (JTU) | -- | 6.2 | -- | 15 | -- | -- | -- | -- |
| Turbidity (NTU) | -- | -- | -- | -- | -- | -- | 5.5 | -- |
| Mg (mg/L) | -- | 7.1 | -- | -- | -- | -- | -- | -- |
| SO4 (mg/L) | -- | 65 | -- | 106 | -- | 70 | 100 | -- |
| SO4 Load (kg/d) | -- | -- | -- | -- | -- | 2,630 | -- | -- |
| Alk (mg/L CaCO3) | -- | 63 | -- | -- | -- | -- | -- | -- |
| F (mg/L) | -- | 0.27 | -- | -- | -- | 0.29 | -- | -- |
| Al_t (mg/L) | -- | -- | -- | -- | -- | -- | -- | -- |
| Al_d (mg/L) | -- | <0.5 | -- | -- | -- | -- | -- | -- |
| Al_s (mg/L) | -- | -- | -- | -- | -- | -- | -- | -- |
| Cu (mg/L) | -- | -- | -- | -- | -- | -- | -- | -- |
| Fe (mg/L) | -- | <0.2 | -- | -- | -- | -- | -- | -- |
| Mo (mg/L) | -- | -- | -- | -- | -- | -- | -- | -- |
| Mn (mg/L) | -- | <0.2 | -- | -- | -- | -- | -- | -- |
| Zn (mg/L) | -- | <0.25 | -- | -- | -- | -- | -- | -- |
| Station Identifier | 6A | 6A | 6A | 6A | 6A | 6 | 6 | 6 |
| Station Number | 39800 | 39800 | 39800 | 39800 | 39800 | 42200 | 42200 | 42200 |
| Date (mm/dd/yy) | 10/13/99 | 3/15/00 | 9/6/00 | 11/3/00 | 2/20/01 | 11/4/65 | 11/4/70 | 11/29/88 |
| Avg Daily Disch (ft3/s) | -- | 11.4 | 9.27 | 10.1 | 6.13 | 17 | 12.7 | -- |
| pH field (SU) | -- | 7.4 | 7.7 | 7.7 | 7.9 | 7.4 | 7.2 | 7.7 |
| pH lab (SU) | 7.64 | -- | -- | -- | -- | -- | -- | -- |
| SC field (µS/cm) | 271 | 330 | 310 | 305 | 354 | 237 | 255 | -- |
| SC lab (µS/cm) | -- | -- | -- | -- | -- | -- | -- | -- |
| TDS (mg/L) | -- | -- | -- | -- | -- | 165 | 193 | 149 |
| TSS (mg/L) | -- | -- | -- | -- | -- | 8 | 0 | 17.8 |
| Turbidity (JTU) | -- | -- | -- | -- | -- | 2.3 | 4.5 | 8 |
| Turbidity (NTU) | -- | -- | -- | -- | -- | -- | -- | -- |
| Mg (mg/L) | -- | 10 | -- | -- | -- | -- | -- | -- |
| SO4 (mg/L) | 74 | 98 | 104 | 89 | -- | 47 | 60 | 46 |
| SO4 Load (kg/d) | -- | 2,730 | -- | 2,200 | -- | 1,960 | 1,860 | -- |
| Alk (mg/L CaCO3) | -- | -- | -- | 64 | -- | 62 | 60 | 62 |
| F (mg/L) | -- | 0.4 | -- | -- | -- | -- | -- | 0.5 |
| Al_t (mg/L) | -- | 0.96 | -- | -- | -- | -- | -- | 3 |
| Al_d (mg/L) | -- | <0.1 | -- | -- | -- | -- | -- | 1.8 |
| Al_s (mg/L) | -- | -- | -- | -- | -- | -- | -- | 1.2 |
| Cu (mg/L) | -- | -- | -- | -- | -- | -- | -- | -- |
| Fe (mg/L) | -- | -- | -- | -- | -- | <0.02 | 0.12 | 0.64 |
| Mo (mg/L) | -- | -- | -- | -- | -- | -- | -- | -- |
| Mn (mg/L) | -- | 0.2 | -- | -- | -- | -- | -- | 0.18 |
| Zn (mg/L) | -- | 0.039 | -- | -- | -- | <1 | <0.01 | 0.04 |
| Station Identifier | 7 | 7 | 7 | 7 | 7 | 7 | 7 | 7 |
| Station Number | 33200 | 33200 | 33200 | 33200 | 33200 | 33200 | -- | 33200 |
| Date (mm/dd/yy) | 11/29/88 | 10/22/92 | 2/16/93 | 11/10/93 | 2/11/94 | 10/13/94 | 11/7/94 | 2/14/95 |
| Avg Daily Disch (ft3/s) | -- | -- | -- | -- | -- | -- | 18 | -- |
| pH field (SU) | 7.7 | 8.19 | 7.7 | 7.5 | 7.46 | 7.6 | 6 | 8.1 |
| pH lab (SU) | -- | -- | -- | -- | -- | -- | -- | -- |
| SC field (µS/cm) | -- | 317 | 336 | 327 | 341 | 296 | 178 | 341 |
| SC lab (µS/cm) | -- | -- | -- | -- | -- | -- | -- | -- |
| TDS (mg/L) | 163 | 184 | 230 | 198 | 250 | 228 | 220 | 262 |
| TSS (mg/L) | 33.7 | 6 | 8 | 2 | 6 | 8.7 | 9 | 8 |
| Turbidity (JTU) | 10 | 4 | -- | -- | -- | -- | -- | -- |
| Turbidity (NTU) | -- | -- | -- | -- | -- | -- | -- | -- |
| Mg (mg/L) | -- | -- | -- | -- | -- | -- | 8.22 | -- |
| SO4 (mg/L) | 65 | 85 | 113 | 80 | 103 | 93 | 74 | 103 |
| SO4 Load (kg/d) | -- | -- | -- | -- | -- | -- | 3260 | -- |
| Alk (mg/L CaCO3) | 55 | 62 | 49 | 66 | 54 | 70 | 58 | 58 |
| F (mg/L) | 0.5 | 0.358 | 0.37 | 0.368 | 0.43 | 0.6 | -- | 0.48 |
| Al_t (mg/L) | 4.1 | 1.6 | 2.5 | 2.3 | 2.5 | 1.25 | 1.07 | 1.18 |
| Al_d (mg/L) | 1.8 | 0.7 | 0.5 | 1.2 | 0.5 | 0.5 | 0.115 | 0.08 |
| Al_s (mg/L) | 2.3 | 0.9 | 2 | 1.1 | 2 | 0.75 | -- | 1.1 |
| Cu (mg/L) | -- | -- | -- | -- | -- | -- | -- | -- |
| Fe (mg/L) | 1.48 | 0.31 | 0.442 | 0.78 | 0.48 | 0.342 | 0.394 | 0.306 |
| Mo (mg/L) | -- | -- | -- | -- | -- | -- | -- | -- |
| Mn (mg/L) | 0.23 | 0.21 | 0.274 | 0.237 | 0.36 | 0.143 | 0.208 | 0.175 |
| Zn (mg/L) | 0.08 | 0.071 | 0.083 | 0.1 | 0.107 | 0.051 | 0.069 | 0.088 |
| Station Identifier | 7 | 7 | 7 | 7 | 7 | 7 | 7 | 7 |
| Station Number | 33200 | 33200 | 33200 | 33200 | 33200 | 33200 | 33200 | 33200 |
| Date (mm/dd/yy) | 11/9/95 | 2/26/96 | 11/5/96 | 3/13/97 | 7/21/97 | 9/9/97 | 11/3/97 | 3/9/98 |
| Avg Daily Disch (ft3/s) | -- | -- | -- | -- | -- | -- | -- | -- |
| pH field (SU) | 8.1 | 7.8 | 7.4 | 7.4 | 8.7 | 8.1 | 7.4 | 7.8 |
| pH lab (SU) | 7.9 | -- | 7.94 | 7.83 | 8 | 7.76 | 7.77 | 7.51 |
| SC field (µS/cm) | 294 | 335 | 331 | 346 | 224 | 262 | 306 | 353 |
| SC lab (µS/cm) | 289 | -- | 316 | 346 | 219 | 259 | 291 | 333 |
| TDS (mg/L) | 208 | -- | -- | -- | -- | 185 | -- | -- |
| TSS (mg/L) | 2.8 | -- | -- | -- | -- | 9.4 | -- | 13.8 |
| Turbidity (JTU) | 2.46 | -- | -- | 7.6 | 1.2 | 6.9 | -- | 16 |
| Turbidity (NTU) | -- | -- | -- | -- | -- | -- | -- | -- |
| Mg (mg/L) | 6 | 10.9 | 9.9 | 9.4 | 6.1 | 7.2 | 9.1 | 10.3 |
| SO4 (mg/L) | 83 | 102 | 96 | 102 | 40 | 74 | 94 | 112 |
| SO4 Load (kg/d) | -- | -- | -- | -- | -- | -- | -- | -- |
| Alk (mg/L CaCO3) | 66 | -- | -- | -- | 65 | 57 | -- | -- |
| F (mg/L) | 0.3 | 0.407 | -- | -- | -- | 0.28 | 0.4 | 0.46 |
| Al_t (mg/L) | 2.13 | 1.7 | 1.1 | 1.3 | 0.46 | -- | 0.5 | 2 |
| Al_d (mg/L) | 0.127 | -- | -- | -- | -- | <0.5 | -- | -- |
| Al_s (mg/L) | 2 | -- | -- | -- | -- | -- | -- | -- |
| Cu (mg/L) | -- | -- | -- | -- | -- | -- | -- | -- |
| Fe (mg/L) | 0.281 | -- | -- | -- | -- | <0.2 | -- | -- |
| Mo (mg/L) | -- | -- | -- | -- | -- | -- | -- | -- |
| Mn (mg/L) | 0.16 | 0.155 | 0.2 | 0.26 | 0.079 | <0.2 | <0.2 | 0.3 |
| Zn (mg/L) | 0.09 | 0.056 | <0.09 | <0.09 | 0.04 | <0.25 | <0.25 | <0.25 |
| Station Identifier | 6 | 6 | 6 | 6 | 6 | 6 | 6 | 6 |
| Station Number | 42200 | 42200 | 42200 | 42200 | 42200 | 42200 | 42200 | 42200 |
| Date (mm/dd/yy) | 11/10/93 | 2/11/94 | 10/13/94 | 2/14/95 | 11/9/95 | 2/26/96 | 11/5/96 | 3/13/97 |
| Avg Daily Disch (ft3/s) | -- | -- | -- | -- | -- | -- | -- | -- |
| pH field (SU) | 7.46 | 7.62 | 7.4 | 8.1 | 8.1 | 7.9 | 6.35 | 7.2 |
| pH lab (SU) | -- | -- | -- | -- | 7.9 | -- | 7.7 | 7.72 |
| SC field (µS/cm) | 304 | 279 | 271 | 306 | 261 | 297 | 298 | 318 |
| SC lab (µS/cm) | -- | -- | -- | -- | 260 | -- | 291 | 319 |
| TDS (mg/L) | 164 | 204 | 212 | 224 | 180 | -- | -- | -- |
| TSS (mg/L) | 7 | 5 | 5.3 | 6.5 | -- | -- | -- | -- |
| Turbidity (JTU) | -- | -- | -- | -- | 1.71 | -- | -- | 72 |
| Turbidity (NTU) | -- | -- | -- | -- | -- | -- | -- | -- |
| Mg (mg/L) | -- | -- | -- | -- | 5 | 9.7 | 8.5 | 8.8 |
| SO4 (mg/L) | 71 | 74 | 68 | 80 | 63 | 75 | 76 | 88 |
| SO4 Load (kg/d) | -- | -- | -- | -- | -- | -- | -- | -- |
| Alk (mg/L CaCO3) | 63 | 61 | 68 | 68 | 73 | -- | -- | -- |
| F (mg/L) | 0.3 | 0.33 | 0.5 | 0.374 | 0.3 | 0.322 | -- | -- |
| Al_t (mg/L) | 1.15 | 5.5 | 1 | 0.39 | 0.65 | 0.7 | 0.7 | 1.9 |
| Al_d (mg/L) | 0.5 | 0.5 | 0.5 | 0.07 | 0.05 | -- | -- | -- |
| Al_s (mg/L) | 0.65 | 5 | 0.5 | 0.32 | 0.6 | -- | -- | -- |
| Cu (mg/L) | -- | -- | -- | -- | -- | -- | -- | -- |
| Fe (mg/L) | 1.02 | 0.63 | 0.234 | 0.323 | 0.406 | -- | -- | -- |
| Mo (mg/L) | -- | -- | -- | -- | -- | -- | -- | -- |
| Mn (mg/L) | 0.164 | 0.29 | 0.055 | 0.091 | 0.1 | 0.083 | 0.1 | 0.2 |
| Zn (mg/L) | 0.052 | 0.046 | 0.035 | 0.074 | 0.07 | 0.029 | <0.09 | <0.09 |
| Station Identifier | 6 | 6 | 6 | 6 | 6 | 6 | 6 | 6 |
| Station Number | 42200 | 42200 | 42200 | 42200 | 42200 | 42200 | 42200 | 42200 |
| Date (mm/dd/yy) | 7/21/97 | 9/9/97 | 11/3/97 | 3/9/98 | 4/30/98 | 10/20/98 | 2/25/99 | 9/27/99 |
| Avg Daily Disch (ft3/s) | -- | -- | -- | -- | -- | -- | -- | -- |
| pH field (SU) | 8.2 | 8.2 | -- | 7.8 | 7.4 | 8.2 | 8.3 | -- |
| pH lab (SU) | -- | -- | -- | -- | 7.52 | -- | -- | -- |
| SC field (µS/cm) | 211 | 241 | -- | 332 | 209 | 256 | 294 | -- |
| SC lab (µS/cm) | -- | -- | -- | 313 | 205 | -- | -- | -- |
| TDS (mg/L) | -- | -- | -- | -- | -- | -- | -- | -- |
| TSS (mg/L) | -- | -- | -- | 2.6 | -- | -- | -- | -- |
| Turbidity (JTU) | -- | -- | -- | 14 | -- | -- | -- | -- |
| Turbidity (NTU) | -- | -- | -- | -- | -- | -- | 4.7 | -- |
| Mg (mg/L) | -- | -- | -- | -- | -- | -- | -- | -- |
| SO4 (mg/L) | -- | -- | -- | 90 | 44 | 54 | 70 | -- |
| SO4 Load (kg/d) | -- | -- | -- | -- | -- | -- | -- | -- |
| Alk (mg/L CaCO3) | -- | -- | -- | -- | -- | -- | -- | -- |
| F (mg/L) | -- | -- | -- | -- | -- | 0.25 | -- | -- |
| Al_t (mg/L) | -- | -- | -- | -- | -- | -- | -- | -- |
| Al_d (mg/L) | -- | -- | -- | -- | -- | -- | -- | -- |
| Al_s (mg/L) | -- | -- | -- | -- | -- | -- | -- | -- |
| Cu (mg/L) | -- | -- | -- | -- | -- | -- | -- | -- |
| Fe (mg/L) | -- | -- | -- | -- | -- | -- | -- | -- |
| Mo (mg/L) | -- | -- | -- | -- | -- | -- | -- | -- |
| Mn (mg/L) | -- | -- | -- | -- | -- | -- | -- | -- |
| Zn (mg/L) | -- | -- | -- | -- | -- | -- | -- | -- |
| Station Identifier | 6 | 6 | 6 | 6 | 6 | 6 | 6 | 6 |
| Station Number | 42200 | 42200 | 42200 | 42200 | 42200 | 42400 | 42400 | -- |
| Date (mm/dd/yy) | 10/13/99 | 3/15/00 | 9/6/00 | 11/3/00 | 2/20/01 | 10/22/92 | 2/16/93 | 11/7/94 |
| Avg Daily Disch (ft3/s) | -- | -- | -- | -- | -- | -- | -- | -- |
| pH field (SU) | -- | -- | 8.3 | 8.2 | -- | 8.23 | 7.6 | 6 |
| pH lab (SU) | 8.12 | -- | -- | -- | -- | -- | -- | -- |
| SC field (µS/cm) | 248 | -- | 282 | 280 | -- | 286 | 305 | 160 |
| SC lab (µS/cm) | -- | -- | -- | -- | -- | -- | -- | -- |
| TDS (mg/L) | -- | -- | -- | -- | -- | 176 | 200 | 206 |
| TSS (mg/L) | -- | -- | -- | -- | -- | 4.7 | 6 | 6 |
| Turbidity (JTU) | -- | -- | -- | -- | -- | 4 | -- | -- |
| Turbidity (NTU) | -- | -- | -- | -- | -- | -- | -- | -- |
| Mg (mg/L) | -- | -- | -- | -- | -- | -- | -- | 7.24 |
| SO4 (mg/L) | 58 | -- | 80 | 70 | -- | 66 | 86 | 59 |
| SO4 Load (kg/d) | -- | -- | -- | -- | -- | -- | -- | -- |
| Alk (mg/L CaCO3) | -- | -- | -- | 66 | -- | 72 | 46 | 62 |
| F (mg/L) | -- | -- | -- | -- | -- | 0.268 | 0.32 | -- |
| Al_t (mg/L) | -- | -- | -- | -- | -- | 0.89 | 1.33 | 0.612 |
| Al_d (mg/L) | -- | -- | -- | -- | -- | 0.5 | 0.5 | 0.0484 |
| Al_s (mg/L) | -- | -- | -- | -- | -- | 0.39 | 0.83 | -- |
| Cu (mg/L) | -- | -- | -- | -- | -- | -- | -- | -- |
| Fe (mg/L) | -- | -- | -- | -- | -- | 0.359 | 0.467 | 0.376 |
| Mo (mg/L) | -- | -- | -- | -- | -- | -- | -- | -- |
| Mn (mg/L) | -- | -- | -- | -- | -- | 0.126 | 0.179 | 0.138 |
| Zn (mg/L) | -- | -- | -- | -- | -- | 0.053 | 0.041 | 0.0487 |
| Station Identifier | MP8 | MP8 | MP8 | MP8 | MP8 | MP8 | MP8 | MP8 |
| Station Number | -- | -- | -- | -- | -- | -- | -- | -- |
| Date (mm/dd/yy) | 6/10/97 | 7/17/97 | 8/14/97 | 9/18/97 | 10/23/97 | 11/20/97 | 12/19/97 | 1/14/98 |
| Avg Daily Disch (ft3/s) | -- | -- | -- | -- | -- | -- | -- | -- |
| pH field (SU) | 7.96 | 8.37 | 8.2 | 7.93 | 7.79 | 7.99 | 7.85 | 7.95 |
| pH lab (SU) | -- | -- | -- | -- | -- | -- | -- | -- |
| SC field (µS/cm) | 33 | -- | 50 | 251 | 32 | 286 | 78 | 321 |
| SC lab (µS/cm) | -- | -- | -- | -- | -- | -- | -- | -- |
| TDS (mg/L) | -- | -- | -- | -- | -- | -- | -- | -- |
| TSS (mg/L) | -- | -- | -- | -- | -- | -- | -- | -- |
| Turbidity (JTU) | -- | -- | -- | -- | -- | -- | -- | -- |
| Turbidity (NTU) | -- | -- | -- | -- | -- | -- | -- | -- |
| Mg (mg/L) | 3.3 | 5.7 | 5.9 | 7.7 | 10.8 | 8.2 | 10.1 | 9.4 |
| SO4 (mg/L) | 22.6 | 53.3 | 51.7 | 75.6 | 76.8 | 76.6 | 84 | 96.9 |
| SO4 Load (kg/d) | -- | -- | -- | -- | -- | -- | -- | -- |
| Alk (mg/L CaCO3) | 60.5 | 55.5 | 60 | 58.5 | 54.7 | 62.5 | 45 | 55.8 |
| F (mg/L) | 0.1 | -- | 0.2 | -- | 0.5 | 0.3 | -- | 1.3 |
| Al_t (mg/L) | -- | 0.3 | -- | -- | 0.78 | -- | -- | 1.6 |
| Al_d (mg/L) | <0.15 | 0.19 | 0.23 | 0.15 | 0.17 | <0.15 | <0.15 | 0.17 |
| Al_s (mg/L) | -- | -- | -- | -- | -- | -- | -- | -- |
| Cu (mg/L) | -- | -- | -- | -- | -- | -- | -- | -- |
| Fe (mg/L) | -- | 0.2 | -- | -- | <0.02 | -- | -- | 2.36 |
| Mo (mg/L) | -- | -- | -- | -- | -- | -- | -- | -- |
| Mn (mg/L) | -- | <0.1 | -- | -- | 0.13 | -- | -- | 0.245 |
| Zn (mg/L) | -- | 0.013 | -- | -- | 0.031 | -- | -- | 0.069 |
| Station Identifier | MP8 | MP8 | MP8 | MP8 | MP8 | |||
| Station Number | -- | -- | -- | -- | -- | |||
| Date (mm/dd/yy) | 2/20/98 | 3/19/98 | 4/30/98 | 6/4/98 | 7/16/98 | |||
| Avg Daily Disch (ft3/s) | -- | -- | -- | -- | -- | |||
| pH field (SU) | 8.03 | 7.7 | 7.94 | 7.69 | 7.88 | |||
| pH lab (SU) | -- | -- | -- | -- | -- | |||
| SC field (µS/cm) | 60 | 52 | 54 | 45 | -- | |||
| SC lab (µS/cm) | -- | -- | -- | -- | -- | |||
| TDS (mg/L) | -- | -- | -- | -- | -- | |||
| TSS (mg/L) | -- | -- | -- | -- | -- | |||
| Turbidity (JTU) | -- | -- | -- | -- | -- | |||
| Turbidity (NTU) | -- | -- | -- | -- | -- | |||
| Mg (mg/L) | 12.2 | 10.6 | 5.9 | 4 | 5.3 | |||
| SO4 (mg/L) | 103 | 92.8 | 53.1 | 26.1 | 43.1 | |||
| SO4 Load (kg/d) | -- | -- | -- | -- | -- | |||
| Alk (mg/L CaCO3) | 42 | 57 | 50 | 58.5 | 54.3 | |||
| F (mg/L) | 0.7 | 0.5 | 1.1 | 0.1 | 0.5 | |||
| Al_t (mg/L) | -- | -- | 1.5 | -- | 0.63 | |||
| Al_d (mg/L) | <0.15 | <0.15 | <0.15 | <0.15 | <0.15 | |||
| Al_s (mg/L) | -- | -- | -- | -- | -- | |||
| Cu (mg/L) | -- | -- | -- | -- | -- | |||
| Fe (mg/L) | -- | -- | 1.05 | -- | 0.802 | |||
| Mo (mg/L) | -- | -- | -- | -- | -- | |||
| Mn (mg/L) | -- | -- | <0.1 | -- | <0.1 | |||
| Zn (mg/L) | -- | -- | 0.043 | -- | 0.025 |
Vail Engineering, Inc. (2000) and URS (2001, based on Vail Engineering, Inc., 2000) address changes in water quality over time in the Red River. The authors of these reports stated that concentration changes in the Red River downstream from the mine, over time, are related in part to changes in the amount of precipitation over time. They ascribed the lower sulfate concentrations from 1965 to the early 1970's to lower precipitation from the early 1950's to the middle 1960's and consequent lower loadings to the Red River. Vail Engineering, Inc. (2000) stated that the good water quality in the 1965 survey reflected the large amounts of rainfall in July and September, which resulted in an above average November flow, and that runoff conditions in 1965 and 1970 were similar. Conversely, they attributed the higher concentrations in the 1980's and 1990's partly to increased precipitation from 1978 to 1993 and the resulting increase in loadings from hydrothermal scar areas upstream from the mine site. They also ascribed the concentrations changes in the 1980's and 1990's to changes in mining practices, especially cessation of pumping from the Red River.
To test the hypothesis that changes in concentrations are related to the amount of precipitation, discharge records were consulted for this time period (U.S. Geological Survey, 2003a), and the relationship between sulfate concentration and discharge also was examined. URS (2001) and Vail Engineering, Inc. (2000) stated that drought conditions existed from 1950 to 1968, based on 15 percent below normal precipitation during this period and 15 percent lower than average stream discharge from 1953 to 1964 at the town of Red River. However, average mean annual streamflow at the Questa Ranger Station gage from 1955 to 1965 was 41.7 cubic feet per second (ft3/s), which is close to the average mean annual streamflow from 1924 to 2001 (47.1 ft3/s).
Although Vail (2000) seems to state that flows were higher during the 1965 sampling, streamflows at the Questa Ranger Station gage on the 1965 sampling dates (November 3 through 8) were 25 to 26 ft3/s. Both the November 1965 and the November 1970 sampling events took place during normal low-flow conditions and were not associated with storm events. The ensuing ten-year period (1965 to 1975) did have a lower average mean annual streamflow (33.7 ft3/s) compared to the 1955-to-1965 period. The discharge records would indicate that the 1955-65 period was near normal precipitation and flow, whereas the next ten-year period was well below normal. From 1978 to 1993, the average mean annual streamflow was higher (51.3 ft3/s) than the 1924 to 2001 long-term average, as stated by URS (2001) and Vail Engineering, Inc. (2000).
The relationship between discharge and solute concentrations is different depending on whether one considers long-term climatic trends or short-term episodic events. Although increases in precipitation can produce increases in acid drainage for short time periods, data evaluated for this report indicate that increased flows have a diluting effect on solute concentrations in the Red River most of the time. The hypothesis presented in previous reports (Vail Engineering, Inc., 2000; URS, 2001) that increased rainfall can increase solute concentrations can be tested by observing the relationship between discharge, as a surrogate of rainfall, and sulfate concentrations, as shown in figures 4 and 5. The time period with the best continuous temporal coverage, 1977–1979, shows a strong trend of increasing sulfate concentrations with decreasing flow (fig. 4); this same trend is seen in figure 5 when all available historical data are plotted. Under low flow conditions, sulfate concentrations are generally higher (60–140 mg/L), but considerable dilution takes place during higher flows, bringing the sulfate concentrations to well below 60 mg/L. The lowest sulfate concentrations correspond to peak flows when stream water is most diluted with low-sulfate waters.
High-sulfate concentrations were similar during low-flow times in different water years, while the lowest annual sulfate concentrations varied depending on the magnitude of peak flow for that year. As shown in figure 4, sulfate concentrations measured during peak snowmelt were highest in 1977, which had the lowest peak discharge on record, and lowest in 1979, which had the highest snowmelt-related discharge on record at the Questa Ranger Station gage for this time period.
Although most of the sulfate concentrations reported during dynamic hydrologic conditions (snowmelt and storms) were lower than low-flow concentrations (fig. 4), a number of samples collected during summer thunderstorm and rising limb conditions had sulfate concentrations equal to or higher than low-flow concentrations (fig. 5). The two highest concentrations were from samples collected during the rising limb of summer thunderstorm events (July 18, 2000, at 350 mg/L and July 26, 1988, at 278 mg/L; fig. 6). Two rising limb samples with elevated sulfate concentrations were collected on March 25, 1992 and March 13, 1997; sulfate concentrations were 175 and 148 mg/L, respectively (fig. 6). When flows first begin to increase in the spring, the first flush of sulfide oxidation products from scar and mine-disturbed areas reach the Red River and are not yet diluted by waters of lower TDS concentrations that are present as snowmelt increases. The high-concentration storm-event samples may reflect flushing of pyrite oxidation products such as gypsum or evaporated unsaturated zone waters from scars and mined areas during summer thunderstorm events. The higher sulfate concentrations for these four samples and the distribution of temporal sulfate concentrations shown in figure 6 indicate that the highest sulfate concentrations can be expected to occur early in snowmelt runoff and during summer storm events. However, very few historical water-quality samples were collected on the Red River under these hydrologic conditions (table 6). Recent data from a summer thunderstorm event on the Red River corroborates this theory (Philip Verplanck, USGS, unpublished data, 2002). The source of the elevated sulfate could be mine materials or mineralized catchments with hydrothermal scars.
By grouping samples by hydrologic condition (hydrologic discrimination) (see table 6), historic sulfate concentrations from 1965 to 2001 were plotted against time in figure 6. A time line of relevant mining activities at the Molycorp, Inc. Mine also is included in figure 6. A trend of increasing sulfate concentrations over time, potentially related to mining inputs, is apparent when the dynamic events of snowmelt and summer rainstorm are eliminated and only low-flow concentrations are considered. Without using hydrologic discrimination, the trend is obscured by dilution during periods of transient flow. Sulfate concentrations during low-flow conditions increased from sometime during 1971–77 to late 1992, more than doubling from approximately 60 mg/L in 1965 and 1971 to almost 200 mg/L in 1992 and 1993. The steady increase in sulfate concentrations during this time does not correspond well to on-again, off-again pumping through the 1980's and the resumption of spring discharge to the Red River, as suggested by Vail Engineering, Inc. (2000) and URS (2001).
After 1993, a possible trend of decreasing sulfate concentrations during low-flow conditions is evident in figure 6. The more recent decrease in sulfate concentration may be related to restarting the mine and the pumping of alluvial groundwater, as shown on the time line in figure 6, and as suggested by URS (2001). Alluvial wells from the Red River in the vicinity of the mine were pumped starting in the early 1990's for make-up water for the mill. Alluvial ground water along the Red River generally has higher sulfate concentrations than does surface water (LoVetere and others, 2003). By decreasing the amount of alluvial ground water entering the Red River at the mine site, concentrations of sulfate and other constituents downstream in the Red River could decrease if volumes were large enough to produce a detectable difference in constituent concentrations in the river. In addition, flow of Capulin Gulch water to the Red River was captured beginning in 1993. Removal of this high-sulfate water input (the sulfate concentration in Capulin Canyon on November 9, 1995 was 1,270 mg/L; Vail Engineering, Inc., 2002, and Woodward-Clyde Consultants, 1996a and b) to the Red River also could decrease sulfate concentrations at the Questa Ranger Station gage.
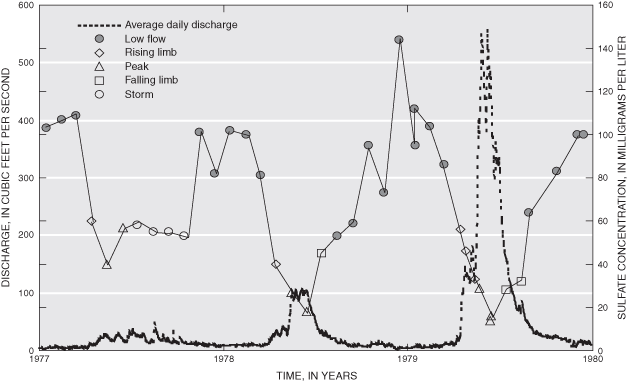
A small number of samples was collected upstream from the Molycorp, Inc. facilities and downstream from natural scar areas (see table 5). Sulfate concentrations from five stations downstream from Hansen Creek and upstream from the mill (Stations 6, 6A, 7, MP8, and upstream Moly property line; fig. 1) are shown in figure 7. Figure 7 shows data only for times when sulfate concentrations were measured in samples collected on the same date both upstream from the mine and at the Questa Ranger Station gage. Results from only two sample dates were available from this area before 1971, and no samples were collected between November 1970 and September 1988. As shown in figure 7, sulfate concentrations at the Questa Ranger Station gage from 1988 to 2001 were consistently higher than those from the upstream locations, usually by a factor of two. Vail Engineering, Inc. (2000) selected four low-flow sampling dates upstream from the mine from 1994 through 1997 and compared sulfate concentrations from those dates (83 to 93 mg/L) to the sulfate concentrations in 1965 and 1970 (47 and 60 mg/L). This comparison was used to demonstrate that sulfate concentrations upstream from the mine were lower in 1965 and 1970 compared to values from more recent dates. Although there is a marked paucity of data before 1988 upstream from the mine area, no trend of increasing concentrations over the 35-year time period is apparent in the upstream samples when all historical water-quality samples are evaluated (fig. 7). Indeed, sulfate concentrations upstream from the mine site during the 1990's (approximately 25 to 110 mg/L) are in the same range as concentrations at the Questa Ranger Station gage from 1965 to 1975. In contrast, there does appear to be a trend of increasing sulfate concentrations at the Questa Ranger Station gage, as discussed above and shown in figure 6. The cause of the higher downstream concentrations from 1988 to 2001 could be mining activities, but the chemical changes are small relative to the scatter in the data.
Sulfate loads in the Red River upstream and downstream from the mine are shown in figures 8 and 9. Sulfate loads, in kilograms per day (kg/d), were calculated using the following equation:
sulfate load = (Q)(C)(2.447) (1)
where Q is average daily discharge in ft3/s, C is sulfate concentration in mg/L, and 2.447 is the conversion factor. Figure 8 shows sulfate load data for all sample dates at the Questa Ranger Station gage, with hydrologic discrimination, and figure 9 shows sulfate loads both upstream from the mine (five stations) and at the Questa Ranger Station gage, only for those times when flow and sulfate were measured at both locations (with the exception of one date upstream from the mine, November 7, 1994, used to show trends in sulfate load over time upstream from the mine). Few flows were measured when upstream samples were collected because a gage is not located in this reach between Hansen Creek and the mill. Sulfate loads at the Questa Ranger Station gage were highest during times of higher flows (rising limb, peak, and falling limb times) and during summer thunderstorms, with the highest sulfate load measured during a storm event on September 13, 1988 (fig. 8). Although there were only two sample dates when both sulfate concentration and flow were measured before 1971, sulfate loads upstream from the mine at these times were similar to those measured from the late 1980's to 2001 (fig. 9). In contrast, sulfate loads at the Questa Ranger Station gage during low flow followed trends seen in sulfate concentration (see fig. 6), with increasing sulfate loads between 1980 and 1993, then decreasing sulfate loads between 1993 and 2001 (fig. 8). With the exception of November 4, 1970, when loads upstream from the mine and at the Questa Ranger Station gage were similar, sulfate loads at the Questa Ranger Station gage were consistently higher than loads upstream from the mine (fig. 9). Differences between sulfate loads upstream and downstream from the mine were highest in the late 1980's (on October 25, 1988—a low-flow sampling event). Sulfate loads both upstream and downstream from the mine appeared to decrease from 1999 to 2001 (fig. 9). Inputs of sulfate between the mill and the Questa Ranger Station are largely limited to the mine area and would include both natural (scar-related) and mining sources. However, differences in concentration and load trends over time at the Questa Ranger Station gage and upstream from the mine suggest that differences in sulfate loads and concentrations between the two locations may be related to mining activities.
One check on the validity of the sulfate data is the correlation between sulfate and other parameters controlled by sulfate concentrations in areas with pyrite and gypsum, for example, specific conductance and TDS. In addition, for some sampling dates specific conductance values are available when sulfate was not determined, and conductance is an easier measurement than sulfate because no wet chemistry preparation is necessary. No specific conductance values were available from November 1970 to January 1988. In streams draining pyrite and/or gypsum-containing areas, sulfate and specific conductance and TDS should be highly correlated. The mine and the scar areas do contain abundant gypsum from alteration of pyrite and calcite (Robertson GeoConsultants, Inc. 2000c). Figure 10 shows the relationship between sulfate concentrations and field specific conductance at the Questa Ranger Station gage for all sample dates. The correlation between sulfate and specific conductance is reasonably good (correlation coefficient [R2] = 0.64), indicating that the sulfate values are reasonable.
There is more continuous coverage of TDS data than specific conductance data, and TDS provides another check on changing solute trends in samples collected at the Questa Ranger Station gage and the validity of the sulfate data. Because sulfate is almost always the major anion in the Red River and is commonly present in concentrations substantially higher than any other anion, it should approximate as much as half of the milliequivalents in the charge balance and should also approximate up to half of the TDS. Figure 11 shows that the sulfate concentrations are between 25 to 50 percent of the TDS values. Two outliers are immediately apparent in the plot of sulfate and TDS, and both are summer thunderstorm events from 1988, as shown in figure 11. The storm event on September 13, 1988 had a sulfate concentration that is well within the range of other values. For this sample, it is likely that the TDS measurement is in error. The other sample, collected on July 26, 1988, has the highest measured sulfate concentration in the historical data set. For this sample, sulfate and/or TDS may be in error. A recent sample collected on the Red River at the Questa Ranger Station gage during a summer thunderstorm event had a sulfate concentration of 315 mg/L (McCleskey and Verplanck, U.S. Geological Survey, unpublished data, 2003), suggesting that the sulfate concentration for the July 26, 1988 sample is correct and the TDS value is in error. When these two outliers are removed, the correlation between TDS and sulfate is better than that between specific conductance and sulfate. Figure 12 shows the trend between TDS and sulfate for all sample dates, except the two outliers. The R2 value for the linear correlation is 0.83, indicating that TDS and sulfate are highly correlated and that the sulfate values are acceptable.
Figure 7. Sulfate concentrations in the Red River upstream and downstream from the mine site.
Figure 9. Sulfate loads in the Red River upstream and downstream from the mine site.
Another analyte that should correlate with sulfate in the Red River Valley is calcium. Most ground water in the alluvial aquifer along the Red River is calcium-sulfate type water (LoVetere and others, 2004), and gypsum dissolution exerts a strong control on both calcium and sulfate concentrations in surface water and ground water in the area. Samples with both calcium and sulfate measurements were few; however, a trend between calcium and sulfate concentrations is apparent in figure 13. The data points follow the gypsum congruent dissolution line (Ca:SO4 molar ratio equals 1; fig. 14), paralleling the line at low concentration but not at high concentration. If the only source of dissolved calcium and sulfate was the dissolution of gypsum, the values should plot on the gypsum dissolution line. If calcite dissolution (or plagioclase weathering) contributes to the water chemistry, the values should plot above the line, as several of the points do at lower sulfate concentrations. Alternatively, if pyrite oxidation contributes additional sulfate, the values would plot below the line, as shown for a number of the points at higher sulfate concentrations. The points that plot above the gypsum dissolution line are generally those from higher flow events (falling limb, peak, and rising limb) and older sampling dates, as would be expected for lower sulfate concentrations. No point plotted below the gypsum dissolution line before 1980, whereas the majority of the low-flow sampling points plotted below the line after 1980 (fig. 14). This trend indicates that the source of increasing sulfate concentrations over time is areas draining material that is higher in pyrite content. No conclusion can be drawn from these data regarding the location of this source.
The separation of sampling points according to hydrologic conditions in figure 13 suggests that during higher flow events, Red River water is diluted by calcium-carbonate waters, most likely from unmineralized Red River tributaries and areas upstream from scars. In fact, samples from the transient-flow events roughly follow the gypsum congruent dissolution line, while the low-flow samples have a trend showing relatively small variability in calcium concentration over a wide range in sulfate concentrations. It is possible that the low-flow samples reflect ground water chemistry, which is dominated by high-sulfate waters (LoVetere and others, 2003), and that the transient flow samples reflect mixtures of calcite-dominated waters from upstream with higher sulfate ground water.
Red River water had lower sulfate concentrations (see fig. 6) and Ca:SO4 molar ratios (fig. 14), reflecting greater calcite dissolution than pyrite oxidation before 1980. Samples collected between the early 1980's and the late 1990's showed increased sulfate concentrations at the Questa Ranger Station gage (see fig. 6) and decreasing Ca:SO4 molar ratios (fig. 14), suggesting that the influence of pyrite oxidation on water quality was greater during this period. Samples collected after this time showed Ca:SO4 molar ratios more similar to pre-1980's times, possibly as a result of removal of flow to the river from Capulin Gulch and alluvial ground water. However, samples collected by the U.S. Geological Survey in 2001 and 2002 plot even farther to the right on figure 13 (McCleskey and others, 2003), indicating a recent trend toward pyrite oxidation predominance over calcite dissolution.
The alkalinity values in the Red River also indicate that the river is not well buffered with respect to pH. Figure 15 plots low-flow alkalinity values upstream from the mine and at the Questa Ranger Station gage. Although there are few alkalinity data both upstream from the mine and at the Questa Ranger Station gage (no upstream samples were collected between November 1970 and September 1988), figure 15 shows that low-flow alkalinity values were consistently lower at the Questa Ranger Station gage than they were upstream from the mine (all alkalinity data at the Questa Ranger Station gage varied from 0 to 62 mg/L as calcium carbonate, with one outlier at 108 mg/L). Low-flow alkalinity values at the Questa Ranger Station gage have decreased over time, with values close to 60 mg/L as CaCO3 in 1965 and values between 20 and 50 by 1993. These low alkalinity values offer only limited buffering capacity, especially downstream from the mine. During a storm event in August 1988, alkalinity values dropped substantially both upstream and downstream from the mine (fig. 15). The drop in alkalinity at both locations indicates that natural sources, most likely scar areas, can cause short-term changes in the buffering capacity of the Red River.
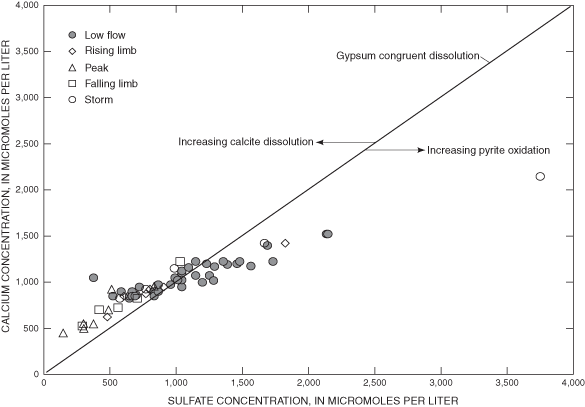
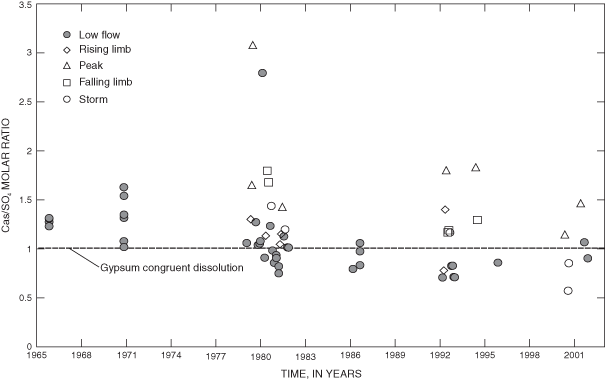

Figure 15. Alkalinity values in the Red River upstream and downstream from the mine site.
Figure 16 shows zinc concentrations in samples collected upstream from the mine and at the Questa Ranger Station gage over time (only dates when zinc concentrations were measured at both locations are shown). The concentrations shown are a combination of total and dissolved zinc values, and in some cases, no indication was given about sample filtration. No obvious trend in concentrations over time at the Questa Ranger Station gage is apparent, possibly due in part to the inability to separate dissolved and unfiltered concentrations. However, zinc concentrations downstream from the mine at the Questa Ranger Station gage are consistently higher than those on the same day upstream from the mine and downstream from scar areas, suggesting that additional zinc sources enter the river in the vicinity of the mine.
Dissolved and total zinc concentrations were measured by Garn (1985; data in USGS, 2003b) between October 1978 and December 1986. Discharge (at the time of sampling, in addition to average daily discharge from the U.S. Geological Survey streamflow-gaging station at the Questa Ranger Station), specific conductance, field pH, and other parameters also were measured by Garn during this timeframe. The frequency of zinc measurements by Garn is higher than for any other time period, and trends in zinc concentrations related to flow events can be discerned using his data. Figure 17 shows specific conductance and pH values (measured by Garn), as well as average daily discharge, from October 1978 to December 1986. Decreases in specific conductance are associated with increases in discharge. Over this time period, pH values appeared to somewhat decrease.
Two time periods from the Garn (1985) data (USGS, 2003b) are shown in more detail in figures 18 and 19. Figure 18 shows specific conductance and average daily discharge, and figure 19 shows total and dissolved zinc and average daily discharge from February 1982 through September 1984. Specific conductance values decreased during peak flows and increased throughout the low flow period (figure 18). Zinc concentrations also increased throughout the low flow period and generally peaked during rising limb times (fig. 19). Particulate (total minus dissolved) zinc was present at all times, but the highest concentration of particulate zinc (230 µg/L) from February 1982 to September 1984 was associated with the peak in zinc concentrations during the rising limb in 1983. This zinc peak also is accompanied by a decrease in alkalinity (to 28 mg/L as CaCO3). Summer thunderstorm events from other time periods also had high concentrations of particulate zinc.
Figure 20 shows total and dissolved zinc concentrations measured by Garn in 1986 (U.S. Geological Survey, 2003b). His highest measured zinc concentration (4,400 and 2,600 µg/L for total and dissolved, respectively) was measured during a summer thunderstorm on September 7, 1986. Much of the zinc measured during this thunderstorm event was present as particulate zinc. This date correlates with the rising limb of the storm, and specific conductance also peaked during the event (fig. 21). The data in figure 19 demonstrate that thunderstorm events and the rising limb of the hydrograph are associated not only with sulfate and conductivity peaks, but also with peaks in zinc concentrations.
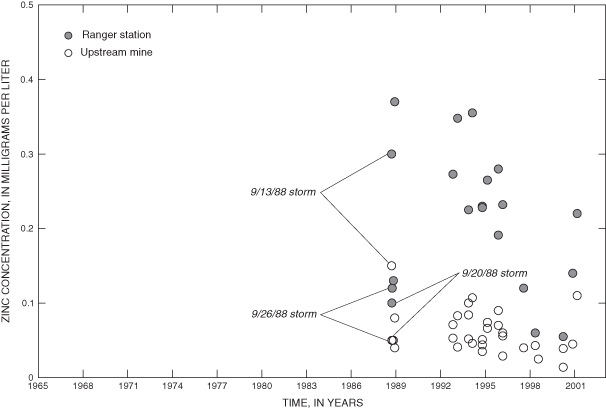
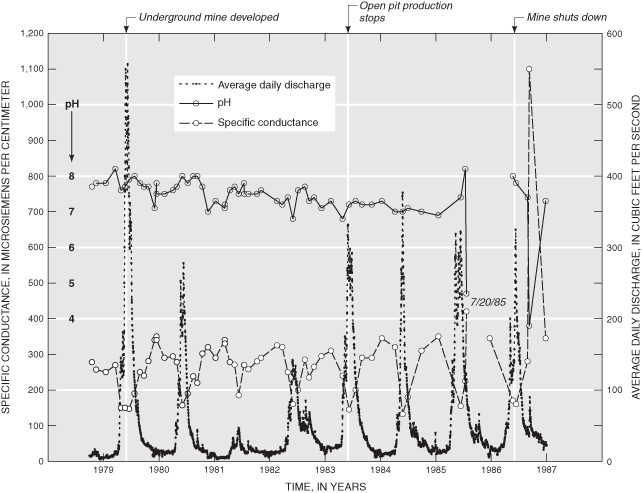
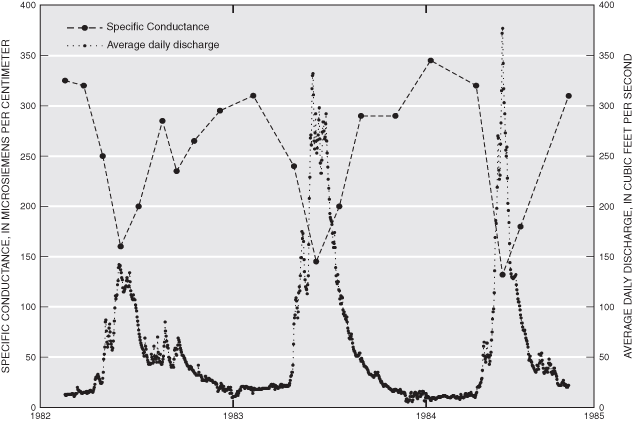
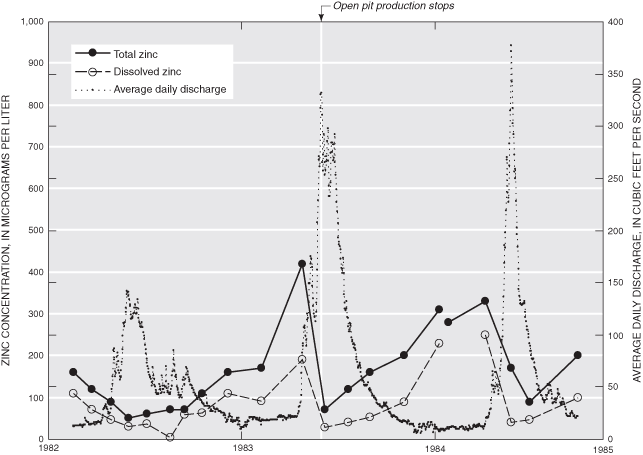
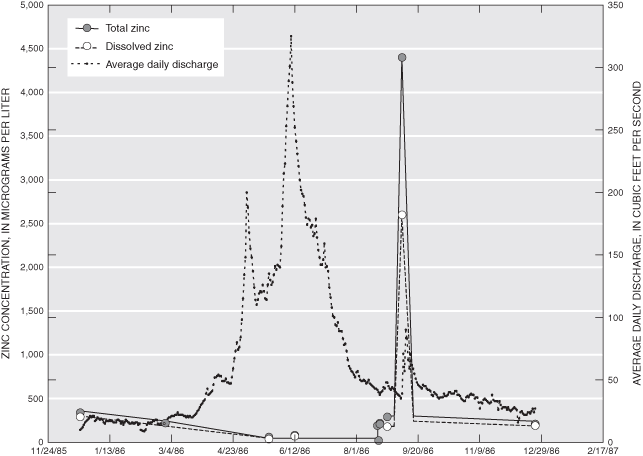
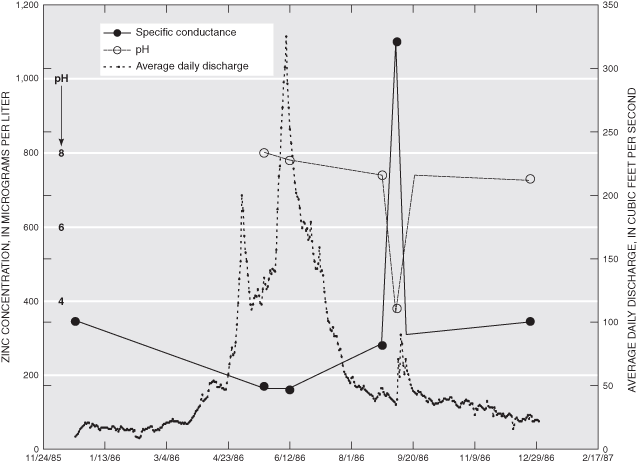
This report presents a compilation and evaluation of historical surface-water quality data for the Red River in northern New Mexico. Water-quality results from samples collected from 1965, the year open-pit mining began at the Molycorp, Inc. molybdenum mine, to 2001 were compiled. The historical surface-water data compilation has focused on the Questa Ranger Station, located approximately two km downstream from streams that drain the mine site, because of the long-term water quality and flow record at this USGS gage location. Data from locations upstream from the mine site and downstream from natural scar areas also are included. The mine area and other drainages upstream and downstream from the mine are naturally mineralized, and the USGS, in cooperation with the New Mexico Environment Department, is currently conducting a baseline and pre-mining ground-water quality investigation in the Red River Valley.
One of the main purposes of compiling and evaluating the historical surface-water quality information is to gather all the data in one document and to describe its quality. Others have compiled Red River historical water-quality data, but not all parameters were reported, a comprehensive evaluation of the methods used to collect and analyze the samples was not conducted, geochemical interpretations were not included, and/or the data were not evaluated with respect to water flow dynamics. Very few of the historical sampling efforts included sampling or quality assurance/quality control plans. Detection limits for metals and arsenic were elevated in a number of the studies compared to those for graphite furnace and inductively-coupled argon-plasma—mass spectrometry (ICP-MS) techniques and often precluded comparisons to criteria for the protection of aquatic life in the Red River. However, major- and minor-element, and in some cases trace-element data are reliable and useful for evaluating chemical, temporal, and spatial trends and for establishing an historical framework for the more recent surface-water quality data collected by the USGS.
In mineralized or mined areas, it is common to see relationships between concentrations and flow, or between concentrations and changes in hydrologic conditions. The gathered historical data were examined in the context of hydrologic conditions by discriminating sampling events based on seasonal and event-based flow conditions at the Questa Ranger Station gage. Five hydrologic conditions were defined: rising limb, peak, falling limb, storm, and low flow. A trend of increasing sulfate concentrations and loads at the Questa Ranger Station gage over time, potentially related to mining inputs, was apparent when the dynamic events of snowmelt and summer rainstorm were eliminated and only low-flow concentrations were considered. An inverse relationship was found to exist between sulfate concentrations and discharge seasonally. Both rising limb and storm-event sulfate concentrations were lower than low-flow concentrations. However, a number of samples collected during summer thunderstorm and rising limb conditions had sulfate concentrations equal to or higher than low-flow concentrations, indicating that collecting samples as monthly composites, for example, will dampen or eliminate peaks in releases of sulfate from mineralized or mined areas in the Red River basin. These results show that the highest sulfate concentrations can be expected to occur early in snowmelt runoff and during summer storm events, especially during the rising limb of storms. When flows first increase in the spring, or during summer thunderstorm events, the first flush of sulfide oxidation products from scar and mine-disturbed areas reach the Red River and are not yet diluted by rising river waters.
A more limited number of samples was collected upstream from the Molycorp, Inc. facilities and downstream from sulfate inputs from natural scar areas. The increase in sulfate concentrations and loads over time at the Questa Ranger Station gage was not seen at locations upstream from the mine and downstream from scar areas. Zinc concentrations downstream from the mine at the Questa Ranger Station were uniformly higher than those upstream from the mine and downstream from scar areas, indicating that additional zinc sources enter the river in the vicinity of the mine.
A plot of calcium in relationship to sulfate concentrations in samples collected at the Questa Ranger Station gage indicates that during higher flow events, Red River water is diluted by calcium-carbonate waters, most likely from unmineralized Red River tributaries and areas upstream from scar areas. The effect of pyrite oxidation on Red River water chemistry is more pronounced after the early 1980's, possibly from mining activity. The alkalinity values in the Red River indicate that the river is not well buffered with respect to pH, and that both mined and scar areas contribute to observed decreases in alkalinity. These effects were most apparent during summer thunderstorm and rising limb conditions, which were associated with elevated zinc concentrations, a decrease in alkalinity, and increases in sulfate and conductivity, again demonstrating that hydrologic timing is critical to interpretation of concentration changes in this mineralized and mined drainage.
Allen, B.D., Groffman, A.R., Molles, M.C. Jr., Anderson, R.Y., and Crossey, L.J., 1999, Geochemistry of the Red River stream system before and after open-pit mining, Questa Area, Taos County, N.M.: Santa Fe, New Mexico Office of the Natural Resources Trustee, October 1999.
American Public Health Association, 1965, Standard methods for the examination of water and wastewater (12th ed.): Washington, D.C., American Public Health Association.
American Public Health Association, 1971, Standard methods for the examination of water and wastewater (13th ed.): Washington, D.C., American Public Health Association, 374 p.
American Public Health Association, 1976, Standard methods for the examination of water and wastewater (14th ed.): Washington, D.C., American Public Health Association.
American Public Health Association, 1981, Standard methods for the examination of water and wastewater (15th ed.): Washington, D.C., American Public Health Association, 1134 p.
Briggs, P.H., Sutley, S.J., and Livo, K.E., 2003, Questa baseline and pre-mining ground-water quality investigation 11. Geochemistry of alteration scars and waste piles: U.S. Geological Survey Open-File Report 03-458, 17 p.
Brown, Eugene, Skougstad, M.W., and Fishman, M.J., 1970, Methods for the collection and analysis of water samples for dissolved minerals and gases: U.S. Geological Survey Techniques of Water-Resources Investigations, Book 5, Chapter A1, 160 p.
ENSR Consulting and Engineering, Inc.,1988, Aquatic ecosystem survey of the Red River, New Mexico: December 1988.
Faith, S.E., 1974, An equilibrium distribution of trace elements in a natural stream environment, the Red River near Questa, New Mexico: Socorro, New Mexico Institute of Mining and Technology, Masters thesis.
Federal Water Pollution Control Administration, 1966, A water quality survey, Red River of the Rio Grande, New Mexico: U.S. Department of Education, Health, and Welfare, January 1966.
Gale, V.G., and Thompson, A.J.B., 2001, Reconnaissance study of waste rock mineralogy: Questa, New Mexico, Petrography, PIMA Spectral Analysis and Rietveld Analysis: PetraScience Consultants Inc., January 31, 2001.
Garn, H.S., 1985, Point- and nonpoint-source trace elements in a wild and scenic river of northern New Mexico: Journal of Soil and Water Conservation, September 1985, p. 458–462.
Jacobi, G.Z., and Smolka, L.R., 1984, Intensive survey of the Red River in the vicinity of the Red River and Questa wastewater treatment facilities and the Molycorp, Inc. complex, Taos County, N.M.: New Mexico Health and Environment Department, Surface Water Quality Bureau, Environmental Improvement Division, January 1984, p. 25–27.
Jambor, J.L., Nordstrom, D.K., and Alpers, C.N., 2000, Metal-sulfate salts from sulfide mineral oxidation in Alpers, C.N., Jambor, J.L., and Nordstrom, D.K., eds., Sulfate Minerals: Crystallography, Geochemistry, and Environmental Significance: Mineralogical Society of America and Geochemistry Society, Reviews in Mineralogy and Geochemistry, v. 40: p. 303–350.
Kent, Stuart, 1995, Expanded site inspection report on Molycorp, Inc., Questa Division, Taos County, New Mexico: New Mexico Environment Department, Groundwater Protection and Remediation Bureau—Superfund Program, October 20, 1995, 36 p.
Knight, P.J., 1990, The flora of the Sangre de Cristo Mountains, New Mexico, in Bauer, P.W., Lucas, S.G., Mauer, C.K., and McIntosh, W.C., eds., Tectonic development of the Southern Sangre de Cristo Mountains, New Mexico:New Mexico Geological Society, 41st field conference, Sept. 12–15, 1990, p. 94–95.
Lipman, P.W., 1981, Volcano-tectonic setting of tertiary ore deposits, southern Rocky Mountains: Arizona Geological Society Digest, v. 14, p. 199–213.
Livo, K.E., and Clark, R.N., 2002, Mapped minerals at Questa, New Mexico, using Airbourne Visible-Infrared Imaging Spectrometer (AVIRIS) data—Preliminary Report for the first quarterly report of the U.S. Geological Survey investigation of baseline and pre-mining ground-water quality in the Red River Valley Basin, New Mexico, November 13, 2001: U.S. Geological Survey Open-File Report 02-0026, 13 p.
LoVetere, S.H., Nordstrom, D.K., Maest, A.S., and Naus, C.A., 2003, Questa baseline and pre-mining ground-water quality investigation: 3. Historical ground-water quality for the Red River Valley, New Mexico: U.S. Geological Survey Water-Resources Investigations Report 03-4186, 49 p.
Ludington, S.D., Plumlee, G.S., Caine, J.S., Bove, D.J., Holloway, J.M., and Livo, K.E., in press, Questa baseline and pre-mining ground-water quality investigation: 10. Geologic influences on ground and surface waters in the lower Red River watershed, New Mexico: U.S. Geological Survey Scientific Investigations Report.
McCleskey, R.B., Nordstrom, D.K., Verplanck, P.L., Steiger, J.I., and Kimball, B.A., 2003, Questa baseline and pre-mining ground-water quality investigation 2. Low flow (2001) and snowmelt (2002) synoptic/tracer water chemistry fot the Red River, New Mexico: U.S. Geological Survey Open-File Report 03-148, 166 p.
Medine, A.J., 2000, Water quality and sediment characterization of the Red River during April-May, 2000: November 15, 2000.
Melancon, S.M.S., Blakely, L.S., and Janik, J.J., 1982, Site specific water quality assessment: Red River, New Mexico: Environmental Protection Agency 600/x-82-025.
Meyer, J.W., and Leonardson, R.W., 1990, Tectonic, hydrothermal and geomorphic controls on alteration scar formation near Questa, New Mexico: New Mexico Geological Society Guidebook, v. 41, p. 417–422.
Meyer, J.W., and Leonardson, R.W., 1997, Geology of the Questa mining district—Volcanic, plutonic, tectonic and hydrothermal history: Socorro, New Mexico: Bureau of Mines and Mineral Resources Bulletin, Open File Report 431, 187 p.
Molycorp, Inc., 1979, Water quality data: Wild and Scenic River study: October 10, 1979.
New Mexico Environment Department, 1992, Intensive water quality stream surveys and lake water quality assessment surveys, 1991: Surveillance and Standards Section, Surface Water Quality Bureau, April 1979.
New Mexico Department of Game and Fish, 1992, Intensive water quality stream surveys and lake water quality assessment surveys, 1991: Surveillance and Standards Section, Surface Water Quality Bureau, April 1992.
New Mexico Department of Game and Fish, 1993, Intensive water quality stream surveys, 1992: June 1993.
New Mexico Environmental Improvement Division, 1982, Quality assurance project plan for water pollution control: Santa Fe, New Mexico, Water Pollution Control Bureau, 82 p.
New Mexico Environmental Improvement Division, 1986, Quality assurance project plan for water pollution control Programs: Santa Fe, New Mexico, Surface Water Bureau, 98 p.
New Mexico Environmental Improvement Division, 1991, Quality assurance program plan: Groundwater Protection and Remediation Bureau, Superfund Section, State of New Mexico Contract No. 50/667.50/019, September 1991.
Pennak, R.W., 1972a, Final report on ecological research and rehabilitation done for the Molybdenum Corporation of America, 1970-1972: Boulder, Colorado, Thorne Ecological Institute, October 1972.
Pennak, R.W., 1972b, Limnological conditions in the Red River, New Mexico, during the open season of 1971, with special reference to the effects of a large settling pond tributary: Denver, Colorado, Rocky Mountain Center on Environment, 28 p.
Pennak, R.W., 1976, Aquatic ecosystems of Red River, New Mexico, in October 1976: A comparison with conditions in October, 1971: Boulder, Colorado, Thorne Ecological Institute, November 1976, 17 p.
Pennak, R.W., 1977a, Red River, New Mexico, aquatic ecosystems: March 1977 as compared with 1971 and 1976: Boulder, Colorado, March 1977, 15 p.
Pennak, R.W., 1977b, Red River, New Mexico, aquatic ecosystems: October 1977 as compared with October 1971 and October 1976: Boulder, Colorado, November 11, 1977, 13 p.
Pennak, R.W., 1978a, Summary comments on aquatic conditions in the Red River on 29-30 March: Boulder, Colorado, 3 p.
Pennak, R.W., 1978b, Summary comments on aquatic condition in the Red River, New Mexico, in 1978 as compared to 1971–1977: Boulder, Colorado, October 1, 1978, 11 p.
Pennak, R.W., 1979, Ecosystem conditions in the Red River in the late summer of 1979: Effects of abnormally high runoff: Boulder, Colorado, December 11, 1979.
Pennak, R.W., 1981, Aquatic ecosystem conditions in the Red River, New Mexico in July 1981: Boulder, Colorado, October 10, 1981.
Pennak, R.W., 1983, Aquatic ecosystem conditions in the Red River, New Mexico in October 1982: Boulder, Colorado, January 1983, 11 p.
Pennak, R.W., 1984, Aquatic ecosystem conditions in the Red River, New Mexico in October 1983: Boulder, Colorado, January 1984, 10 p.
Rehrig, W.A., 1969, Fracturing and its effects on molybdenum mineralization at Questa, New Mexico: Tucson, University of Arizona, Ph.D. dissertation, 194 p.
Robertson GeoConsultants, Inc., 2000a,Workplan for background characterization study, Questa Mine, New Mexico: Report No. 052008/1, January 2000.
Robertson GeoConsultants, Inc., 2000b, Progress report on task 1.4 of background study—characterization of surface water of non-mining scar affected watersheds: Memorandum from Christopher Wels to Dave Shoemaker, Molycorp, Inc., Questa Division, October 12, 2000, 11 p.
Robertson GeoConsultants, Inc., 2000c, Interim background characterization study, Questa Mine, New Mexico: Report No. 052008/6. Prepared for Molycorp, Inc., June 2000.
Robertson GeoConsultants, Inc., 2001, Background study data report, Questa Mine, New Mexico: Report No. 052008/12, prepared for Molycorp, Inc., 40 p.
Schilling, J.H., 1956, Geology of the Questa molybdenum mine area, Taos County, New Mexico: Socorro, State Bureau of Mines and Mineral Resources, New Mexico Institute of Mining & Technology, Bulletin 51, 87 p.
Skougstad, M.W., Fishman, M.J., Erdman, D.E., and Duncan, S.S., 1979, Methods for determination of inorganic substances in water and fluvial sediments: U.S. Geological Survey Techniques of Water-Resources Investigations, book 5, chap. A-1 (revised), 626 p.
Slifer, Dennis, 1996, Red River groundwater investigation, Final report: New Mexico Environment Department, Surface Water Quality Bureau, March 1996.
Smolka, L.R., and Tague, D.F., 1987, Intensive survey of the Red River, Taos County, New Mexico, August 18-21, 1986: New Mexico Environmental Improvement Division, Surveillance and Standards Section, Surface Water Quality Bureau, October 1987.
Smolka, L.R., and Tague, D.F., 1989, Intensive water quality survey of the Middle Red River, Taos County, New Mexico, September 12–October 25, 1988: New Mexico Environmental Improvement Division, Surveillance and Standards Section, Surface Water Quality Bureau: May 1989, 87 p.
South Pass Resources, Inc., 1995, Discussion of geology, hydrogeology, and water quality of the tailings area, Molycorp, Inc. Facility, Taos County, New Mexico: April 13, 1995.
Steffen, Robertson, and Kirsten, 1995, Questa molybdenum mine geochemical assessment: SRK Project no. 09206, Lakewood, Colorado, April 13, 1995, 44 p.
URS, 2001a, Molycorp, Inc. Questa Mine site-wide comprehensive hydrologic characterization report: Denver, Colorado, March 2001, 95 p.
URS, 2001b, Stormwater and seepage interception systems, Questa Mine, New Mexico: Denver, Colorado, January 2001.
URS, 2002, Molycorp, Inc. Remedial Investigation/Feasibility Study (RI/FS) work plan, sections one through three, v. 1 draft final: Denver, Colorado, July 2002.
U.S. Environmental Protection Agency, 1971, A water quality survey, Red River and Rio Grande, New Mexico: Region VI; Surveillance and Analysis Division, prepared in cooperation with New Mexico Department of Game and Fish and New Mexico Environmental Improvement Agency, Ada, Oklahoma.
U.S. Environmental Protection Agency, 1979, Methods for Chemical Analysis of Water and Wastes: Cincinnati, Ohio, Environonmental Monitoring and Supply Laboratory, EPA-600/4-79-020.
U.S. Environmental Protection Agency, 1982, Site specific water quality assessment—Red River, New Mexico: Washington, DC., EPA-600/X-82-025, 118 p.
U.S. Environmental Protection Agency, 1983, Methods for Chemical Analysis of Water and Wastes: U.S. Department of Commerce, National Technical Information Service, EPA-600/4-79-020, 521 p.
U.S. Environmental Protection Agency, 1988, Laboratory results for the Red River Biomonitoring Study: 8A53LA24, p. 55–89.
U.S. Environmental Protection Agency, 2003, EPA's largest computerized environmental data system, for STOrage and RETrieval. Accessed 2003 at URL http://www.epa.gov/storet/.
U.S. Geological Survey, 2003a, Daily streamflow for the Nation. U.S. Geological Survey 08265000 Red River near Questa, New Mexico. Accessed 2004 at URL http://nwis.waterdata.usgs.gov/usa/nwis/discharge.
U.S. Geological Survey, 2003b, Water quality samples for the Nation: Accessed June 2003 at URL http://nwis.waterdata.usgs.gov/nwis/qwdata for site 08265000 (Red River near Questa, New Mexico).
Vail Engineering, Inc., 1989, A geochemical investigation of the origin of aluminum hydroxide precipitate in the Red River, Taos County, New Mexico: June 1989.
Vail Engineering, Inc., 1993, Interim study of the acidic drainage to the middle Red River, Taos, County, New Mexico: July 9, 1993.
Vail Engineering, Inc., 2000, Analysis of acid rock drainage in the middle reach of the Red River, Taos County, New Mexico: Interim report, July 4, 2000.
Western Regional Climate Center, 2003, Historical climate information, New Mexico climate summaries, Red River, New Mexico (297323): accessed July 17, 2003, at URL http:/www.wrcc.dri.edu/.
Woodward-Clyde Consultants, 1994, Field observations of the New Mexico Environment Department, June 1994 sampling event at the Molycorp, Inc. Questa Mine, Questa, New Mexico: September 1994.
Woodward-Clyde Consultants, 1995, Field observations of the New Mexico Environment Department November 1994 sampling event at the Molycorp, Inc. Questa Mine: Questa, New Mexico: March 1995.
Woodward-Clyde Consultants, 1996a, Red River surface water investigation report, November 1995, Molycorp, Inc. Questa Mine, Questa, New Mexico: Denver, Colorado, June 1996.
Woodward-Clyde Consultants, 1996b, Final Compilation of Molycorp, Inc.'s sample data from sample splits with the New Mexico Environment Department, collected during the expanded site inspection at the Molycorp, Inc. Questa Mine: Denver, Colorado: September 1996, 38 p.
Document Accessibility: Adobe Systems Incorporated has information about PDFs and the visually impaired. This information provides tools to help make PDF files accessible. These tools convert Adobe PDF documents into HTML or ASCII text, which then can be read by a number of common screen-reading programs that synthesize text as audible speech. In addition, an accessible version of Acrobat Reader 6.0, which contains support for screen readers, is available. These tools and the accessible reader may be obtained free from Adobe at Adobe Access.
| AccessibilityFOIAPrivacyPolicies and Notices | |
 |
|