
![]()
U.S. GEOLOGICAL SURVEY
Scientific Investigations Report 2004–5237
Conceptual Model and Numerical Simulation of the Ground-Water-Flow System in the Unconsolidated Deposits of the Colville River Watershed, Stevens County, Washington
Appendix A. Simplified Monthly Water Budget for the Colville River Watershed
A simplified monthly water budget for a typical year is a useful tool to understand the relation between ground-water and surface-water flow. It also is a necessary tool for water-resource management decisions. The simplified water budget presented in this section differs from the ground-water budget discussed in a previous section. The simplified water budget expresses the distribution of precipitation. The ground-water budget expresses the distribution of recharge, or that volume of precipitation that enters the ground-water system.
The two largest components of the simplified water budget are precipitation and evapotranspiration (Kahle and others, 2003). To estimate monthly values for these two terms, measured precipitation, air temperature, and stream discharge time-series data were used to make Precipitation-Runoff Modeling System (PRMS) simulations of the Colville River Watershed. The period of climate record used in model simulations was water years 1990-99. Precipitation for this period was above average, so annual totals of precipitation and streamflow are greater than the numbers presented in Kahle and others (2003).
Rainfall and temperature data are typically point measurements, whereas the model requires input distributed throughout the study area. Precipitation and temperature algorithms used a distance-weighted average approach, in which monthly mean precipitation ratios between climate stations and Modeling Response Units (MRU) were calculated from the Parameter-estimation Regressions on Independent Slopes Model (PRISM) estimates (Daly and others 1994; 1997). MRUs are similar to irregularly shaped model cells that are delineated in a manner that reflects spatially distributed attributes such as slope, aspect, elevation, soils, and vegetation, and which respond similarly to hydrologic inputs such as precipitation. Each MRU is a smaller polygon area of a subbasin in which these physical characteristics are assumed to be homogeneous.
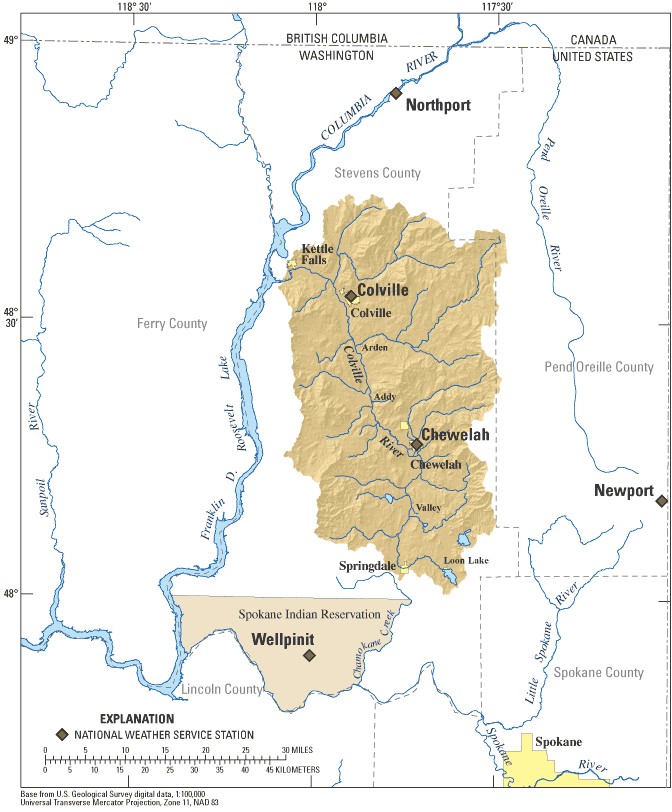
Daily precipitation totals used in the PRMS model simulations were measured at precipitation gages located throughout the Colville River Watershed and surrounding watersheds. Precipitation gages operated by the U.S. National Weather Service (NWS) provided data from a total of 5 gages (fig. A1). The rain module used by PRMS requires mean monthly estimates of precipitation for each MRU to compute ratios between rain gage locations and the MRU. For this purpose, the PRISM model estimates (Daly and others, 1994; 1997) were used.
Measured, daily, minimum-, and maximum-air temperature data were collected by the NWS at five locations (fig. A1). To account for differences in elevation between the stations and the watershed, PRMS adjusts the temperature data on the basis of a calculated lapse rate for every 1,000-foot increase in elevation.
In addition to elevation, slope, and aspect, ancillary information concerning soils, land use and land cover, and vegetation was assigned to each MRU. Digital soil data were obtained from a modified version of the State Soil Geographic Database (STATSGO) general soil maps (U.S. Department of Agriculture, 1994). Parameters from the contiguous U.S. Forest Type Groups map and U.S. Forest Density map provided vegetation information (Zhu and Evans, 1992; Powell and others, 1998). Digital land cover data were obtained from the USGS, the University of Nebraska-Lincoln, and the European Commission's Joint Research Centre global land cover characteristics database (Loveland and others, 1991; U.S. Geological Survey, 1992).
Ground-water discharge near Kettle Falls was simulated in PRMS as a ground-water sink. The daily accretion to the sink is a function of a seepage constant and the ground-water reservoir storage. The PRMS model was calibrated to the annual ground-water discharge presented in Kahle and others (2003). Mean monthly streamflow values for the Colville River at Kettle Falls (station 12409000) are available for the period of simulation. Net ground-water pumping were estimated to be the reported ground-water pumping (Kahle and others, 2003) minus secondary recharge (50 percent of ground-water pumping).
It is assumed that, in the long term, inflow to the watershed equals outflow and there is little change in the amount of water stored within the watershed. (This assumption is not true at the seasonal or monthly time scale, but for purposes of the simplified water budget, change in storage will equal zero.) The following equation illustrates the relation:
Precipitation = Evapotranspiration + Streamflow at outlet + Net ground-water pumping + Ground-water outflow
The monthly water budget is shown in table A1. The budget is for a period of higher precipitation than the long-term average, so precipitation and streamflow are slightly higher than those values reported in Kahle and others (2003). Evapotranspiration is 21.8 in., as compared to 22.5 in reported in Kahle and others (2003). Estimated ground-water outflow was 0.3 in. in both annual water budgets.
| Month | Precipitation | Evapotranspiration | Streamflow | Net ground-water withdrawal (withdrawal minus secondary recharge) |
Ground-water outflow |
|---|---|---|---|---|---|
| January | 3.2 | 0.1 | 3.2 | 0.04 | 0.02 |
| February | 2.4 | .3 | 4.7 | .04 | .02 |
| March | 2.3 | 1.1 | 8.7 | .05 | .02 |
| April | 2.1 | 2.5 | 12.1 | .05 | .03 |
| May | 3.2 | 6.9 | 10.2 | .08 | .03 |
| June | 2.9 | 4.7 | 7.2 | .14 | .03 |
| July | 1.7 | 3.5 | 3.2 | .26 | .03 |
| August | .8 | 1.3 | 1.7 | .26 | .02 |
| September | 1.0 | .7 | 1.6 | .09 | .02 |
| October | 2.0 | .4 | 1.6 | .05 | .02 |
| November | 3.1 | .2 | 2.0 | .04 | .02 |
| December | 3.4 | .1 | 2.5 | .03 | .02 |
| Annual | 28.10 | 21.80 | 4.90 | 1.13 | .28 |
For more information about USGS activities in Washington, visit the USGS Washington District home page .
![]()
![]()