
1 University of Wisconsin-Madison, Civil and Environmental Engineering Department
Hydrologic Conditions During the Monitoring Period
Future Monitoring and Suggestions for Further Study
Figure 1. Location of North Fish Creek, Wis., and eroding bluff sites where...
Figure 2. Annual sediment budget for North Fish Creek, Wis. (Fitzpatrick an...
Figure 3. Longitudinal profile for North Fish Creek, Wis., from its headwat...
Figure 4. Flow-deflecting vanes and resulting flow vortexes, A, diagram (mo...
Figure 5. Changes in the channel and thalweg caused by flow-deflecting vane...
Figure 6. Final layout of vane arrays and channel cross sections at A, site...
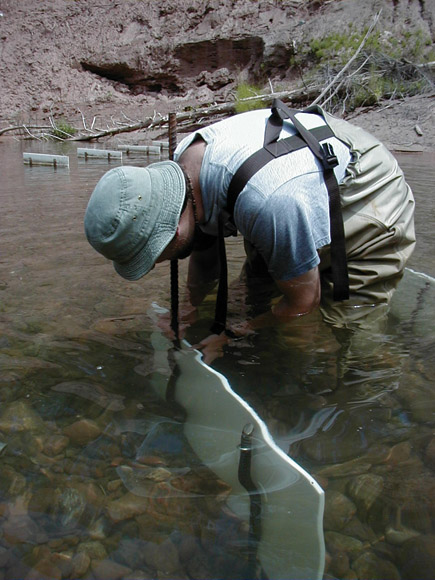
Figure 7. Vanes being installed at site 16.4, summer 2000, North Fish Creek...
Figure 8. Hydrographs of instantaneous streamflow from North Fish Creek, Wi...
Figure 9. Photographs of the channel and bluff at site 16.4, 1993–2004, Nor...
Figure 10. Block failure from eroding bluff near cross-section 5, site 16.4...
Figure 11. Damaged vanes near cross-section 6 following April 2001 flood, s...
Figure 12. Stage data from the streamgage and from the stage recorder at si...
Figure 13. Stage data from the streamgage and from the stage recorders at s...
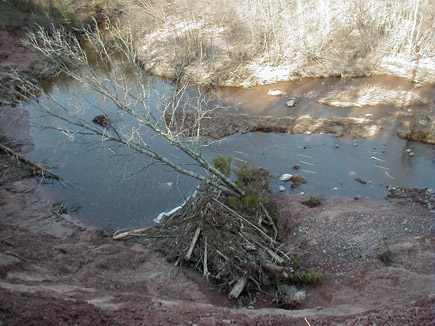
Figure 14. North Fish Creek at sites 16.4 and 12.2 during the April 2003 sn...
Figure 15. Change in channel and bluff locations along monitored cross sect...
Figure 16. Channel and bluff at site 12.2, 2001–04, North Fish Creek, Wis. ...
Figure 17. Change in channel and bluff locations along monitored cross sect...
Table 1. Sequence of events for vane installation and channel and bluff mon...
Table 2. Design specifications and actual values for vanes recommended from...
Table 3. Changes in the volume of sediment from banks, streambed, and bars ...
Table 4. Results from monitoring bluff-top erosion at site 16.4 from 2000 t...
Table 5. Changes in the volume of sediment from banks, streambed, and bars ...
Table 6. Bluff erosion monitoring results for site 12.2, North Fish Creek, ...
Flow-deflecting vanes were installed in the streambed along two meander bends with eroding bluffs in 2000 and 2001 in the upper main stem of North Fish Creek, a tributary to Lake Superior in Wisconsin. About 45 vanes were arranged in 15 arrays at each site to deflect the flow away from the eroding toe or base of the bluff (outside of a bend) and toward the point bar (inside of a bend). Channel cross-section and bluff-erosion surveys were done and streamflow and stage were measured before, during, and after vane installation to monitor changes in channel morphology and bluff erosion in the context of hydrologic conditions. There were two large floods in the study area in spring 2001 (recurrence interval of approximately 100 years) and in spring 2002 (recurrence intervals of approximately 50 years). Some maintenance and replacement of vanes were needed after the floods. Most of the channel-morphology changes resulted from the large floods, and fewer changes resulted from near-bankfull or at-bankfull flows (one in October 2002 and four in April and May 2003). At the bluff located 16.4 river miles upstream of the creek mouth (site 16.4), the vanes deflected flow and caused the channel to migrate away from the base of the bluff and toward the point bar, allowing sediment to deposit along the bluff base. The 361-foot reach at site 16.4 had a net gain of 6,740 cubic feet of sediment over the entire monitoring period (2000–03). Deposition (10,660 cubic feet) occurred mainly along the base of the bluff in the downstream part of the bend. Erosion occurred at site 16.4 along the streambed, the point bar side of the channel, and along a midchannel bar (1,220, 1,610, and 1,090 cubic feet, respectively). Less channel migration was observed during 2001-03 at another bluff located 12.2 river miles upstream of the creek mouth (site 12.2), which had a net loss of sediment through the 439-foot reach of 2,800 cubic feet over the monitored time period. The main volume of sediment was lost from the bluff toe in the downstream part of the bend (7,100 cubic feet). Monitored channel-morphology changes at site 12.2 were less than at site 16.4, most likely because installation was done after the April 2001 flood, which caused major changes in channel morphology at site 16.4, and because the monitoring period was shorter than at site 16.4. Bluff-erosion data from both sites indicate that mass wasting and block failures from the bluff top occur episodically and will continue to occur for decades or more.
A demonstration study of the effectiveness of flow-deflecting vanes in a stream channel for reducing streambank erosion and improving aquatic habitat was done on North Fish Creek, a Wisconsin tributary to Lake Superior (fig. 1). Vanes are vertical plates that are installed on a streambed at specific angles and designed to deflect the flow in a bend away from the base of an eroding bank. The monitoring and installation of the vanes was done through the cooperative efforts of the Wisconsin Department of Natural Resources (DNR), Civil and Environmental Engineering (CEE) Department of the University of Wisconsin (UW)-Madison, U.S. Fish and Wildlife Service (USFWS), and U.S. Geological Survey (USGS).
North Fish Creek is similar to many northern Wisconsin tributaries to Lake Superior in providing some of the highest sediment loads observed in the Great Lakes (Rose and Graczyk, 1996; Robertson, 1996). Results from a historical geomorphic study of North Fish Creek (Fitzpatrick and others, 1999) indicated that the majority of the total sediment load of North Fish Creek (67 percent, about 15,000 tons per year) originates from 17 eroding bluffs, 60 to 160 ft high, along meander bends through the upper main stem (fig. 2). Channel down-cutting (incision) also is a problem along the upper main stem and contributes 18 percent of the total sediment load. Upland erosion only contributes a small amount of sediment to the main stem (5 percent) because the watershed is mainly forest and grassland (fig. 1). Even though the amount of upland erosion is small, flood peaks are possibly 2.5 times higher and runoff volumes larger than when the watershed was completely forested before European settlement (Fitzpatrick and others, 1999). Bluff erosion occurred before European settlement, but appears to be accelerated because of increased flood peaks, runoff volumes, and related channel incision rates (Fitzpatrick and others, 1999).
The upper main stem of North Fish Creek is an important fishery resource for native brook trout and introduced potamodromous Coho salmon and steelhead. (Potamodromous means that the fish species live entirely within freshwater systems and exhibit seasonal return movements to spawning areas, usually located upstream in rivers.) Upstream controls on bluff erosion were needed to reduce downstream sediment transport (potential scour effects) and sedimentation (covering of spawning beds).
Bluff failures typically are rotational or translational landslides but also have characteristics of debris avalanches and earth flows depending on the amount of clay and water content in the failing section and trees near the top edge of the bluff (Highland, 2004). Failures occur episodically and are related to flood events, freeze/thaw cycles, or periods of intense rainfall or snowmelt. During floods, the base, or toe, of the bluff is eroded by flowing water, which causes the bluff face to steepen and the upper part of the bluff to eventually fail from mass wasting and gravitational forces.
Past efforts to stabilize the bluffs on North Fish Creek through bioengineering efforts alone (using living plants to protect stream banks) had various success rates. Failures occurred because the plantings were mainly along the bluff toe and were covered by mass-wasted material from the upper part of the bluff, or were inadequate for stopping toe erosion along the base of the bluffs.
Tributaries to Lake Superior are typically hard to access because of steep topography, lack of roads, thick brush and forest, and swampy valley bottoms. Techniques for stabilizing the bluffs and reducing erosion for these types of streams needed to be appropriate for remote areas and for minimal disturbance of the channel and spawning beds. The vanes were thought to be cost-effective alternatives to traditional, bank-hardening structures or other management techniques that would reduce flood peaks, such as detention basins. Vanes may be environmentally less intrusive because the bank is left in its natural state and the vanes can be installed by hand, minimizing compaction and disturbance from large earth-moving equipment.
The immediate goal of this demonstration study was to collect quantitative monitoring data in order to evaluate the capability of an instream restoration technique (flow-deflecting vanes on the streambed) to reduce bluff erosion along a flashy, high-energy stream. Results from this study will be used to guide watershed-based management decisions that are geared toward reducing erosion problems in other tributaries to Lake Superior, improving fish habitat and spawning areas, and reducing the amount of sediment transported downstream to Lake Superior.
Vanes were designed and installed at two eroding bluff sites on North Fish Creek in 2000 and 2001, mainly by the UW. Monitoring of channel and bluff conditions by the USGS and maintenance of the vanes by the UW continued through 2004 and will continue at both sites.
The purpose of this report is to present the results from monitoring changes in channel morphology and bluff erosion following installation of flow-deflecting vanes at two eroding bluff sites along North Fish Creek, Wisconsin. Results from the monitoring data are grouped by site and mainly cover the period 2000–03. Channel and bluff changes are described in the context of hydrologic conditions. Changes in channel morphology (based on changes in cross-section profiles) were quantified in terms of volume of sediment removed or deposited from the point bar, streambed, bars, and bluff toe. Occurrence of block failure from the top of the bluffs also was monitored.
North Fish Creek generally flows from southwest to northeast, emptying into a coastal wetland at the head of Chequamegon Bay, Lake Superior, approximately 1 mi west of Ashland, Wis. The drainage area of North Fish Creek at its mouth is approximately 47 mi2 (surface-water-contributing area only). Average annual precipitation is 30 in., with 16 in. of average annual evapotranspiration and 14 in. of runoff (Young and Skinner, 1974). Mean daily maximum air temperatures range from 22°F in January to 78°F in July (Eichenlaub, 1979). In 1992–93, land cover in the basin consisted of 58 percent forest, 31 percent pasture/grassland, 5 percent wetland, 3 percent cropland, and 3 percent barren (Reese and others, 2002).
The meandering reach along North Fish Creek with eroding bluffs extends from about river mile 10 to 18 (fig. 1). The two monitored eroding bluff sites are at river miles 16.4 and 12.2 (drainage areas of 19.8 and 25.1 mi2, respectively). A streamgage (USGS station number 040263491) is on North Fish Creek at river mile 10.5 (drainage area of 38.3 mi2) at the downstream end of the reach with eroding bluffs.
Surficial deposits in the North Fish Creek Basin consist mainly of clayey, lake-modified glacial deposits associated with the Miller Creek Formation (Clayton, 1984). The basin is rimmed on the northern and western side by sand and (or) sand and gravel associated with nearshore, wave-modified deposits from high stages of Lake Superior following deglaciation of the region (Clayton, 1984). Discontinuous sand, gravel, silt, and clay deposits associated with the Copper Falls Formation are present beneath the Miller Creek clay and are exposed in many of the 100-ft-high eroding bluffs. Soils developed in the Miller Creek clay have low infiltration rates (median of 0.1 in/h; Krug and others, 1992). The low infiltration rates result in high runoff rates. Sandy deposits exposed in the eroding bluffs are noncohesive and particularly prone to collapse. The instability of the bluffs is aggravated by seeps and springs along the base of the bluffs.
The eroding bluffs along North Fish Creek are in a steep, incised reach of the stream that cuts through wave-planed topography associated with higher levels of Lake Superior following deglaciation (fig. 3) (Clayton, 1984). The slope in this reach averages 37 ft/mi or 0.7 percent. Substrate in the eroding-bluff reach changes from boulder/cobble/sand in upstream areas to cobble/gravel/sand in downstream areas. This reach is used by coho salmon and steelhead for spawning (fig. 3) (Dennis Pratt, Wisconsin Department of Natural Resources, oral commun., 2004). Before European settlement in the late 1800s, the entire length of North Fish Creek was populated by native brook trout. Brook trout currently are found only in headwater reaches and tributaries (Dennis Pratt, Wisconsin Department of Natural Resources, oral commun., 2003).
The study began when vanes were installed at site 16.4 in summer 2000 (table 1). Out of the 17 documented eroding bluffs, this site had the most previous data (channel cross-section and bluff surveys and profile of bluff stratigraphy; Fitzpatrick, 1998), and the best access (located near U.S. Highway 2 and on public land). In 2001, vanes were installed at a second site 4.2 mi downstream from site 16.4 at site 12.2. The eroding bluff at site 12.2 was similar in size to the eroding bluff at site 16.4; site 12.2 had an actively eroding toe and also was on public land. No previous data were available for site 12.2.
Channel cross-section and bluff surveys began before vane installation (site 16.4) or during vane installation (site 12.2) (table 1). The streamgage at river mile 10.5 was reactivated in June 2000 to monitor streamflow during the study. In addition, stage recorders were installed at each site to monitor at-site changes in water depth. Channel cross-section and bluff surveys were done two to three times a year after vane installation, depending on the timing of floods.
| Date | Event | Site 16.4 | Site 12.2 |
|---|---|---|---|
| July 1994 | Bluff-top survey | x | |
| April 2000 | Channel cross-section survey | x | |
| July 2000 | Streamgage reactivated | ||
| Summer 2000 | Vanes installed | x | |
| August 2000 | Bluff-top survey | x | |
| March 2001 | Stage recorder installed | x | |
| April 2001 | 75- to 100-year flood | ||
| April 2001 | Channel cross-section survey | x | |
| June 2001 | Channel cross-section survey | x | |
| July 2001 | Bluff-top survey, vane maintenance | x | |
| August 2001 | Channel cross-section survey | x | |
| Summer 2001 | Vanes maintained and some replaced | x | |
| September/October 2001 | Vanes installed | x | |
| April 2002 | Stage recorders installed | x | |
| May 2002 | Channel cross-section and bluff-top surveys, vanes maintained | x | x |
| August 2002 | Channel cross-section and bluff-top surveys | x | x |
| January 2003 | Channel cross-section survey | x | x |
| April 2003 | Bluff-top survey | x | x |
| May 2003 | Channel cross-section survey | x | x |
| June 2003 | Bluff-top survey | x | x |
| September 2003 | Channel cross-section and bluff-top survey | x | x |
The detailed design and layout of the vanes for each site is given in Whitman (2002). A summary of the design and layout follows here.
Vanes are vertical plates that protrude from a streambed about one-third of the bankfull depth, are oriented at an angle to the local stream velocity, and are distributed in arrays (groups) along part of the channel. When the vanes are submerged, they induce a transverse force and torque on the flow and cause a longitudinal vortex at their tops (fig. 4); this vortex is similar to the vortex from the wingtip of an airplane. This modified flow field causes (1) erosion of the streambed on the side opposite the angle of the vane into the flow and (2) deposition of sediment carried by the flow (and eroded from the bank) on the other side. Two small horseshoe vortexes near the bed cause local scour (the extent depends on the angle of the vane into the flow). In a bend, the vane-induced torque and tip vortexes from the arrays of vanes counter the secondary flow caused by the bend. Erosion of the streambed by these tip vortexes moves the thalweg away from the outside of the bend (cut bank) and toward the point bar, causing the channel radius to increase (flattening the bend) and channel cross sections to become more symmetrical (fig. 5). Thus, placing arrays of vanes along the outside of a bend causes sedimentation at the toe of the cut bank, which prevents further undercutting and helps to stabilize the bank (Whitman, 2002). Eventually, the vanes are buried by depositing sediment.

Vane dimensions and layout for the two North Fish Creek sites were based upon previous experiments and field studies, mainly those done by Odgaard and others at the Iowa Institute of Hydraulic Research (IIHR) (Odgaard and Kennedy, 1983; Odgaard and Mosconi, 1987; Odgaard and Wang, 1991a,b). The design procedure in Odgaard and Wang (1991b) was used to plan the size, shape, number, and layout of the vanes for the two North Fish Creek sites (table 2). Specific data needed for the design included bankfull depth and channel geometry and planform. Previous data (Fitzpatrick, 1998) and data from the April 2000 field survey for bankfull depth and channel geometry and planform were used to determine the height and width of the vanes at site 16.4. For site 12.2, channel cross-section and bankfull-depth data were collected in fall 2001 just prior to vane installation (table 1).
[X, times; °, degree; ft, foot]
| Vane parameter | Design specifications (Odgaard and Wang, 1991b) | Site 16.4 actual values | Site 12.2 actual values |
|---|---|---|---|
| Height | 0.2 to 0.4X average bankfull depth | 0.3X average bankfull depth at the array location | 0.3X average bankfull depth at the array location |
| Width | 2–3X vane height | 3 ft (4 ft in deep hole) | 3 ft |
| Lateral spacing | 2–3X vane height | 3 ft (±0.6 ft to avoid obstacles) | 3 ft (±0.6 ft to avoid obstacles) |
| Angle to estimated bankfull flow pattern | 13–40° | 15–20° | 15–20° |
| Streamwise spacing of array | 10–30X vane height | 12–15 ft (to avoid obstacles) | 20 ft (±3 ft to avoid obstacles) |
| Vane-to-bank distance | Not to exceed 1–4X vane height | Close to bank or on bank if possible | Close to bank or on bank if possible |
| Number of vane arrays | Enough to cover entire meander | 14 | 15 |
| Total number of vanes | About 20 vanes placed in arrays along entire meander | 43 | 49 |
The most critical measurement for vane design is bankfull depth, which is used to determine vane height. A combination of field indicators were used to identify the bankfull depth and included the top of the coarse deposits associated with point bars (minimum elevation); the occurrence of a sharp break in slope of the bank above the low-flow water surface where the slope changes from vertical to more horizontal; changes in vegetation, such as a change from herbaceous to tree species; and for undercut banks, the top of the undercut (minimum bankfull elevation) (Harrelson and others, 1994; Fitzpatrick and others, 1998). The vane height, in turn, is used to determine the vane width, lateral spacing of each vane within an array, streamwise spacing (longitudinal distance between arrays), and vane-to-bank distance. For the design, vane height was determined by multiplying the bankfull depth by 0.3. At site 16.4, the average bankfull depth was 4.6 ft; therefore, a typical vane height was 1.4 ft. To accommodate the uneven and undulating streambed at both North Fish Creek sites, the top of each vane was set to 0.6 times the estimated average bankfull depth at that section.
Design values for vane width were determined to be 2 to 3 times vane height. For the North Fish Creek sites, the vane width used was 3 ft, except for some wider 4-ft vanes that were placed in the thalweg in a deep hole along the cut-bank side of site 16.4. All the vanes at site 12.2 had a width of 3 ft; wider vanes were not needed because there were no deep holes.
In the design, lateral spacing among vanes within an array was determined to be 2 to 3 times the vane height. For the North Fish Creek sites, a spacing of 3 ft (± 0.6 ft to avoid large cobbles and boulders) between vanes was used, which is generally 2 times the vane height. The low end of the recommended range was used to maximize the vortex effect. The number of vanes in each array was based on the amount of channel shift necessary to move flow away from the eroding bluff.
The design angle of the vanes to bankfull flow direction can range from 13° to 40°. For the North Fish Creek sites, the chosen angle was 15-20° based on results from previous studies by Odgaard and Wang (1991a,b) and Hoopes and others (1999).
Streamwise spacing of the arrays for design purposes was determined to be 10 to 30 times the vane height. For site 16.4, the streamwise array spacing was between 12 and 15 ft. This short spacing, slightly less than the typical design value, tightens the vortex field and more dramatically disrupts the horizontal circulation of flow through a bend (Odgaard and Wang, 1991a). The array spacing at site 12.2 was about 20 ft because the channel is narrow (less than 30 ft wide) through the sharply angled bend and a smaller streamwise spacing would cause the arrays to be close to each other along the point-bar side of the channel. Additional single vanes and a vane array were added later to the reach on the cut bank side between arrays. The streamwise spacing varied slightly at both sites to avoid immovable obstacles, such as large boulders.
Design values of vane-to-bank distance should not exceed 1 to 4 times the vane height. For both North Fish Creek sites, a small vane-to-bank distance was used, similar to that in the vane study done on Pheasant Branch, Wis. (Hoopes and others, 1999). Vanes were placed as close to a bank as possible—or on the bank if possible—to make sure that the flow would not cut around the vanes and erode more of the bluff toe.
The length of the bend determined the number of arrays because the arrays should extend through the entire bend. Site 16.4 had 14 arrays and site 12.2 had 15 arrays. The arrays extend through the bends at both sites, upstream and downstream from the eroding bluffs (fig. 6). The total number of vanes (including those buried or removed) in September 2003 was 43 at site 16.4 and 49 at site 12.2. The number of vanes in each array was based on the amount of channel shift necessary to achieve the desired channel alignment away from the bluff. More vanes were used in the center of the bends and through the bends by the toe of the eroding bluff.
The vanes were installed under normal flow conditions at both sites. Installation of the vanes at site 16.4 started in summer 2000 and was completed in summer 2001. Installation of the vanes at site 12.2 started in September and October 2001 and continued into summer 2003.
Complete installation plans and procedures are given by Whitman (2002). Materials and tools needed for the construction of the vanes were carried into each site. The vanes were cut onsite to the correct size from 4-ft by 8-ft sheets of 0.375-in.-thick, white, high-density polyethylene (HDPE). The vanes were held in place by driving two 0.75-in.-diameter steel reinforcing bars into the streambed about 2 to 3 ft and fastening the vanes to the bars with U-bolts (fig. 7).
Updates were made to the vane layout at site 12.2 in summers 2002 and 2003. Some vanes had to be replaced after floods in 2001, 2002, and 2003. Not every vane or array that was designed was installed, owing to local obstacles in the channel such as boulders, logs, or bed features.
Eight channel cross sections were established at site 16.4 in 2000 and five cross sections were established at site 12.2 in 2002 (fig. 6, table 1). The most upstream and downstream cross sections were just outside the arrays (fig. 6). The cross sections are perpendicular to the estimated bankfull channel and extend into the flood plain on the point-bar side and up the eroding bluff to elevations above bankfull. Steel reinforcing bars were driven into the ground at the endpoints of each transect (at the top of the bluff along the steep, eroding part of the bluff) and also were used for benchmarks. Multiple benchmarks are located on the point bar and bluff sides of the stream at both sites. Surveys were done with an electronic theodolite (Harrelson and others, 1994). Subsequent surveys were referenced to the same coordinate system by initially setting up the theodolite over a known base point and backsighting to a known benchmark. Each transect was surveyed with 20 to 30 points, a number adequate to detect small changes in bank and channel elevations.
Northing and easting coordinates were transformed into distances along a cross section by use of the following equation
where
This transformation allowed subsequent surveys to be overlain for display of cross-section change and for calculation of sediment fluxes The midchannel distance between the upstream and downstream cross sections is 361 ft at site 16.4 and 439 ft at site 12.2.
The volume of sediment lost and gained along the banks, bed, and bars from each site was estimated by quantifying the differences in cross-section profiles before and after the vanes were installed. Surveys done in September 2003 were compared to those done in April 2000 for site 16.4 and surveys done in September 2003 were compared to those done in May 2002 for site 12.2. Profile data from the selected surveys from each cross section were plotted on graphs with equal horizontal and vertical scales. The cross-section profiles were hand digitized, and area changes between the two surveys were calculated by use of a geographic information system. Area estimates were converted to volume estimates by multiplying the respective area by the representative left-bank, midchannel, and right-bank distances between each cross section. These lengths were estimated as the sum of half the distance to the next upstream cross section and half the distance to the next downstream cross section.
In 1994 during a geomorphic assessment of North Fish Creek (Fitzpatrick, 1998; Fitzpatrick and others, 1999), eight reference points were established on the upland surface along the top of the eroding bluff at site 16.4 to monitor mass wasting (slumping) from the top overhanging edge of the eroding bluff. The reference points were evenly spaced from the upstream to downstream side above the actively eroding part of the bluff (fig. 6), where there was little or no vegetation. A perpendicular distance was measured from the reference point to the bluff edge (first occurrence of a slope break or edge in the upland surface), and the azimuth of the measurement line recorded so that subsequent measurements could be done along the same line. All the reference points from 1994 were found in good condition in 2000 and were used as a basis for monitoring bluff erosion at site 16.4 (table 1). At site 12.2, nine reference points were established along the bluff top in 2002 in the same fashion as at site 16.4 (table 1).
Measured over time, the perpendicular distances measured are used to determine when and where blocks of upland material are lost from the top edge of the bluff. If blocks of soil are lost, the distances become shorter. Distances also may become slightly longer over time because the number and width of tension cracks may increase and soil may creep before a block failure. Tension cracks, slumping, and soil creep were common features along the top edge of the bluffs at both sites.
Stage (water-surface elevation) was recorded at the streamgage at river mile 10.5 starting in June 2000 and is ongoing (table 1). Historical stage data (1990–91 and 1994–97) were available for the streamgage. Stage data were collected continuously at 15-minute intervals. North Fish Creek remains ice-free during winter months at the streamgage because of the close proximity of springs and high base flow. Discharge (flow) measurements were made at a variety of stages throughout the year by use of standard USGS methods (Buchanan and Somers, 1984). Empirical relations between stage and flow were determined (a rating curve), allowing flow to be directly determined from stage. These data were used to monitor hydrologic conditions, particularly the size of resulting floods after the vanes were installed. Peak flows from runoff events measured at the North Fish Creek streamgage from 2000 to 2003 were compared to peak flows from two nearby USGS streamgages with longer records—the Bois Brule River (25 mi west, drainage area of 118 mi2, 1942–2003), and the Bad River (20 mi east, drainage area of 597 mi2, 1914–22, 1948–2003). Peak flows from the crest-stage partial-record station on the Sioux River (10 mi northeast, drainage area of 13.6 mi2, 1959–2003) also were compared to North Fish Creek.
Remote stage recorders with data loggers also were installed at both vane sites to monitor local changes in stage. At site 16.4, a submersible pressure transducer was installed just downstream from cross-section 4 on the point-bar side of the channel between vane arrays 7 and 8 in late March 2001 (fig. 6). This stage recorder had an arbitrary altitude of about 99.15 ft and measured stage at 30-minute intervals from March 20 to May 15, 2001. The recorder filled with sediment and stopped working after the record April 23, 2001 flood and was replaced by a second pressure transducer, with data-collection intervals of 1 hour from June 19, 2001, to April 3, 2002; 15 minutes for spring and summer, and 1 hour for fall and winter from April 4, 2002, to September 22, 2003.
At site 12.2, two stage recorders were installed on April 4, 2002, at the upstream and downstream ends of the vanes reach (fig. 6). The stage recorder at the upstream end was a submersible pressure transducer (the repaired unit used in April 2001 at site 16.4) and was installed on the left side of the channel near cross-section 1 and upstream from vane array 1. The intake orifice on the pressure transducer had an arbitrary altitude of 99.45 ft in May 2002. The downstream recorder was a capacitance probe that was installed on the point-bar side near vane array 15 between cross-sections 4 and 5 on the right side. The arbitrary altitude of the capacitance probe was 98.89 ft. Data were recorded at 15-minute intervals for the pressure transducer and 1-hour intervals for the capacitance probe from April 2002 to September 2003. The capacitance probe was used as a backup for the pressure transducer and for potentially calculating water-surface slope at various stages through the reach.
The North Fish Creek streamgage was operated sporadically over 14 years from 1990 to 2003. About 6 years of data were missing from two periods, October 1991 to September 1994 and October 1997 to May 2000. During the 8-year combined period of available streamflow data (1990–91, 1995–97, and 2000–03), 17 flows greater than 900 ft3/s (stage of 10.0 ft and considered to be bankfull flow) were recorded (fig. 8A). Most of these flows occurred in the spring months; some were as little as 2 days apart, such as in April 2001 and April 2002, and others were about 1 year apart, such as from April 2001 to April 2002 (figs. 8A-D). The clustering of multiple floods within short spans of time within a year made it necessary to examine hydrographs based on stage data collected at 15-minute intervals. Because of the flashiness of North Fish Creek, use of annual time series or mean daily flow data would not have been adequate for monitoring and describing hydrologic conditions before, during, and after vane installation.
Streamflows larger than 1,520 ft3/s (stage of 12.0 ft and considered a flood by the National Weather Service) included two in 1991, four in 1996 (one in April and three clustered closely at the end of June and beginning of July), four in April 2001, and two in April/May 2002 (figs. 8A-C). These floods were caused by spring snowmelt, spring snowmelt combined with rainfall, and rainfall alone in the spring, summer, and fall. The typical duration for a flood from a single summer rainstorm is only about 2 days, with stages rising and falling sharply in less than 12 hours (figs. 8B-D). The hydrograph for April 10–18, 2002 (fig. 8C), reflects a combination of rainfall on snow (large peak) followed by snowmelt (smaller diurnal peaks).
A closer look at the spring floods from 2001 to 2003 gives an indication of the type of events that occurred after the vanes were installed (fig. 8B-D). After the vanes at site 16.4 were installed in summer 2000, a small rainstorm produced a below-bankfull flow of about 500 ft3/s in November 2000 (fig. 8A). The next flood was in April 2001 (fig. 8B), a record flood with an estimated recurrence interval of close to 100 years, based on flood-frequency regression equations for rural Wisconsin streams (Walker and Krug, 2003). On April 23, 2001, snowmelt combined with rainfall produced a peak flow of 3,420 ft3/s. This flood occurred 9 months after vanes were installed at site 16.4 and 5 months before the vanes were installed at site 12.2. The snowmelt with rainfall that caused this flood on North Fish Creek also caused the largest recorded floods in the Brule and Sioux Rivers, but flooding on the Bad River corresponded to only a 5- to 10-year recurrence interval (Walker and Krug, 2003). No floods occurred during the rest of 2001 (fig. 8A).
On April 11, 2002, a sequence of events similar to those that produced the April 2001 flood produced a peak flow of 2,290 ft3/s at the streamgage (fig. 8C). This flood had an estimated recurrence interval of 25–50 years (Walker and Krug, 2003). Two days later, additional rain on snow produced a second flow of about 1,500 ft3/s. April 2002 floods on the Brule, Sioux, and Bad Rivers were smaller than on North Fish Creek and had recurrence intervals of 5–10 years (Walker and Krug, 2003). As in 2001, no floods occurred in summer and fall 2002 (fig. 8A), except for an October rainstorm that produced a flow of about 1,000 ft3/s.
Peak flows for North Fish Creek in spring 2003 were small compared to spring 2001 and 2002, with no flows near flood stage (fig. 8A). Flows of 1,000 and 800 ft3/s occurred in April (the first from a fast snowmelt without rainfall and the second from a rainstorm), and two more rainfall-related flows of 1,300 to 1,000 ft3/s occurred in May (fig. 8D). Summer and early fall 2003 were flood free (fig. 8A).
A series of photographs of the channel and bluff at site 16.4 show how the site changed over 10 years in response to floods and the presence of the vanes (fig. 9). Photographs at site 16.4 extend back 7 years before the vanes were installed because the site was part of the previous geomorphic assessment of North Fish Creek (Fitzpatrick, 1998). Before vane installation, the face of the bluff changed over time as blocks of the top and upper part of the bluff failed, and failed debris built up along the bottom half of the bluff during low-flow periods between large floods (June 1994 as an example). During large floods, such as the April 1996 flood, loose sediment was removed from the lower half and toe of the bluff, making the bluff face more vertical (November 1996 as an example). The channel migrated toward the eroding bluff from 1993 to 2000 and formed a midchannel bar by 2000.
In April 2001 during the record flood event, a block failure occurred from the top of the bluff near cross-section 5 (figs. 9 and 10). The block remained at the toe of the bluff and was not washed away during the flood or any subsequent floods through September 2003. Boulders also fell from the upper half of the bluff and hit some of the vanes, bending them out of alignment (fig. 11). The damaged vanes were replaced in summer 2001.
Water levels at site 16.4 increased about 4 ft above normal stage during the April 2001 flood (fig. 12). After the flood, trash lines from the flood were observed in trees about 5 ft above normal stage. The stage reached an elevation of about 3.4 ft above the top of the vanes (Whitman, 2002). The stage recorder data also showed a rise in the channel bottom at the recorder location (inside of the bend near cross-section 4). The normal stage rose from between -1 and 0 ft in early April, to 0 ft by mid-April, and then to almost 1 ft after the April 23 flood. The stage recorder filled with sediment and stopped recording at the end of April.

At the streamgage 5.9 mi downstream, the stage increased 10 ft during the April 2001 flood from a normal level of about 7 ft to 17 ft. Stage increases at the streamgage are about 2.5 times those at site 16.4 because the drainage area at the streamgage is larger and the valley is constricted near the gage by a roadway embankment and bridge. During the April 2002 flood, the stage rose 3 ft at site 16.4, with a corresponding rise in stage of more than 7 ft at the streamgage (fig. 13). Whitman (2002) determined from correlation analysis that stage at the streamgage lagged about 2 hours behind stage at site 16.4.
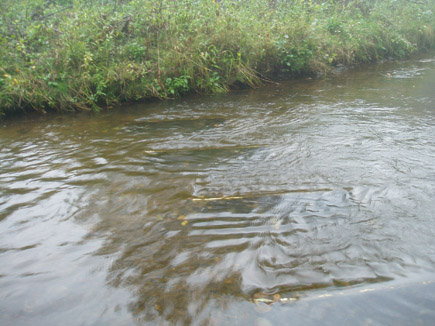
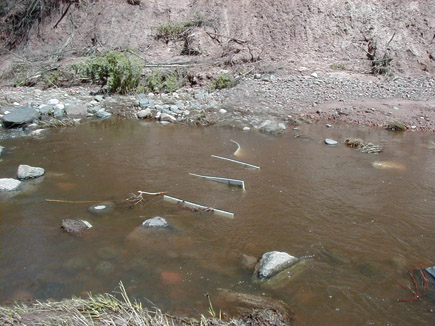
After the April 2001 flood, the bluff toe appeared to extend into the channel more than before the flood, and mass-wasted material from the top part of the bluff accumulated along the bluff toe. The channel had migrated toward the point-bar side, concurrent with erosion of the midchannel bar. A photo taken during the April 2003 snowmelt event (fig. 14) shows a natural foam trail (marking the center of flow) along the point-bar side and away from the bluff toe. The photo was taken on April 10, 2003, at 9 a.m. (a point on the rising limb of the flood hydrograph) at a stage of approximately 0.9 ft on the stage recorder.
Site 16.4
Results from surveys of the eight cross sections at site 16.4 from April 2000 to September 2003 are shown in figure 15. Similar to the photographs, the time series of cross sections also show channel migration toward the inside of the bend and point bar (left bank) after the April 2001 snowmelt/rainfall event. This event produced the most channel migration. From 2000 to 2003, erosion was measured on the inside of the bend and deposition was measured on the toe of the eroding bluff at cross-sections 1, 3, 4, 5, and 8. The channel location remained relatively constant at cross-section 2. Some material was lost from the lower part of the bluff at cross-section 4, but the bluff toe gained material. Erosion of the midchannel bar (upstream end) is shown in cross-section 5. At cross-section 6, no point-bar erosion was measured, but deposition was measured on the bluff toe. The channel at cross-section 7 became narrower and deeper, with some deposition on both sides.

Results from calculations of the volume of sediment eroded and deposited along each cross section from April 2000 to September 2003 are shown in table 3 for site 16.4. Approximately 1,610 ft3 of sediment was eroded from the point-bar side of the channel, and 10,660 ft3 of sediment was deposited at the base of the eroding bluff over the 361-ft long reach. The channel morphology at cross-section 5 changed the most of all the cross sections. This cross section is near where a block from the bluff top failed and was deposited at the base of the bluff during the April 2001 flood (fig. 10). Assuming that the density of the sediment (a mixture of sand, silt, and clay) is 80 lb/ft3 (U.S. Department of Agriculture Soil Conservation Service, 1983), about 425 tons of sediment was deposited along the bluff toe over the 3 years that were monitored. There was a total net gain in sediment in the monitored 361-ft reach of 6,740 ft3, or about 270 tons. This gain indicates that sediment from upstream sources was deposited in the reach. In addition, the reach is less of a potential source of sediment to downstream reaches, as shown in the series of photographs of the reach and bluff from before and after vane installation (fig. 9).
[A positive value (+) indicates a net gain (accretion) of sediment and a negative value (-) indicates a net loss (depletion) of sediment; na, not applicable]
| Cross section | Volume of sediment moved (cubic feet) | ||||
|---|---|---|---|---|---|
| Left bank (point bar) | Streambed | Bar | Right bank (bluff) | Total | |
| 1 | -676 | +375 | na | +168 | -133 |
| 2 | -63 | -238 | na | +278 | -23 |
| 3 | -353 | -3 | na | +736 | +381 |
| 4 | -158 | -191 | na | -1,409 | -1,757 |
| 5 | -364 | -448 | -924 | +6,839 | +5,103 |
| 6 | +111 | -299 | +40 | +3,074 | +2,926 |
| 7 | +188 | -351 | -202 | +491 | +125 |
| 8 | -299 | -69 | na | +485 | +117 |
| Total | -1,614 | -1,223 | -1,086 | +10,663 | +6,740 |
Surveys of the distances from eight reference points along the upland to the top edge of the bluff originally were done in 1994, during the geomorphic study of North Fish Creek (Fitzpatrick, 1998). These points were along the part of the bluff with minimal to no vegetation (longitudinal distance, measured along the top edge of the bluff, is about 300 ft). Distances from the reference points to the bluff edge were measured seven times from 2000 to 2003 (table 4). Negative changes in distance reflect a loss of material from the bluff top. The results from the surveys only were useful for determining the occurrence of large block failures from the top of the bluff because accuracy of the measurements was approximately 1.5 ft.
[A negative change in distance over time (-) indicates loss of sediment; a positive change in distance over time (+) indicates soil creep or expansion of tension cracks; ft, feet; ns, not surveyed; veg, vegetation; lg, large; %, percent; in, inch; diam, diameter; us, upstream; ds, downstream]
| Reference points | T3 | T4 | T5 | T6 | T7 | T8 | T11 | T9 |
|---|---|---|---|---|---|---|---|---|
| July 1994 | ||||||||
| Distance (ft) | 54.5 | 95.1 | 77.8 | 63.3 | 68.6 | 69.9 | ns | 65.0 |
| August 2000 | ||||||||
| Distance (ft) | 53.1 | 94.5 | 75.5 | 68.2 | 66.9 | 56.4 | ns | 65.0 |
| July 2001 | ||||||||
| Distance (ft) | 53.5 | 95.1 | 76.4 | 70.5 | 64.6 | 56.7 | 78.4 | 51.2 |
| Remarks | No erosion | No erosion | No erosion | Bluff slumped at top, hard to define edge | Us near lg block failure from 4/01 storm | Us near lg block failure from 4/01 storm, previous failure prior to 8/00 | Very unstable, 1-ft diam ash leaning and ready to fall, 3-ft us is source of block failure | Center of lg failure block from 4/01 storm |
| May 2002 | ||||||||
| Distance (ft) | 53.5 | 93.5 | 76.1 | 69.6 | 65.9 | 56.8 | 78.4 | 50.9 |
| Remarks | Stable, no loss of banks, vegetated | Some washout directly beneath bluff, mainly vegetated | Fir just below slope break, mainly vegetated | Unstable, toe eroded, few pieces of veg | Unstable, recent loss of block, no toe, no veg | Unstable angle, no veg, toe present | Very unstable, vertical drop | Very unstable, toe is building |
| August 2002 | ||||||||
| Distance (ft) | 53.8 | 91.5 | 76.8 | 68.6 | 66.3 | 57.4 | 78.1 | 50.9 |
| Remarks | No erosion | Some washout directly beneath bluff, 50% vegetated, stable toe, slump | 50% vegetated, stable toe, overhanging top | Sparse veg, seeps at the toe, unstable bluff angle | No change | Rills, tension cracks, toe with seeps and delta, unstable angle, overhang, creep | Overhanging edge, vertical slope, abundant rills, 2.5-in. diam fir leaning over, no veg | Similar to T11, rills common halfway down |
| April 2003 | ||||||||
| Distance (ft) | 53.8 | 92.2 | 76.4 | 68.9 | 65.3 | 57.1 | 79.1 | 51.5 |
| Remarks | Bluff is snow covered, vegetated, same, small gully, no change | No change, covered in snow | Bluff same, snow covered, fir in same spot, overhang same | One third snow, overhanging edge, toe with seeps, unstable angle | Vertical bluff, same, no veg, toe starting to build out, toe present at near bankfull stage | Completely vertical, mass wasted, still has overhang, no veg, no rills, no snow, good toe, recent debris, delta from seep | Unstable, vertical, same rills, possible upland piece fell in, us toe looks good, chunk still at base | Vertical, no veg, overhanging edge, stable toe, no rills, debris pile on toe |
| June 2003 | ||||||||
| Distance (ft) | ns | 93.5 | 76.8 | 68.2 | 66.9 | 55.4 | 73.5 | 51.5 |
| Remarks | Could not find rebar, bluff unchanged | 90% brush, washout directly below top, alder at top rotated out nearly horizontal | Bluff same, gully us slightly deeper | Same edge, vertical two thirds up, rills, gully just us, small pine on slump (20% vegetated) that makes upper third | Similar, 1.5 by 6.5 ft piece of bluff at top then near vertical face to flat toe, rills, 10% vegetated | Slumped at top, near vertical bluff face, no veg, no rills, blocky face | Unstable, vertical, recent slump on upper bluff, toe has rills from runoff and seeps, mass wasted blocks near top of bluff, us 33-ft block in place, mass wasted pine growing near toe | Overhanging edge, near vertical bluff, no veg, blocky face, mass wasting, debris pile on toe, 43 ft ds to vegetated bluff face |
| September 2003 | ||||||||
| Distance (ft) | ns | 92.9 | 75.1 | 67.9 | 65.9 | 55.1 | 72.8 | 50.5 |
| Remarks | No change | No change | Bluff same, more veg on us. gully, rounded lip of veg at slope break | No change | Piece of bluff top has fallen, toe developing, steep bluff face, 10% vegetated with yellow flowering plant, many rills | Overhang at top, near vertical face with rills, yellow flowering plant and moss grass growing from toe (20% vegetated), lg toe | Undercut at top bluff, mass wasted blocks near top of bluff are gone, recent mass wasting us of transect ~10 ft, pine and moss growing near toe | Recent erosion at top, very undercut lip, toe has recent debris covering moss/grass and veg, lots of sediment in stream, 42 ft distance ds to vegetated bluff face |
| Distance change (ft) before vane installation (1994-2000): | ||||||||
| -1.4 | -0.6 | -2.3 | +4.9 | -1.7 | -13.5 | ns | 0 | |
| Distance change (ft) after vane installation (2000-03): | ||||||||
| 1+0.7 | +1.6 | -0.4 | -0.3 | -1.0 | -1.3 | -5.6 | -14.5 | |
1 Calculated only through April 2003
Between 1994 and 2000, before vane installation, a 13.5-ft piece of the bluff top failed near the downstream end of the eroding bluff at reference point T8. Two points had differences in distance of 1.7 and 2.3 ft (T7 and T5, respectively) that may indicate small block failures from the bluff top. Two additional points had negative differences for 1994–2000 but were in the possible range of measurement error. Reference point T6 had a positive distance change; the top of the bluff is slumped at this location with some small breaks in slope, making it difficult to pinpoint the exact edge of the bluff top.
After vane installation, two blocks from the top of bluff failed, one during the April 2001 flood at T9 and another between April and June 2003 at T11. No other large block failures were measured; however, the near-vertical angle of the bluff face, tension cracks on the bluff top, rills along the bluff face, and overhanging vegetation on the downstream side of the bluff from T6 to T9 make it highly probable of more failures in the future.
A slope-stability model and a bank-toe-erodibility model were done for site 16.4 by Whitman (2002). Results indicated that the top part of the bluff is stable as long as the water table is greater than 33 ft below the bluff top. Model results also indicated that the bluff toe erodes even at low flow. The bluff may fail at flows with a corresponding stage more than 6.6 ft. Model-simulation results indicate that in order for the bluff to stabilize, the toe needs to be protected and built out so that slumped materials will remain in place. Flow-deflecting vanes appear to be an adequate technique at this site for protecting the toe by causing the channel to move toward the point bar. Additional monitoring of the water table would be needed to verify model-simulation results.
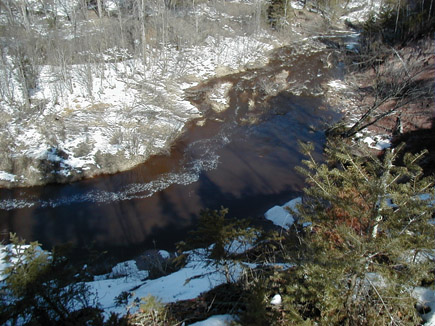
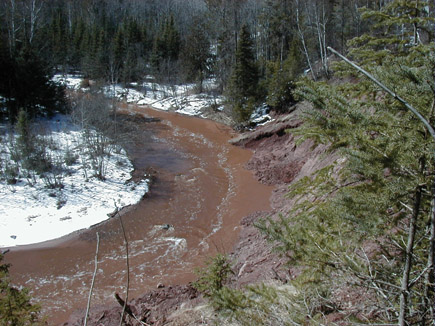
No previous geomorphic study was done at site 12.2, so the time period for the photos is much shorter than that for site 16.4 and starts in June 2001 (fig. 16). The photo vantage points at this site are not as encompassing or consistent as the vantage points at site 16.4. The photos show the upstream part of the bluff and bed. The eroding bluff face was virtually vertical to slightly convex from 2001 to 2003, with minimal or no vegetation. Rills were common in the face of the bluff, and the toe of the bluff was eroded.
After installation, two floods occurred that were greater than bankfull (in April and May 2002) and five floods occurred that were near bankfull (one in October 2002 and four in April and May 2003). During the first flood on April 11, 2002 (fig. 8), the stage at site 12.2 rose 4 ft above normal levels (fig. 13) compared to 3 ft at site 16.4 and 7 ft at the streamgage. As stated earlier, the April 2002 flood had a probability of occurrence of roughly 2 percent (recurrence interval of 50 years). The April 5, 2002, photo of the bluff was taken before the flood event (fig. 16).
The series of four floods in April and May 2003 were near or at bankfull. The stage rose about 2 ft during these events, compared to just below 2 ft at site 16.4 and about 4 ft at the streamgage. A photo taken during the first of these floods (April 10, 2003; from rapid snowmelt) shows the center of flow (concentration of natural foam) toward the left side of midchannel on the upstream side of the bluff, but near the eroding bluff toe at the downstream end of the bluff (fig. 14). This result was an indication that more vanes probably were needed. Vanes were added in array 14 and between arrays 8 and 9, 9 and 10, and 10 and 11 in summer and fall 2003. In addition, a vane was removed from array 15.
Results from the survey of the five cross sections at site 12.2 from June and August 2001 to September 2003 are shown in figure 17. The April and May 2002 floods caused erosion along the channel (left bank) at cross-section 1, deposition along the channel (left bank) at cross-section 2, erosion of the bluff toe at cross-section 4, and deposition along the left and center part of the channel at cross-section 5. Deposition occurred along the bluff toe at cross-section 3 after the April and May 2003 floods. The inside of the bend or point-bar side of the channel stayed in the same location at cross-section 1, with some erosion at cross-sections 2 and 3 after the April/May 2002 flood. Erosion on the point-bar side occurred between the May 2003 and September 2003 surveys at cross-section 4. The channel at cross-section 5 remained in the same location.
Results from the compilation of volume changes in the banks and channel from May 2002 to September 2003 indicate that the installation of the vanes at site 12.2 did not cause as much channel change as at site 16.4 (table 5). The channel (left bank) and bluff toe at cross-sections 2 and 3 had deposition, but the left bank of the channel and bluff toe eroded at cross-sections 1, 4, and 5, with a net erosion of 3,870 ft3 or about 155 tons (assuming an average sediment density of 80 lb/ft3). The channel incised at cross-section 2 as the thalweg moved away from the eroding bluff; however, sediment was deposited in the channel at cross-section 5, resulting in a negligible change in the amount of channel erosion or deposition for the entire reach. The point-bar eroded at cross-section 4 from channel widening; otherwise there were no detectable channel, left bank (bluff), or right bank (point bar) changes with more than 1,000 ft3 of sediment deposition or erosion.
[A positive value (+) indicates a net gain (accretion) of sediment and a negative value (-) indicates a net loss (depletion) of sediment.]
| Cross section | Volume of sediment moved (cubic feet) | |||
|---|---|---|---|---|
| Left bank (bluff) | Streambed | Right bank (point bar) | Total | |
| 1 | -1,459 | -97 | 0 | -1,556 |
| 2 | +3,586 | -1,726 | +282 | +2,142 |
| 3 | +1,148 | -592 | +325 | +880 |
| 4 | -7,072 | +882 | -847 | -7,037 |
| 5 | -72 | +1,878 | +990 | +2,795 |
| Total | -3,870 | +345 | +749 | -2,776 |
In contrast to site 16.4, there was net erosion (2,780 ft3 or 110 tons) in the 439-ft reach at site 12.2 (table 5). Part of the explanation for the contrasting results between the two sites may be that the vanes were installed at site 16.4 before the large April 2001 flood. This flood produced the largest changes in channel morphology at site 16.4; however, the vanes were installed after the April 2001 flood at site 12.2. Only two of the five cross sections at site 12.2 (cross-sections 2 and 3) have indications of deposition along the bluff toe, and the loss of bluff-toe material at cross-section 4 possibly indicated that more vane arrays were needed at the downstream end of the bluff to help build a bluff toe along the entire reach; as mentioned earlier, additional vanes were added in summer and fall 2003 in the center and downstream end of the bend. It is not known whether the amount of erosion has decreased or increased in this reach after vane installation.
Surveys of the distances from nine reference points along the upland to the top edge of the bluff started in May 2002 and continued through September 2003 (table 6). The reference points extend along the top edge of the mainly unvegetated part of the bluff, along a longitudinal distance of about 450 ft (fig. 6). No major block failures occurred during the short monitoring period (16 months); however, tension cracks at the top, overhanging vegetation at bluff top, unstable angle, and lack of a bluff toe along much of the bluff indicate the future potential for mass wasting and block failure.
Table 6. Bluff erosion monitoring results for site 12.2, North Fish Creek, Wis. from 2002 to 2003
[A negative change in distance over time (-) indicates loss of sediment; a positive change in distance over time (+) indicates soil creep or expansion of tension cracks; ft, feet; veg, vegetation; lg, large; us, upstream; ds, downstream; %, percent; <, less than]
| Reference Points | T1 | T2 | T3 | T4 | T5 | T6 | T7 | T8 | T9 |
|---|---|---|---|---|---|---|---|---|---|
| May 2002 | |||||||||
| Distance (ft) | 30.5 | 38.4 | 43.0 | 24.9 | 11.2 | 45.9 | 27.9 | 9.8 | 35.4 |
| Remarks | Veg, no bluff erosion | 50% veg, undercut at top | Not veg, undercut at top | 60% veg above slump, <50% veg below slump, undercut at top | Slump starting, unstable slope below, debris flow, toe forming | No veg, no toe, failure impending | No veg, unstable, vertical for bottom third | <10% veg on upper third, no veg below, no toe | General slope down, 30-40% veg |
| August 2002 | |||||||||
| Distance (ft) | 30.5 | 38.4 | 42.6 | 24.9 | 11.2 | 45.9 | 27.6 | 9.1 | 34.4 |
| Remarks | All veg | Undercut, 20% veg at top, 90% veg at bottom | Toe at bottom, lg overhang, big cracks on top half | Same slope, little veg | Veg slump at top, start of toe | Clean break at overhang, no veg, vertical | Slumping, 50% veg at break in slope | No change | No change |
| April 2003 | |||||||||
| Distance (ft) | 29.5 | 38.4 | 42.6 | 25.9 | 11.2 | 45.9 | 27.8 | 9.1 | 36.1 |
| Remarks | Gully at bottom has turbid flow | Same veg | Lg overhang still present, slump at base, flow not directed away | Toe present, but flow is right against toe | Slump at base, toe built out, 1% veg at top, lg boulder with debris | No toe, main flow at base of bluff, concave, unveg, unstable | No veg, deer trail more slumped, cracks on top third, gully in lower two thirds, flow against toe | Seep/wet at top along bluff face, deep rills with trickles, unstable and convex, eddy at bottom | Seep area (upper quarter), new gully in lower three quarters with trickle in it |
| June 2003 | |||||||||
| Distance (ft) | 31.8 | 37.7 | 42.0 | 25.9 | 10.8 | 45.9 | 28.2 | 9.8 | 37.1 |
| Remarks | Well veg | Same well veg | Lg overhang, same as before, slump at base now just remaining rock/dirt washed away | Sharp drop to slump with veg a quarter of the way down, steep unveg bluff face to flat toe | Slump with veg just below base, flat toe, lg boulder still in place | No toe, main flow at base of bluff, concave, unveg, unstable | Cracks with veg on top third, gully in lower two thirds, with debris fan partially washed away | Blocky mass wasting, unstable convex shape, no toe, near vertical at river, gullies us and ds of face | Seep area in upper quarter, new gully in lower three quarters, very wet |
| September 2003 | |||||||||
| Distance (ft) | 32.2 | 37.7 | 41.7 | 25.6 | 11.5 | 45.9 | 28.5 | 11.2 | 37.1 |
| Remarks | Well vegetated, maybe new sand from river at toe | Well vegetated | Lg overhang, slump at base, remaining rock has been filled in half with sand | Sharp drop to slump with veg a quarter of the way down, rest is near vertical and unvegetated face to flat toe, some slump is piled halfway down the face | Slump with veg near top, erosion at base, lg boulder now in river, lg flat toe created by debris from gully, no veg below lg blocks which came from the middle | Tip of bluff sticking out has slumped 2-3 ft at 42.3 ft and out-held in place by tree, slope near vertical halfway down, little veg, no toe | Small alder at slope break is holding bluff, but erosion has removed deer trail on both sides, cracks with veg on top third, gully bottom 2/3 is deeper and more debris fan has washed | Recent blocky mass wasting, unstable convex shape, 5% veg on top third, no veg and near vertical lower two thirds, flat toe at water surface | Near vertical drop at alder clump at top slope break, gentle fault bowl is seep area (upper quarter), 27 ft across bowl to start of gully (lower ¾) that extends from T8, debris fan at base of gully |
| Distance change (ft) after vane installation (2002-03) | |||||||||
| 1.7 | -0.7 | -1.3 | 0.7 | 0.3 | 0 | 0.6 | 1.4 | 1.7 | |
The installation of vanes for this study has created opportunities for future investigations. Channel morphology, bluff erosion, and streamflow on North Fish Creek could continue to be monitored to further evaluate the positive and negative effects from large floods, the longevity of the vanes, and the possible need for maintenance and replacement of the vanes. Additional cross sections could be established at site 12.2 to better monitor changes in channel conditions on the downstream end of the bend. Future monitoring efforts could include more accurate measurements of mass wasting from the bluffs by extending the cross sections from the channel surveys up the bluff face as far as safely possible. Improvements to bluff erosion monitoring could be made by surveying the land surface from the reference point to the edge of the bluff, and down the bluff face as far as safely possible. Sediment-load sampling during flood events could be done at the streamgage and compared to previous sediment-load data to determine whether sediment loads have changed because of the vane installation.
Another possible extension of the current study would be installation and monitoring of vanes at other appropriate sites on North Fish Creek and other Wisconsin tributaries to Lake Superior with similar erosion problems. At these sites, different array spacing, vane angles, dimensions, shapes, and materials could be investigated. The effectiveness and longevity of vanes made out of natural materials could be studied. Changes in the direction of flow and effectiveness of vortex fields caused by the vanes could be measured by use of a three-dimensional acoustic Doppler velocity meter suitable for shallow water (1–3 ft deep). These data could be used to determine the optimum spacing, angle, dimension, and shape of the vanes.
Piezometers could be installed to measure water-table changes in the bluffs. Water-table data could be used to improve the accuracy of the results from the bank-stability model. Mass-wasting, sloughing, and bluff erosion occurs episodically; this requires observations over long periods (decades) to determine erosion rates.
Flow-deflecting vanes were installed in the streambed at two eroding bluff sites along the upper main stem of North Fish Creek, Wis. The vanes were designed to deflect flow away from the base of the bluff and reduce bank erosion. Vanes were installed in 2000 at site 16.4 (16.4 river miles upstream of the mouth) and in 2001 at site 12.2 (12.2 river miles upstream of the mouth). The demonstration study was done through a cooperative effort by the UW-Madison, who mainly did the design and installation, the USGS, who mainly did the monitoring, and the DNR, who provided the funding. Monitoring consisted of repeated channel cross-section and bluff-erosion surveys, and streamflow and stage monitoring before, during, and after vane installation through September 2003. This report describes the monitoring results at both sites from vane installation through September 2003.
The vanes survived the April 2001 flood (recurrence interval of approximately 100 years) at site 16.4 and the April and May 2002 floods (recurrence intervals of approximately 50 years) at both sites. The vanes at both sites required some maintenance and replacement after the floods. After the April and May 2002 floods, five near-bankfull or at-bankfull floods occurred (one in October 2002 and four in April and May 2003).
At site 16.4, channel cross-section data from 2000 to 2003 indicate that the vanes have caused the channel to move away from the base of the bluff (outside of the bend) and toward the point bar (inside of the bend), allowing sediment to deposit at the base of the bluff. Much of the channel-morphology change resulted from the April 2001 flood. Over the entire monitoring period (2000–03), the 361-ft reach at site 16.4 had a net gain of 6,740 ft3 of sediment. Deposition along the base of the bluff was 10,660 ft3, mainly through the downstream half of the reach. In contrast, the left-bank or point bar side of the channel (1,610 ft3), channel streambed (1,220 ft3), and a midchannel bar (1,090 ft3) eroded.
Less change in channel morphology was measured at site 12.2 than at site 16.4, which had a net loss of sediment through the 439-ft reach of 2,780 ft3. The main volume of sediment was lost from the bluff toe at cross-section 4 near the downstream end of the bend (7,040 ft3). Two cross sections showed a net gain in sediment along the bluff toe near the upstream side of the reach. The net gain along the point-bar side of the reach was 750 ft3. Channel changes at site 12.2 have been less than at site 16.4 most likely because the vanes were installed in the summer of 2001 after the April 2001 flood and the monitoring period for site 12.2 (2001-03) is shorter than for site 16.4 (2000–03).
Bluff erosion data from both sites indicate that mass wasting is episodic and will likely occur for decades or more even after an adequate bluff toe has been established. Long-term monitoring data (observations that span decades) are needed to determine accurate bluff erosion rates. However, the extension of the bluff toe from vane installation should help to hold mass-wasted material from above and eventually allow the bluff to become more vegetated over time.
The monitoring results from this study indicate the importance of monitoring hydrologic conditions, as well as channel-morphology changes after use of erosion-control techniques. Much of the channel-morphology change and channel migration resulted from large floods, with minimal or small changes during bankfull flows. The vanes at site 16.4 withstood a record flood with only minor damage and initiated channel migration away from the eroding bluff; thus, this technique for toe stabilization is useful for reducing bluff erosion in flashy, high-energy, meandering streams.
If monitoring continues at site 16.4, investigators could determine whether the observed expansion of the bluff toe is a permanent feature or whether future floods erode the toe. If monitoring continues at site 12.2, investigators could determine whether additional vanes and time will help reduce bluff toe erosion. Vanes at both sites also could be checked after floods for maintenance or replacement needs.
Vane installation and channel and bluff monitoring would not have been possible without the help of numerous able and willing students from the CEE Department of the UW-Madison, personnel at the WDNR and USGS, and volunteers from county, State, and Federal agencies in Wisconsin. We are especially appreciative of all the time and commitment given by David Poggi (UW-Madison, Wis.) for vane installation and cross-section surveys. Bernard Lenz (USGS, Rice Lake, Wis.), David Housner (USGS, Middleton, Wis.), Krista Stensvold (USGS, Middleton, Wis.), and Ryan Jirik (USGS, Middleton, Wis.) assisted with vane installation, cross-section surveys, and collection of stage data. Andrew Veine, Kent Brander, Matt Hoffmann, Joshua Katt, Michael Schwar, Jay Stahl, Todd Shoemaker, Matthew Van Lieshout, and Yang Yang (all current or former UW-Madison students) assisted with vane installation and cross-section surveys. James Kennedy (USGS, Middleton, Wis.) assisted with cross-section surveys. Thomas Popowski (USGS, Rice Lake, Wis.) operated and maintained the streamgage. Dennis Pratt (WDNR, Superior, Wis.) provided assistance with site selection and insights about fish habitat and spawning.
The efforts of Kimberly Walz (WDNR, Madison, Wis.) in project management and grant writing are greatly appreciated. Professor Kenneth Potter (UW-Madison) helped with proposal writing.
The authors are very appreciative of access to site 16.4 granted by Mr. Robert Dufek and to site 12.2 granted by Mr. Andrew Mihalek and Mr. Gary Johanik.
Technical reviews by Janet Curran (USGS, Anchorage, Alaska) and Bernard Lenz (USGS, Rice Lake, Wis.) greatly improved the content of this report. Leah Hout and Michael Eberle (USGS, Columbus, Ohio) did the editorial review. Michelle Greenwood, Susan Jones, and Jennifer Bruce (USGS, Middleton, Wis.) completed the final report layouts.
Buchanan, T. J., and Somers, W.P., 1984, Discharge measurements at gaging stations: U.S. Geological Survey Techniques of Water-Resources Investigations, book 3, chap. A8, 65 p.
Clayton, Lee, 1984, Pleistocene geology of the Superior Region, Wisconsin: Wisconsin Geological and Natural History Survey Information Circular 46, 40 p.
Eichenlaub, V.L., 1979, Weather and climate of the Great Lakes region: Notre Dame, Ind., University of Notre Dame Press, 335 p.
Fitzpatrick, F.A., 1998, Geomorphic and hydrologic responses to vegetation, climate, and base level changes, North Fish Creek, Wisconsin: Madison, Wis., University of Wisconsin-Madison, Ph.D. dissertation, 275 p.
Fitzpatrick, F.A., Waite, I.R., D'Arconte, P.J., Meador, M.R., Maupin, M.A., and Gurtz, M.E., 1998, Revised methods for characterizing stream habitat in the National Water-Quality Assessment Program: U.S. Geological Survey Water-Resources Investigations Report 98-4052, 67 p.
Fitzpatrick, F.A., Knox, J.C., and Whitman, H.E., 1999, Effects of historical land-cover changes on flooding and sedimentation, North Fish Creek, Wisconsin: U.S. Geological Survey Water-Resources Investigations Report 99-4083, 12 p.
Harrelson, C.C., Rawlins, C.L., and Potyondy, J.P., 1994, Stream channel reference sites: an illustrated guide to field technique: U.S. Department of Agriculture, Forest Service, General Technical Report RM-245, 31 p.
Highland, Lynn, 2004, Landslide types and processes: U.S. Geological Survey Fact Sheet 2004-3072, 4 p.
Hoopes, J.A., Boomstra, B.R., Burmeister, E.M., Dussaillant, A., Horton, C.L., Hrzic, M.A., Lee, C., Roerish, E.D., and Schwar, M.T., 1999, Channel realignment and bank protection in Pheasant Branch Creek, Middleton, WI: Civil and Environmental Engineering Department, University of Wisconsin – Madison, Unpublished Sediment Engineering Class Project Report, 15 p.
Krug, W.R., Conger, D.H., and Gebert, W.A., 1992, Flood-frequency characteristics of Wisconsin streams: U.S. Geological Survey Water-Resources Investigations Report 91-4128, 185 p.
Odgaard, A.J. and Kennedy, J.F., 1983, River-bend protection by submerged vanes: Journal of Hydrologic Engineering, American Society of Civil Engineers, v. 109, no. 8, p. 1161-1173.
Odgaard, A.J., and Mosconi, C.E., 1987, Streambank protection by submerged vanes: Journal of Hydrologic Engineering, American Society of Civil Engineers, v. 113, no. 4, p. 520-536.
Odgaard, A.J., and Wang, Y., 1991a, Sediment management with submerged vanes, volume I, theory: Journal of Hydrologic Engineering, American Society of Civil Engineers, v. 117, no. 3, p. 267-283.
Odgaard, A.J. and Wang, Y., 1991b, Sediment management with submerged vanes, volume II, applications: Journal of Hydrologic Engineering, American Society of Civil Engineers, v. 117, no. 3, p. 284-302.
Reese, H.M., Lillesand, T., Nagel, D.E., Stewart, J.S., Goldmann, R.A., Simmons, T.E., Chipman, J.W., and Tessar, P.A., 2002, Statewide land cover derived from multiseasonal Landstat TM data—A retrospective of the WISCLAND project: Remote Sensing of the Environment, v. 82, p. 224-237.
Robertson, D.M., 1996, Use of frequency-volume analyses to estimate regionalized yields and loads of sediment, phosphorus, and polychlorinated biphenyls to Lakes Michigan and Superior: U.S. Geological Survey Water-Resources Investigations Report 96-4092, 47 p.
Rose, W.J., and Graczyk, D.J., 1996, Sediment transport, particle size, and loads in North Fish Creek in Bayfield County, Wisconsin, water years 1990–91: U.S. Geological Survey Water-Resources Investigations Report 95-4222, 18 p.
U.S. Department of Agriculture, Soil Conservation Service, 1983, National engineering handbook, Section 3, Sedimentation: Report 210-VI-NEH-03, variable pagination.
Walker, J.F., and Krug, W.R., 2003, Flood-frequency characteristics of Wisconsin streams: Water-Resources Investigations Report 03-4250, 37 p., 2 pl.
Whitman [Schwar], H.E., 2002, Demonstration of the effect of submerged vanes on bluff erosion and channel characteristics at North Fish Creek, Wisconsin: Madison, Wis., University of Wisconsin–Madison, Independent Study Report for Master of Science Degree, 198 p.
Young, H.L., and Skinner, E.L., 1974, Water resources of Wisconsin-Lake Superior Basin: U.S. Geological Survey Hydrologic Investigations Atlas HA-524, 3 sheets, scale 1:1,000,000.
Document Accessibility: Adobe Systems Incorporated has information about PDFs and the visually impaired. This information provides tools to help make PDF files accessible. These tools convert Adobe PDF documents into HTML or ASCII text, which then can be read by a number of common screen-reading programs that synthesize text as audible speech. In addition, an accessible version of Acrobat Reader 6.0, which contains support for screen readers, is available. These tools and the accessible reader may be obtained free from Adobe at Adobe Access.
| AccessibilityFOIAPrivacyPolicies and Notices | |
 |
|