
Tannins and Terpenoids as Major Precursors
Implications for Molecular Models and Conclusions about Precursors
Figure 1. Map showing location of the Suwannee River sample site (map modif...
Figure 2. Graphs showing fraction masses recovered from two-stage normal an...
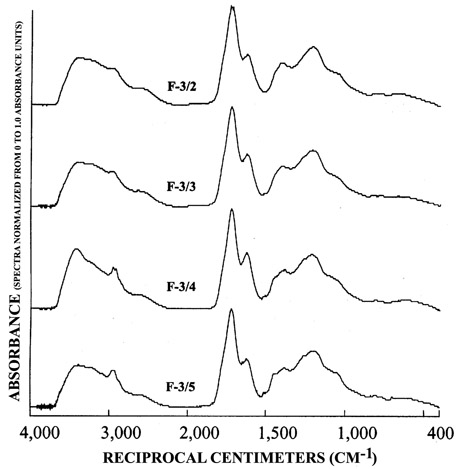
Figure 3. Graphs showing infrared spectra of subfractions recovered from si...
Figure 4. Graphs showing infrared spectra of subfractions recovered from re...
Figure 5. Graphs showing infrared spectra of subfractions recovered from re...
Figure 6. Graphs showing infrared spectra of subfractions recovered from re...
Figure 7. Graphs showing infrared spectra of subfractions recovered from re...
Figure 8. Graphs showing 13C-NMR spectra of selected major subfractions rec...
Figure 9. Graphs showing 13C-NMR dipolar-dephased spectra of selected major...
Figure 10. Graphs showing 13C-NMR spectra of subfractions recovered from re...
Figure 11. Graphs showing 13C-NMR spectra of subfractions recovered from re...
Figure 12. Graphs showing 13C-NMR spectra of subfractions recovered from re...
Figure 13. Graphs showing 13C-NMR spectra of subfractions recovered from r...
Figure 14. Graphs showing 13C-NMR spectra of subfractions recovered from re...
Figure 15. Graph showing 13C-NMR spectra of SRFA fraction SI-7.
Figure 16. Graphs showing 13C-NMR dipolar-dephased spectra of subfractions ...
Figure 17. Graphs showing 13C-NMR dipolar-dephased spectra of subfractions ...
Figure 18. Graphs showing 13C-NMR dipolar-dephased spectra of subfractions ...
Figure 19. Graphs showing 13C-NMR dipolar-dephased spectra of subfractions ...
Figure 20. Graphs showing 13C-NMR dipolar-dephased spectra of subfractions ...
Figure 21. Graphs showing 13C-NMR spectra of unfractionated Suwannee River ...
Figure 22. Diagram showing structural models of selected subfractions of Su...
Table 1. Fraction designations, eluent composition, and eluent volumes.
Table 2. Data used to determine structural characteristics of selected SRFA subfractions.
1U.S. Geological Survey
Suwannee River fulvic acid (SRFA) was fractionated into 7 fractions by normal-phase chromatography on silica gel followed by reverse-phase fractionation on XAD-8 resin that produced 18 subfractions. Selected major subfractions were characterized by 13C-nuclear magnetic resonance (NMR), infrared spectrometry, and elemental analyses. 13C-NMR spectra of the subfractions were more indicative of precursor structures than unfractionated SRFA, and gave spectral profiles that indicated SRFA mass was about equally split between tannin precursors and terpenoid precursors. Lignin precursors were minor components. Synthesis of 13C-NMR data with elemental data for subfractions derived from both tannin and terpenoid precursors revealed high ring contents and low numbers of carbon per rings which is indicative of fused ring structures that are extensively substituted with carboxyl and methyl groups. These results ruled out extended chain structures for SRFA. This information is useful for determining sources and properties of fulvic acid in drinking water supplies as tannins are more reactive with chlorine to produce undesirable disinfection by-products than are terpenoids.
Suwannee River fulvic acid (SRFA) is likely the most studied aquatic humic substance since a large sample was isolated in 1982, (Malcolm and others, 1994) and was adopted, distributed, and sold by the International Humic Substances Society (IHSS) as a standard fulvic acid for various scientific studies. The IHSS and other SRFA samples have been used for basic structural studies (Averett and others, 1994), for non-polar organic contaminant binding interactions (Chiou and others, 1987), for metal-binding interactions (Brown and others, 1999), and for production of disinfection by-products (DBPs) (Croué and others, 2000). These and other studies too numerous to reference would benefit by a better understanding of organic precursor structures and diagenetic processes that result in aquatic fulvic acid so that reactivity and reaction mechanisms can be better elucidated. Tannins are more reactive with chlorine to produce undesirable disinfection by-products than are terpenoids (Larson and Weber, 1994). This information can aid water managers in determining sources of aquatic fulvic acids in drinking water supplies and in design of drinking-water-treatment processes specific to waters containing aquatic fulvic acid.
The prevailing viewpoint of the origin of terrestrial aquatic humic substances is that they are derived from lignin. This viewpoint is derived from the application of various degradation procedures such as alkaline cupric oxide oxidation (Ertel and others, 1984), a comparative study of cupric oxide, chlorine, permangante oxidations and alkaline hydrolysis (Sonnenberg and others, 1989); and thermochemolysis with tetramethylammonium hydroxide (del Rio and Hatcher, 1995) in which phenolic carboxylic acids oxidation products were derived from aquatic humic substances that were similar in structure to oxidation products derived from lignin. A recent non-degradative study of SRFA (Kujawinski and others, 2002) that used high-resolution mass spectrometry seemed to confirm the lignin hypothesis origin, because many peaks in the SRFA sample occurred at exactly the same mass as peaks in an extract of a degraded wood lignin.
The lignin origin hypothesis, however, is still open to some questions about lignin comprising the bulk of aquatic fulvic acid derived from terrestrial sources. 1) Do the small percentages of identified fulvic acid fragments from degradative procedures represent the whole sample? 2) Do tannins that are isomerically similar to lignins, give similar degradation products and similar mass ions in mass spectrometric studies? 3) Why should lignin degradation products predominate over tannin degradation products when parent lignins are insoluble and tannins are soluble in water? 4.) The recent finding that terpenoids are major precursors of certain aquatic fulvic acid also showed that pyrolysis and thermochemolysis degradative procedures failed to give diagnostic information regarding this class of compounds (Leenheer and others, 2003), which begs the question of missing precursor compounds.
Tannins derived from plants consist of two types, hydrolyzable and condensed tannins. Hydrolyzable tannins consists of gallic acid esterified to sugars such as glucose, and condensed tannins are three-ring flavonols units that are polymerized and conjugated to other plant components such as carbohydrates and terpenoids (Robinson, 1980). Lignin is the most abundant natural polyphenol polymer in wood, but tannins are more abundant in leaves and needles with contents as high as 20 percent (Hernes and others, 2001). Natural polyphenols are substituted at the 4; 3,4; and 3,4,5 positions on aromatic rings of lignin and also with the B ring (note structure in report title) of condensed tannnis, and at the 3,4,5 position of hydrolyzable tannins. The A ring (note structure in report title ) of condensed tannins is different, with aromatic phenol and phenolic ethers being substituted at the 5,7,9 positions, a meta substitution pattern. This difference can be exploited to differentiate tannins from lignin precursors.
The objective of this report is to describe structural studies selected to identify specific structures indicative of organic precursors in the bulk SRFA sample. These techniques (infrared spectrometry, 13C-nuclear magnetic resonance (NMR) spectrometry, and elemental analyses) are selected to provide quantitative structural information. The complex mixture of SRFA components is simplified by first performing normal-phase chromatography using silica gel, followed by reverse-phase chromatography using XAD-8 resin. This two-stage fractionation was done to better resolve spectral peaks and more specific elemental composition in the fractions that gave diagnostic information about organic precursors.
The Suwannee River was sampled at its origin at the outlet of the Okefenokee Swamp near Fargo, Georgia, in November 1983 (fig 1). Onsite, 8104 liters (L) of water were processed through a filtration and column-adsorption system that fractionated and isolated organic solutes into hydrophobic-neutral, strong hydrophobic fulvic acid, weak hydrophobic fulvic acid, hydrophilic acid, and hydrophilic-neutral fractions (Leenheer and Noyes, 1984). The strong hydrophobic acid fraction, designated in this report as Suwannee River fulvic acid (SRFA), constituted 66 percent of the dissolved organic carbon concentration which was 38.4 milligrams per liter (mg/L) at the time of sampling.
Silica gel, 40-150 mesh, obtained from Woelm Pharma, was packed dry in a 110 cubic centimeter (cc) bed volume glass chromatographic column 1.6 centimeter (cm) internal diameter (ID) by 55 cm long. The silica gel was deactivated by pumping 100 milliliters (mL) of 75 percent acetonitrile (ACN)/25 percent water (H2O) through the column. This was followed by 200 mL of methylene chloride. The SRFA sample (3.47 grams) was dissolved in 10 mL of 75 percent ACN/25 percent H2O and this solution was applied to the column. The seven fractions were eluted with solvents of increasing polarity: Si-1, 1 L methylene chloride; Si-2, 1 L ethyl acetate; Si-3, 1 L ACN; Si-4, 1 L 95 percent ACN/5 percent water (H2O), Si-5, 1 L 90 percent ACN/10m percent H2O; Si-6, 1 L of 75 percent ACN/25percent H2O, and Si-7, 0.5 L 75 percent ACN/25 percent H2O containing 0.25 molar (M) oxalic acid. Fractions Si-1 to Si-6 were recovered by vacuum-rotary evaporation of the solvents. The fractions were dissolved in water, freeze-dried, and weighed. Fraction Si-7 was subjected to an additional adsorption/desorption step on XAD-8 resin to remove the oxalic acid.
Table 1. Fraction designations, eluent composition, and eluent volumes.
[F, fraction; 2/1, fraction number from silica gel, and subfraction number from XAD-8 resin; percent; L, liter]
| Fraction from silica gel (normal-phase fractionation) | Subfraction from XAD-8 resin (reverse-phase fractionation) | Eluent Composition (Percent acetonitrile in water acidified to pH 2 with formic acid) | Eluent Volume (Liters) |
|---|---|---|---|
| Si-2 | F 2/1 | 10% | 2 L |
| F 2/2 | 15% | 2 L | |
| F 2/3 | 20% | 2 L | |
| F 2/4 | 30% | 2 L | |
| F 2/5 | 75% | 0.5 L | |
| Si-3 | F 3/1 | 0% | 0.35 L |
| F 3/2 | 10% | 0.4 L | |
| F 3/3 | 15% | 0.4 L | |
| F 3/4 | 25% | 0.4 L | |
| F 3/5 | 75% | 0.2 L | |
| Si-4 | F 4/1 | 0% | 2 L |
| F 4/2 | 5% | 2 L | |
| F 4/3 | 10% | 2 L | |
| F 4/4 | 15% | 2 L | |
| F 4/5 | 20% | 2 L | |
| F 4/6 | 75% | 0.5 L | |
| Si-5 | F 5/1 | 0% | 0.5 L |
| F 5/2 | 15% | 0.4 L | |
| F 5/3 | 25% | 0.4 L | |
| F 5/4 | 75% | 0.2 L | |
| Si-6 | F-6/1 | 0% | 0.4 L |
| F 6/2 | 20% | 0.4 L | |
| F 6/3 | 75% | 0.2 L |
Two glass chromatography columns filled with Amberlite XAD-8 resin, a macroporous methylmethacrylate polymer, were used to fractionate the fractions eluted from the silica gel column into subfractions: Column A (5 cm ID by 30 cm long) has a bed volume of 589 cc and was used to fractionate the larger mass fractions (Si-2 and Si-4). Column B (3 cm ID by 30 cm long) has a bed volume is 212 cc and was used to fractionate the smaller mass fractions (Si-3, Si-5, and Si-6). Fractions Si-1 and Si-7 were not fractionated because of their small mass. Fractions applied to column A were dissolved in 500 mL H2O acidified to pH 2 with formic acid, and fractions applied to column B were dissolved in 250 mL H2O acidified to pH 2 with formic acid. These samples were pumped through the columns to adsorb the fractions on the XAD-8 resin. The XAD-8 column eluent composition, eluent volumes, and subfraction designations are given in table 1. The fractions were concentrated by vacuum-rotary evaporation of the solvents followed by freeze-drying and weighing of the fractions.
Infrared spectra were collected by using 2 to 5 milligrams (mg) of SRFA fraction and subfractions isolates in KBr pellets. The Perkin Elmer System 2000 FT-IR used an infrared source with a pulsed laser carrier and a deuterated triglycine sulfate detector. The instrument was scanned from 4,000 to 400 reciprocal centimeters (cm-1) averaging 10 scans at 1.0 cm-1 intervals with a resolution of 4.0 cm-1. All spectra were normalized after acquisition to a maximum absorbance of 1.0 for comparative purposes. Cross polarization magic angle spinning (CPMAS) 13C-NMR spectra were obtained on 20 to 200 mg of SRFA fractions. Freeze-dried samples were packed in zirconia rotors. CPMAS 13C-NMR spectra were obtained on a 200-megahertz Chemagnetics CMX spectrometer with a 7.5-millimeter-diameter probe. The spinning rate was 5,000 hertz. The acquisition parameters included a contact time of 5 milliseconds (ms), pulse delay of 1 second (s), and a pulse width of 4.5 microseconds (µs) for the 90o pulse. The dipolar dephased spectra of SRFA fractions used a 1 ms contact time and a coupling time of 30 µs.
Elemental analyses were conducted by Huffman Laboratories, (Golden, Colorado). Elemental analyses (C, H, O, N, and ash) of selected SRFA subfractions were conducted according to reported methods (Huffman and Stuber, 1985).
SRFA fractions from the normal-phase fractionation and subfractions from the reverse-phase fractionation were analyzed to determine major precursors. These analyses indicate whether tannins and terpenoids are more important precursors than lignin in SRFA.
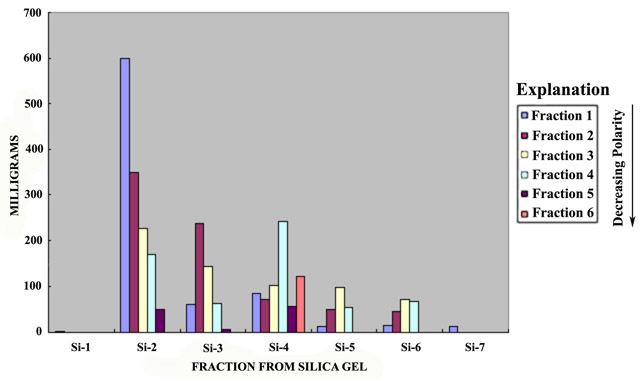
A bar diagram of the two-stage SRFA fractionation is presented in figure 2. Fraction recovery was 91.5 percent from the normal phase fractionation on silica gel, and 95.0 percent from the subsequent reverse phase fractionation on XAD-8 resin for an overall recovery of 86.9 percent. The Si-2 fraction was the largest, constituting 47 percent of the mass; only 1.5 mg was recovered in the Si-1 fraction.
The infrared (IR) spectra of the silica-gel fractionation are presented in figure 3A. Fraction Si-1 (most nonpolar) is rich in aliphatic hydrocarbon structures (peaks at 2,963, 2,934, 1,459, and 1,384 cm-1) and esters (peaks at 1,774 and 1,725 cm-1). The 1,774 cm-1 ester peak likely indicates five-membered ring lactones of natural origin, whereas the 1,725 cm-1 ester peak is accompanied by peaks at 1,287, 1,125, and 1,075 cm-1 that are indicative of phthalate ester contaminants likely leached from plastic components during sampling and processing. The Si-1 fraction contains most of the volatile "tea-like" fragrance of the SRFA.
Fractions Si-2 to Si-7 produced similar infrared spectra with increasing intensity of the broad peak at 1,620 cm-1 in progression from fraction Si-2 to Si-6. This peak has been assigned to aromatic double bonds and hydrogen-bonded conjugated ketones in humic substances (Stevenson, 1994). The strong carbonyl peak near 1,720 cm-1 accompanied by the broad shoulder near 2,500 cm-1 is characteristic of carboxylic acids. Subtraction of spectra (not shown) revealed an ester shoulder near 1,780 cm-1, characteristic of five-membered lactones that were the most intense in the Si-2 fraction and progressively decreased in the later fractions.
The infrared spectra of the reverse phase fractionation are presented in figure 3B and figures 4 to 7. Peaks indicative of aliphatic hydrocarbon (2,920 to 2,980 cm-1) and aromatic hydrocarbon (1,620 cm-1) structures increased as the fraction number increased. This progression was expected because in reverse-phase fractionations polar structures rich in carboxylic acids and alcohols elute before nonpolar structures rich in hydrocarbon structures. Fractions 5/1 (fig. 6) and 6/1 (fig. 7) also contained peaks indicative of amino acids and peptides, with the peak near 3,200 cm-1 assigned to the N-H stretch, and the peak near 1,600 cm-1 assigned to the carbonyl stretch of the carboxylate zwitterions.
The 13C-NMR spectra of selected subfractions of SRFA are shown in figure 8, and the dipolar-dephased spectra of these subfractions are shown in figure 9. The subfractions were selected to represent the mass range of SRFA shown in figure 2.
There are major compositional differences between the Si-2 subfraction isolates, which represent nearly half the mass of SRFA, and the higher-numbered silica-gel subfractions. Both the normal and dipolar-dephased 13C-NMR spectra for the Si-2 subfractions are typical for fulvic acid recently reported (Leenheer and others, 2003) to be derived from terpenoid precursors. The aliphatic hydrocarbon peak at 0-60 parts per million (ppm) is resolved into two peaks with the peak near 20 ppm assigned to branched methyl groups and the peak near 45 ppm assigned to methine and quaternary carbons (shown in the dipolar-dephased spectra) that typify highly branched and ring structures of terpenoids. The aliphatic quaternary carbon peak at 45 ppm in the dipolar-dephased spectra (fig. 9) is unique to the Si-2 subfractions. The C-O region (60-100 ppm) has a significant quaternary C-O peak near 85 ppm (fig. 9) that is attributed to lactone esters of tertiary alcohols in the terpenoid structure (Leenheer and others, 2003). The aromatic carbon peak (100-160 ppm, subfraction 2/4 of fig. 8) only has small subpeaks caused by phenolic structures (140-160, 105-120 ppm) that are prominent in lignins and tannins. Much of the aromatic ring is substituted with C-C linkages (peak near 130 ppm, subfraction 2/4 of fig. 9). The peak at 105 ppm in figure 9 may be caused by quaternary anomeric carbon of ketals or lactols, or by a C-substituted aromatic structure between meta-substituted aromatic C-O linkages as found in substituted phloroglucinol rings (Wershaw and others, 2000). Naturally occurring phloroglucinol derivatives of terpenoids occur in a wide variety of plants in compounds such as humulone, which is one of the bitter substances found in hops (Robinson, 1980).
Subfractions derived from fractions Si-3 to Si-6 (fig. 8) have lesser amounts of the branched methyl peak at 20 ppm, and the aromatic carbon region has prominent subpeaks near 153 and 105 ppm that are characteristic of plant condensed tannins (Benner and others, 1990; Preston and Sayer, 1992, Preston and others, 1997; Wilson and Hatcher, 1988). The most diagnostic peak for condensed tannins is the 105 ppm peak in the dipolar dephased spectra of figure 9, that is a quaternary C-C linkage between meta-substituted C-O linkages in the A-ring of condensed tannins. Lignins lack this substituted C-C linkage at 105 ppm although syringyl lignins have protonated C-2 and C-6 carbons near 105 ppm that are detected in normal CPMAS 13C-NMR spectra (Preston and others, 1997). The dipolar dephased spectra of subfractions derived from fractions Si-3 to Si-6 (fig. 9) all show the distinct 105-ppm peak characteristic of condensed tannins, and this peak cannot be attributed to ketal anomeric carbons of carbohydrates due to insufficient concentrations of alcohols from 60-90 ppm, as shown in the spectrum of fraction 6/3 (fig. 8).
The normal 13C-NMR spectra of the reverse-phase subfractions of each silica fraction are presented in figures 10 to 15, and the dipolar-dephased spectra are presented in figures 16 to 20. Peaks indicative of aliphatic hydrocarbon (0-60 ppm) and aromatic hydrocarbon (100-160 ppm) structures increased as the fraction number increased, which is expected in the polar-to-nonpolar progression of reverse phase fractions. The increase in aromatic carbon content was much greater than the increase in aliphatic carbon content for the fulvic acid fractions derived from condensed tannins.
Figure 15. Graph showing 13C-NMR spectra of SRFA fraction SI-7.

At this point in the discussion of 13C-NMR results, the question about why previous investigators (including the authors of this report) did not report terpenoid and tannin structures in SRFA should be addressed. The first answer to this question is the lack of fractionation studies of SRFA. Structural models of SRFA (Leenheer and others, 1994) were based on unfractionated 13C-NMR spectra as presented in figure 21. Peaks are broadened and obscured by the mixture characteristics so that indicator peaks, such as the branched methyl groups of terpenoids near 20 ppm and the phenol peak at 153 ppm, are difficult to differentiate in the unfractionated SRFA. In the aromatic carbon region (100-160 ppm), the combination of the aromatic carbon profile of terpenoid fractions (fig. 10) with the aromatic carbon profile of the tannin fractions (figs. 11-15) gives a combined aromatic carbon profile that is consistent with lignin structures. Liquid-state quantitative 13C-NMR spectra of SRFA (Thorn, 1994; Thorn and others, 1989) give better peak resolution, but the mixture characteristics of these spectra still limit the correct assignment of precursor structures.
The second reason why terpenoids and tannins have not been detected in SRFA is that quaternary carbon linkages in these structures have not been representatively detected in previous studies because of short contact times in CPMAS 13C-NMR spectra, and because few dipolar-dephased studies have been done that selectively detect quaternary linkages. Figure 21 shows the difference between 1 ms and 5 ms contact times. For the 1 ms contact time, aliphatic quaternary C-C at 45 ppm, C-O at 85 ppm, aromatic C-C at 105 ppm and C-O at 140-160 ppm are under-represented because of low cross-polarization efficiency of these carbons. Therefore, the contact time was lengthened to 5 ms in accordance with the findings of Alemany and others (1983) who report more comparable responses at this longer contact time for molecules of low or remote protonation. Wershaw and others (2000) confirmed the findings of Alemany and others (1983) by reporting that CPMAS 13C-NMR spectra of several aquatic fulvic acids gave the best quantitation at 5 ms contact time when compared to quantitative liquid-state 13C-NMR spectra of these samples.
Average molecular models were derived by combining elemental data: infrared, and 13C-NMR data with degradation of postulated tannin and terpenoid precursor structures. The data used in this modeling are presented in table 2, and the average molecular models are presented in figure 22. These models conform to the empirical formula, molecular weight distribution, functional group content, and ring content data. These models are much better approximations of actual structures than models presented previously for unfractionated SRFA (Leenheer and others, 1994), because the extensive fractionation of this study produced more homogeneous fractions.
The large number of rings and the low carbon number per ring in the data of table 2 indicate aryl/aliphatic rings, some of which are fused, that are extensively substituted with carboxyl and methyl end groups. These models of primary molecular structure indicate more spherical structures than chain structures that can fold or unfold depending on the solution chemistry.
The structural models of fraction 2/1 and 2/4 (fig. 22) were derived from cyclic diterpenoids such as abietic acid. Digenetic pathways to fulvic acid from terpenoid precursors include double bond cleavage and oxidation, condensation of carboxyl groups with double bonds to produce cyclic tertiary lactones, and terminal methyl group oxidation to carboxyl groups (Leenheer and others, 2003). Fractions 3/2 and 4/6 were derived from condensed tannins that are composed of flavonoid units. The carbons in the A ring of the parent flavonoid with its phloroglucinol substitution pattern are completely substituted as indicated by the 13C-NMR data; and the B ring, with its single phenol groups is absent in fraction 3/2, but present in fraction 4/6. Tannins extracted from undegraded leaves have unsubstituted carbons in the A ring as indicated by a 13C-NMR peak at 95 ppm (Preston and others, 1997), but this peak was absent in tannins found in mangrove leaves at various stages of decomposition (Benner and others, 1990) indicating that A-ring substitution occurs during leaf senescence. Ortho-phenol structures in the B-ring of certain condensed tannins are indicated by a 13C-NMR peak at 145 ppm (Benner and others, 1990), but this peak was found in minor amounts in only a few fractions of this study indicating selective decomposition of ortho-phenol structures as was found in the mangrove leaves study. The center pyran ring of the flavonoid has been opened, but other condensation reactions produce additional rings as indicated by studies of flavonoid reactivity (Haslam, 1998).
Lignin-derived fulvic acid may be present as a minor component in SRFA, but fulvic acids more likely to be derived from lignin sources such as is found in the standard International Humic Substances Society soil and peat fulvic acids, give different 13C-NMR aromatic carbon profiles as compared to aquatic fulvic acids (Thorn and others, 1989). Lignins and tannins are isomers with respect to elemental composition, so a recent high-resolution mass spectrometric study (Stenson and others, 2003) of SRFA elemental composition of resolved ions is not definitive with respect to a lignin origin. The basis of the argument for tannins and terpenoids as major precursors of SRFA resides in the comprehensive fractionation and spectral characterization approach of this study.
SRFA is likely the most studied aquatic humic substance since a large sample was isolated in 1982, and was adopted, distributed, and sold by the IHSS as a standard fulvic acid for various scientific studies. The IHSS and other SRFA samples have been used for basic structural studies, for non-polar organic contaminant binding interactions, for metal-binding interactions, and for production of DBPs . These and other studies too numerous to reference would benefit by a better understanding of organic precursor structures and diagenetic processes that result in aquatic fulvic acid so that reactivity and reaction mechanisms can be better elucidated. Tannins are more reactive with chlorine to produce undesirable disinfection by-products than are terpenoids. This information can aid water managers in determining sources of aquatic fulvic acids in drinking water supplies and in design of drinking-water-treatment processes specific to waters containing aquatic fulvic acid.
The objective of this report is to describe structural studies selected to identify specific structures indicative of organic precursors in the bulk SRFA sample. These techniques (infrared spectrometry, 13C-nuclear magnetic resonance (NMR) spectrometry, and elemental analyses) are selected to provide quantitative structural information. The complex mixture of SRFA components is simplified by first performing normal-phase chromatography using silica gel, followed by reverse-phase chromatography using XAD-8 resin. This two-stage fractionation was done to better resolve spectral peaks and more specific elemental composition in the fractions that gave diagnostic information about organic precursors. These analyses indicate whether tannins and terpenoids are more important precursors than lignin in SRFA.
There are major compositional differences between the Si-2 subfraction isolates, which represent nearly half the mass of SRFA, and the higher-numbered silica-gel subfractions. Both the normal and dipolar-dephased 13C-NMR spectra for the Si-2 subfractions are typical for fulvic acid derived from terpenoid precursors. The dipolar dephased spectra of subfractions derived from fractions Si-3 to Si-6 all show the distinct 105-ppm peak characteristic of condensed tannins, and this peak cannot be attributed to ketal anomeric carbons of carbohydrates due to insufficient concentrations of alcohols detected in the infrared and 13C-NMR spectra of these subfractions. The basis of the argument for tannins and terpenoids as major precursors of SRFA resides in the comprehensive fractionation and spectral characterization approach of this study.
Table 2. Data used to determine structural characteristics of selected SRFA subfractions.
[F, fraction; 2/1, fraction number from silica gel, and subfraction number from XAD-8 resin; %, percent; #, number; NMR, nuclear magnetic resonance].
| Determination | Method | Subfraction 2/1 | Subfraction 2/4 | Subfraction 3/2 | Subfraction 4/6 |
|---|---|---|---|---|---|
| Empirical Formula (1,000) Dalton | Elemental Analyses | C42.5H44.7O27.3N0.4 | C47.6H46.6O23.8N0.3 | C43.2H38.6O27.4N0.6 | C46.7H39.4O24.3N1.1 |
| Aliphatic C-H Plus C-N Carbons | %C from 13C-NMR times # C's in Empirical Formula | 18.0 | 16.4 | 11.1 | 12.6 |
| Aliphatic C-O Carbons | %C from 13C-NMR times # C's in Empirical Formula | 7.9 | 6.8 | 8.5 | 6.1 |
| Aromatic plus Olefinic Carbons | %C from 13C-NMR times # C's in Empirical Formula | 2.8 | 15.2 | 13.5 | 19.2 |
| Carboxyl plus Ester Carbons | %C from 13C-NMR times # C's in Empirical Formula | 11.9 | 7.4 | 8.3 | 7.0 |
| Ketone Carbons | %C from 13C-NMR times # C's in Empirical Formula | 1.9 | 1.8 | 1.8 | 1.8 |
| Index of Hydrogen Deficiency (Φ) | Φ = [(2C+2) – (H – N)]/2 | 21.4 | 25.5 | 25.5 | 28.5 |
| # Rings (Θ) | Θ = Φ – C = OC – 0.5 (Aromatic plus Olefinic C) | 6.2 | 8.7 | 8.4 | 10.1 |
| # C's per Ring (Ω) | Ω = Total C/Ι | 6.9 | 5.5 | 5.1 | 4.6 |
Alemany, L.B., Grant, D.M., Pugmire, R.J., Alger, T.D., and Zilm, K.W., 1983, Cross- polarization and magic-angle sample spinning NMR spectra of model organic compounds, 2. Molecules of low or remote protonation: Journal of the American Chemical Society, v. 105, p. 2142-2147.
Averett, R.C., Leenheer, J.A., McKnight, D.M., and Thorn, K.A., 1994, Humic substances in the Suwannee River, Georgia—Interactions, properties, and proposed structures: U.S. Geological Survey Water-Supply Paper 2373, 224 p.
Benner, R., Hatcher, P.G., and Hedges, J.I., 1990, Early diagenesis of mangrove leaves in a tropical estuary—Bulk chemical characterization using solid-state 13C-NMR and elemental analyses: Geochimica et Cosmochimica Acta, v. 54, p. 2003-2013.
Brown, G.K., MacCarthy, P., and Leenheer, J.A., 1999, Simultaneous determination of Ca, Cu, Ni, Zn, and Cd binding strengths with fulvic acid fractions by Schubert's method: Analytica Chimica Acta, v. 402, p. 169-181.
Chiou, C.T., Kile, D.E., Brinton, T.I., Malcolm, R.L., Leenheer, J.A., and MacCarthy, P., 1987, A comparison of water solubility enhancements of organic solutes by aquatic humic materials and commercial humic acids: Environmental Science and Technology, v. 21, p.1231-1234.
Croué, J.-P., Violleau, D., and LaBouyrie, L., 2000, Disinfection by-product formation potential of natural organic matter fractions: A comparison between a low- and a high-humic water, in Barrett, S.E., Krasner, S.W., and Amy, G.L., eds., Natural organic matter and disinfection by-products: ACS Symposium Series 761, Washington. D.C., American Chemical Society, p. 139-153.
del Rio, J.C., and Hatcher, P.G., 1995, Structural characterization of humic substances using thermochemolysis with tetramethylammonium hydroxide, in Gaffney, J.S., Marley, N.A., Clark, S.B., eds., Humic/fulvic acids and organic colloidal materials in the environment: ACS Symposium Series 651, Washington D.C., American Chemical Society, p. 79-95.
Ertel, J.R., Hedges, J.I., and Perdue, E.M.,1984, Lignin signature of aquatic humic substances: Science, v. 223, p. 485-487.
Haslam, E., 1998, Practical polyphenolics: Cambridge, U.K., Cambridge University Press, p. 335-373.
Hernes, P.H., Benner, R., Cowie, G.L., Goni, M.A., Bergamaschi, B.A., and Hedges, J.I., 2001, Tannin diagenesis in mangrove leaves from a tropical estuary: A novel molecular approach: Geochimica et Cosmochimica Acta, v. 65, p. 3109-3122.
Huffman, E.W.D., Jr., and Stuber, H.A., 1985, Analytical methodology for elemental analysis of humic substances, in Aiken, G.R., McKnight, D.M., Wershaw, R.L., and MacCarthy, P.,eds., Humic substances in soil, sediment, and water—Geochemistry, isolation and characterization: New York, John Wiley and Sons, p. 433-456.
Kujawinski, E.B.; Hatcher, P.G.; and Freitas, M.A., 2002, Electrospray FT-ICR MS analysis of the humic and fulvic acids: Analytical Chemistry, v. 74, p. 413-419.
Larson, R.A., and Weber, E.J., 1994, Reaction mechanisms in environmental organic chemistry: Ann Arbor, Lewis Publishers, p. 275-358.
Leenheer, J.A., McKnight, D.M., Thurman, E.M., and MacCarthy, P., 1994, Structural components and proposed structural models of fulvic acid from the Suwannee River, in Averett, R.C., Leenheer, J.A., McKnight, D.M., and Thorn, K.A., eds., Humic substances in the Suwannee River, Georgia—Interactions, properties, and proposed structures: U.S. Geological Survey Water-Supply Paper 2373, p. 195-211.
Leenheer, J.A., Nanny, M.A., and McIntyre, C., 2003, Terpenoids as major precursors of dissolved organic matter in landfill leachates, surface water, and groundwater: Environmental Science and Technology, v. 34, p. 2323-2331.
Leenheer, J.A., and Noyes, T.I., 1984, A filtration and column-adsorption system for onsite concentration and fractionation of organic substances from large volumes of water: U.S. Geological Survey Water Supply Paper 2230, 16 p.
Malcolm, R.L, Aiken, G.R., Bowles, E.C., and Malcolm, J.D. 1994, Isolation of humic and fulvic acids from the Suwannee River, in Averett, R.C., Leenheer, J.A., McKnight, D.M., and Thorn, K.A., eds., Humic substances in the Suwannee River, Georgia: Interactions, properties, and proposed structures: U.S. Geological Survey Water-Supply Paper 2373, p. 13-19.
Pirkle, E.C., Pirkle, W.A., and Yoho, W.H., 1977, The Highland heavy-mineral sand deposit on Trail Ridge in northern peninsular Florida: Florida Bureau of Geology, Report of Investigation 84, 50 p.
Preston, C.M., and Sayer, B.G., 1992, What's in a nutshell—An investigation of structure by carbon-13 cross-polarization magic-angle spinning nuclear magnetic resonance spectroscopy: Journal of Agricultural and Food Chemistry, v. 40, p. 206-210.
Preston, C.M., Trofymow, J.A., Sayer, B.G., and Niu, J., 1997, 13C nuclear magnetic resonance spectroscopy with cross-polarization and magic-angle spinning investigation of the proximate-analysis fractions used to assess litter quality in decomposition studies: Canadian Journal of Botany, v. 75, p. 1601-1613.
Robinson, T., 1980, The organic constituents of higher plants, 4th edition: North Amherst, Mass., Cordus Press, p. 116.
Sonnenberg, L.B., Johnson, J.D., and Christman, R.F., 1989, Chemical degradation of humic substances for structural characterization, in Suffet, I.H., and MacCarthy, P., eds., Aquatic humic substances, Influence on fate and treatment of pollutants: ACS Symposium Series 219, Wash. D.C., American Chemical Society, p. 3-23.
Stenson, A.C., Marshall, A.G., and Cooper, W.T., 2003, Exact masses and chemical formulas of individual Suwannee River fulvic acids from ultrahigh resolution electrospray ionization Fourier transform ion cyclotron resonance mass spectra: Analytical Chemistry, v. 75, p. 1275-1284.
Stevenson, F.J., 1994, Humus chemistry—Genesis, composition, reactions, 2nd Edition: New York, John Wiley and Sons, p. 307-317.
Thorn, K.A., 1994, Nuclear-magnetic-resonance spectrometry investigations of fulvic and humic acids from the Suwannee River, in Averett, R.C., Leenheer, J.A., McKnight, D.M., and Thorn, K.A., eds., Humic substances in the Suwannee River, Georgia: Interactions, properties, and proposed structures: U.S. Geological Survey Water-Supply Paper 2373, p. 141-182.
Thorn, K.A., Folin, D.W., and MacCarthy, P., 1989, Characterization of the International Humic Substances Society standard and reference fulvic and humic acids by solution state carbon-13 (13C) and hydrogen-1 (1H) nuclear magnetic resonance spectrometry: U.S. Geological Survey Water-Resources Investigations Report 89-4196, 93 p.
Wershaw, R.L., Aiken, G.R., Leenheer, J.A., and Tregellas, J.R., 2000, Structural-group quantitation by CP/MAS 13C-NMR measurement of dissolved organic matter from natural surface waters, in Ghabbour, E.A., and Davies, G., eds., Humic substances—Versatile components of plants, soils and water: Cambridge, U.K., Royal Society of Chemistry, p. 63-81.
Wilson, M.A., and Hatcher, P.G., 1988, Detection of tannins in barks and other plant residues by high resolution solid state 13C-NMR: Organic Geochemistry, v.12, p. 539-546.
Document Accessibility: Adobe Systems Incorporated has information about PDFs and the visually impaired. This information provides tools to help make PDF files accessible. These tools convert Adobe PDF documents into HTML or ASCII text, which then can be read by a number of common screen-reading programs that synthesize text as audible speech. In addition, an accessible version of Acrobat Reader 6.0, which contains support for screen readers, is available. These tools and the accessible reader may be obtained free from Adobe at Adobe Access.
| AccessibilityFOIAPrivacyPolicies and Notices | |
 |
|