
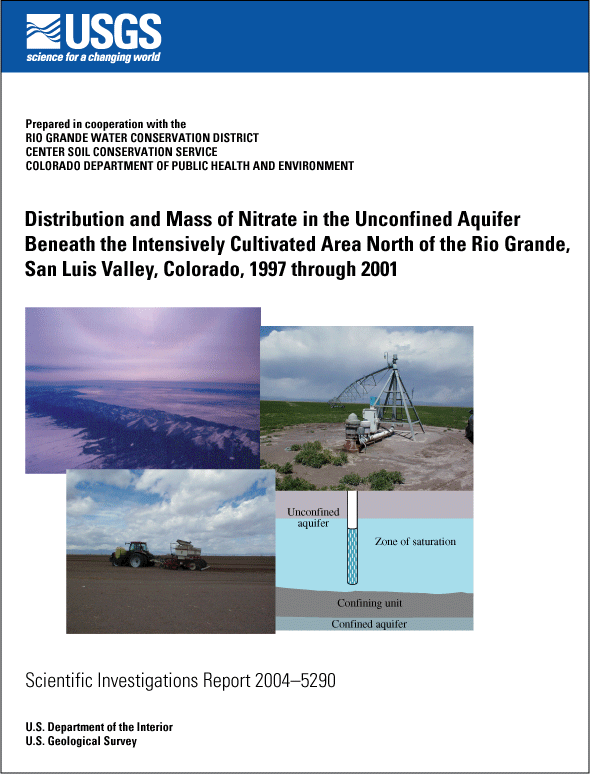
Distribution and Mass of Nitrate in the Unconfined Aquifer Beneath the Intensively Cultivated Area North of the Rio Grande, San Luis Valley, Colorado, 1997 through 2001
By Robert W. Stogner, Sr.
USGS Scientific Investigations Report 2004-5290, 62 p., 14 figs.--ONLINE ONLY
This document is available in pdf format:
![]() SIR2004-5290 (4.74MB)
SIR2004-5290 (4.74MB)
(Requires Adobe
Acrobat Reader)
The citation for this report, in USGS format, is as follows:
Stogner, R.W., Sr., 2005, Distribution and mass of nitrate in the unconfined
aquifer beneath the intensively cultivated area north of the Rio Grande,
San Luis Valley, Colorado, 1997 through 2001: U.S. Geological Survey Scientific
Investigations Report 2004-5290, 62 p.
Abstract
Current (19972001) and historical (194849, 196869) nitrate-concentration and water-level data collected from wells completed in the unconfined aquifer in the intensively cultivated area north of the Rio Grande in south-central Colorado were used to determine the distribution and mass of nitrate and to determine short- and long-term trends in the concentration and mass of nitrate in the unconfined aquifer.
The distribution of nitrate concentrations in the unconfined aquifer indicates that nitrate concentrations increased considerably between the 1940s and 1990s and were relatively stable between 1997 and 2001. However, evaluation of estimates of mass of nitrate indicated increases in the estimated mass of nitrate in the unconfined aquifer from the 1940s (6,900 tons) to the late 1960s (34,000 tons) to the late 1990s (75,000 tons). Trend analyses indicated no significant trend in annual estimates of the mass of nitrate during 19972001, averaging 75,000 tons.
Ground-water samples collected from selected wells with large nitrate concentrations skewed the results of nitrate distribution and mass when nearby wells were not sampled. Estimates of nitrate mass varied by 3 to 8 percent when outliers were removed from the analysis.
Contents
Abstract
Introduction
Purpose and Scope
Description of the San Luis Valley and Study Area
Acknowledgments
Methods
Historical Data
Design of the Ground-Water Monitoring Network, 19972001
Collection and Analyses of Ground-Water Samples
Geographic Information Systems
Calculating Variations in Concentration of Nitrate (as Nitrogen)
Estimation of the Mass of Nitrate (as Nitrogen) in the Unconfined Aquifer
Estimated Ground-Water Withdrawals
Hydrogeology
Confining Unit
Unconfined Aquifer
Depth-to-Water Table and Ground-Water Table Altitude
Saturated Thickness
Hydraulic Gradients, Ground-Water Velocity, and Estimated Traveltime
Estimated Volume of Water in Unconfined Aquifer
Distribution of Nitrate (as Nitrogen) in the Unconfined Aquifer
Distribution of Nitrate (as Nitrogen) During 19972001
Spatial Variability
Temporal Variability in Nitrate (as Nitrogen) Concentrations
Seasonal Variability
Variability during mass-sampling period
Annual Variability
Distribution of Nitrate (as Nitrogen) During 196869
Distribution of Nitrate (as Nitrogen) During 194849
Variations in the Distribution of Nitrate (as Nitrogen)
Variations in the Distribution of Nitrate (as Nitrogen) during 1997 through 2001
Variations in the Distribution of Nitrate (as Nitrogen) during 1940s through 2001
Mass of Nitrate (as Nitrogen) in the Unconfined Aquifer
Estimation of Error
Mass of Nitrate (as Nitrogen) during 19972001
Influence of High Outliers
Estimated Mass of Nitrate (as Nitrogen) Pumped from the Unconfined Aquifer
Hypothetical Effects of Nutrient Management
Mass of Nitrate (as Nitrogen) during 196869 and 194849
Variations in the Mass of Nitrate (as Nitrogen)
Variations in the Mass of Nitrate (as Nitrogen) during 1997 through 2001
Variations in the Mass of Nitrate (as Nitrogen) during 1940s through 2001
Summary
Selected References
Appendixes
| AccessibilityFOIAPrivacyPolicies and Notices | |
 |
|