Version 1.0
U.S. Department of the Interior
U.S. Geological Survey
This research was supported by the U.S. Department of Defense through the Strategic Environmental Research and Development Program (SERDP)
U.S. Department of the Interior
Gale A. Norton, Secretary
U.S. Geological Survey
Charles G. Groat, Director
U.S. Geological Survey, Reston, Virginia: 2005
This publication is only available online at URL: https://pubs.usgs.gov/sir/2005/5046/
For information on other USGS products and ordering information:
World Wide Web: http://www.usgs.gov/pubprod/
Telephone: 1-888-ASK-USGS
For more information on the USGS—the Federal source for science about the Earth, its natural and living resources,
natural hazards, and the environment:
World Wide Web: http://www.usgs.gov/
Telephone: 1-888-ASK-USGS
Any use of trade, product, or firm names in this publication is for descriptive purposes only and does not imply endorsement by the U.S. Government.
Although this report is in the public domain, permission must be secured from the individual copyright owners to reproduce any copyrighted materials contained within this report.
We performed a survey to demonstrate the effectiveness of a prototype tensor magnetic gradiometer system (TMGS) for detection of buried unexploded ordnance (UXO). In order to achieve a useful result, we designed a data-reduction procedure that resulted in a realistic magnetic gradient tensor and devised a simple way of viewing complicated tensor data, not only to assess the validity of the final resulting tensor, but also to preview the data at interim stages of processing.
The final processed map of the surveyed area clearly shows a sharp anomaly that peaks almost directly over the target UXO. This map agrees well with a modeled map derived from dipolar sources near the known target locations. From this agreement, it can be deduced that the reduction process is valid, making the prototype TMGS a foundation for development of future systems and processes.
Many geophysical applications rely on magnetic field measurements to discern characteristics of geologic source materials and buried objects. Typically, scalar data are acquired but may be converted to vector data as required by certain modeling routines. Vector components are derivable if the scalar data were acquired over a large surface with sufficient resolution. However, in UXO applications, where sources are nearby, there is a practical limitation to this approach (D.V. Smith, oral commun.). Therefore, we consider vector-based acquisition methods.
Direct measurement of target-anomaly vector data is hampered by the huge Earth-field vector, which requires the attitude of the vector sensor to be recovered with practically unattainable levels of precision. For example, using the best available attitude-recovery systems along with a vector magnetometer, gives Earth-frame component accuracy to only about 5 nT. This problem is circumvented in tensor gradiometry, which incorporates the vector information without requiring such stringent knowledge of the sensor-array attitude.
Gradients are more useful for discerning nearby sources and source materials than are scalar or vector fields alone. Because gradient strength decreases with distance more rapidly than field strength, nearby sources are preferentially detected and distant sources are rejected. The tensor gradient can be manipulated to obtain source information through a number of methods that cannot be applied with fields only. One such method, called dipole mapping (Wynn and others, 1975), uses a tensor to find the location, depth, and moment of a dipolar source. Other methods involve the use of tensor invariants (Pedersen and Rasmussen, 1990), which we briefly discuss here.
A gradient is measured by finding the difference between two magnetometer readings. When normalized with respect to sensor separation, the difference forms a gradient in the direction of the line between the two sensors. For a given line direction, there are three gradients corresponding to the three vector components, and there are three linearly independent line directions, making nine gradients. These gradients can be arranged into a matrix called a magnetic gradient tensor, mathematically expressed as:
Because both the divergence and curl of a magnetostatic field must equal zero in a sourceless volume, this tensor is traceless and symmetric, having only five independent components. The magnetic gradient tensor and three field components comprise a complete description of the magnetic field to the first order, and this is what results from the TMGS measurements.
The TMGS consists of two basic units. Figure 1 shows the sensor array, called TESSA (tetrahedral em/mag sensor suspension apparatus), which is a 1-m tetrahedron with four triaxial magnetic sensors at its vertices. The second unit is an enclosure that provides a thermally controlled environment for the magnetometer circuitry. It also contains circuitry that measures the temperature of each sensor and samples the magnetometer output. The raw data are sent, via an RS-232 link, to a laptop computer for storage. The magnetometers are ring-core triaxial fluxgates manufactured by Narod Geophysics (Narod, 1987) for use in magnetic observatories by the U.S. Geological Survey (USGS).
1. TMGS sensor array (TESSA). |
|
The TMGS was originally designed for detection of volcano magnetic effects from a stationary observation point (Bracken and others, 1998). Therefore, no provision was made for the sensors to be on a moving platform, as would be required for production UXO work. Consequently, this demonstration was designed as a grid of stationary observations. Nevertheless, provision has been made in the reduction procedure for data collected from a moving platform. In addition, the sensor geometry is inappropriate, and the sensor separation is too great, for the intense field curvatures of proximate UXO sources. To compensate for the curvature, a "gradient collocation" stage has been incorporated into the data-reduction procedure shown in figure 2.
|
Figure 2. Flow chart of the TMGS data-reduction procedure. |
On March 12, 2003, the USGS used the TMGS to perform an experimental survey over a known UXO target at the Standardized UXO Test Site in Yuma Proving Ground, Arizona (YPG). The target was a 60-mm mortar shell buried 0.25 m deep. We collected the data as 10-s stationary observations at five samples per second over a 3-m-square grid centered on the target and having 0.25-m grid cells. Smith and Bracken (2004) describe the survey in detail. Three categories of data were collected on-site: (a) primary measurements including magnetics, position, and attitude; (b) spin calibration measurements; and (c) thermal baseline measurements. Some calibration data used in the reduction procedure were collected in the laboratory.
In the reduction process, we converted the survey data to a 13-by-13 grid of tensors. However, to help describe the reduction and to present the results, the tensors were further reduced to a set of scalar values—the determinants of the tensors, which provide a more intuitive display for figures 3–6. Any gradient tensor can be rotated into a natural coordinate system, called the principle axis frame, in which all but the diagonal components are zero. If the three diagonal gradients are then multiplied together, the result can be imagined to represent the volume of a box in gradient space—the bigger the box, the more gradient strength it contains. This product is a scalar quantity, called a tensor invariant, that can be calculated from any reference frame by taking the determinant of the matrix—diagonalizing is not actually required (Pedersen and Rasmussen, 1990). The determinant will have the greatest expression at the nearest approach to a source. A mapped determinant anomaly will normally reach a sharp (positive or negative) peak almost directly over its target, but sometimes it may have an abrupt positive-to-negative transition instead. This is in contrast to a scalar field anomaly that reaches an unfocused peak at a location significantly offset from the target.
A detailed description of the reduction process is given in Bracken and Brown (in press). The reduction addresses three significant issues: drift, leakage, and tracking. Drift is a tendency of the instrumentation to change its calibration as a function of temperature and time. Leakage is an incomplete cancellation of a field common to all sensors (i.e., the Earth's field), leaving a small percentage interfering with the gradients. Tracking is the ability of the system to produce accurate gradients and not to leak while the sensor array is undergoing attitude changes.
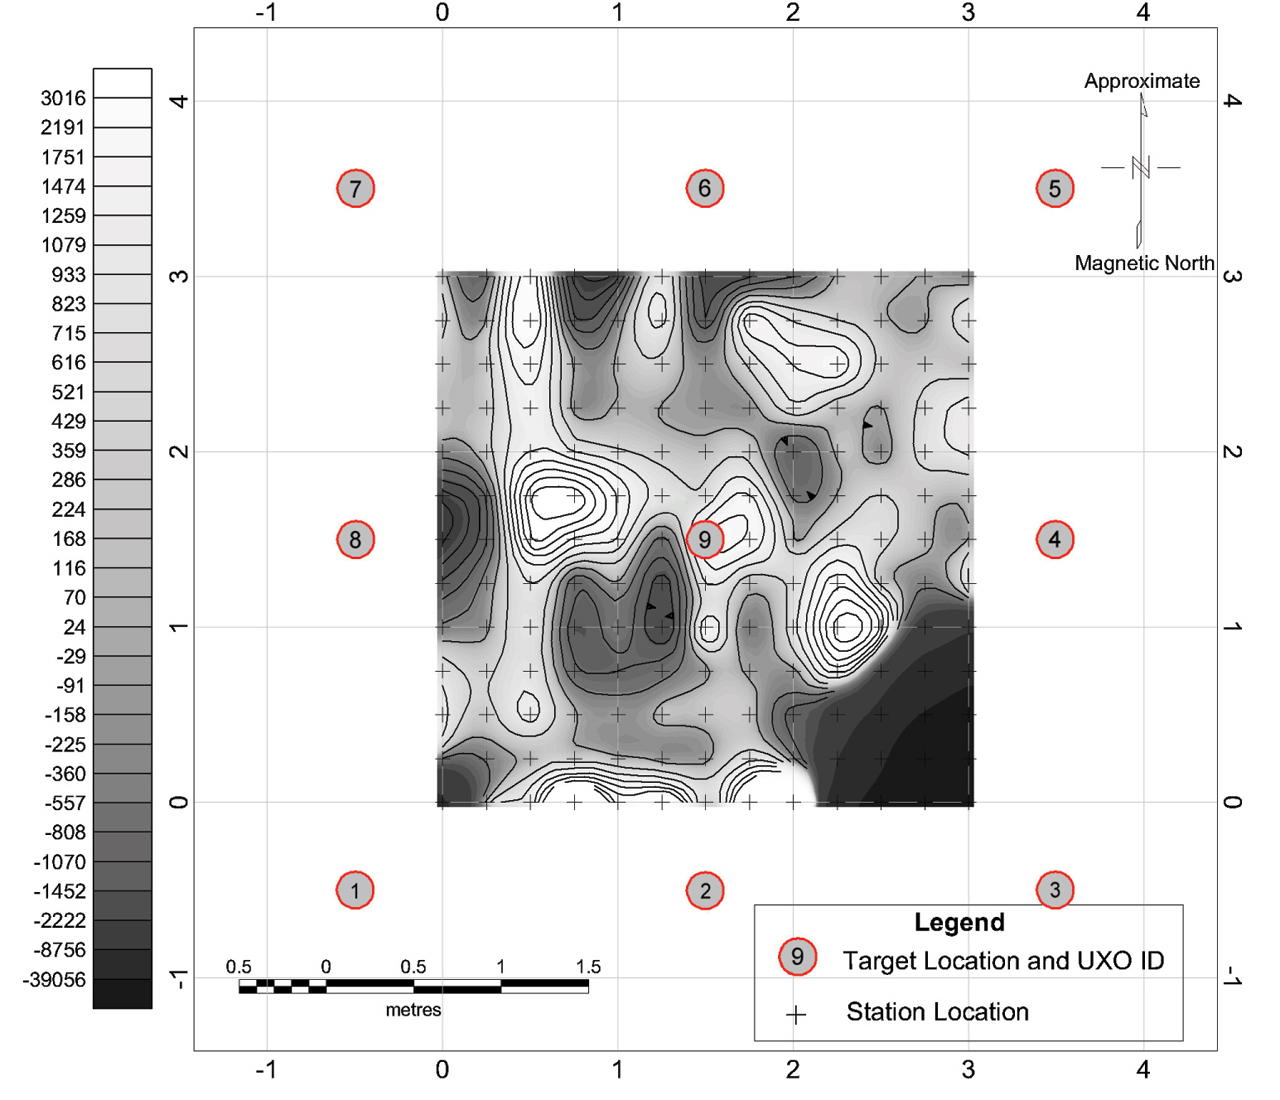
Tracking is handled in the "tracking xfer function" reduction stage shown in figure 2. However, no tracking corrections were required for this survey because TESSA was stationary during data collection. Figure 3 shows a determinant map of how the survey would look if the data were processed only through the tracking stage—the raw data in our case. Because the magnetometers were not calibrated, the tensor anomalies are dominated by leakage that is correlated to sensor-attitude variations.
|
Figure 3. Determinant map of the raw data. |
Leakage is handled in the "bin conversion" and "apply cal. coefficients" reduction stages shown in figure 2. If two sensors give different readings in the same field, that error will be included in the measured gradient and will be indistinguishable from a true gradient. Typically, these types of errors will swamp the rather small gradients being sought. Consequently, it is extremely important to derive a comprehensive and precise set of calibration coefficients for the magnetometers being used. The "bin conversion" stage is specific to our magnetometers and uses coefficients that we derived in the laboratory. The "apply cal. coefficients" stage is applicable to any vector magnetometer and requires coefficients derived from a "spin calibration," which we did by slowly rotating TESSA in the Earth's field. We derived the calibration coefficients by applying a nonlinear regression that required the magnitude resulting from each sensor to equal the true magnitude of the Earth's field as monitored by a base magnetometer. More information on spin calibration is available in Bracken and Smith (2005).
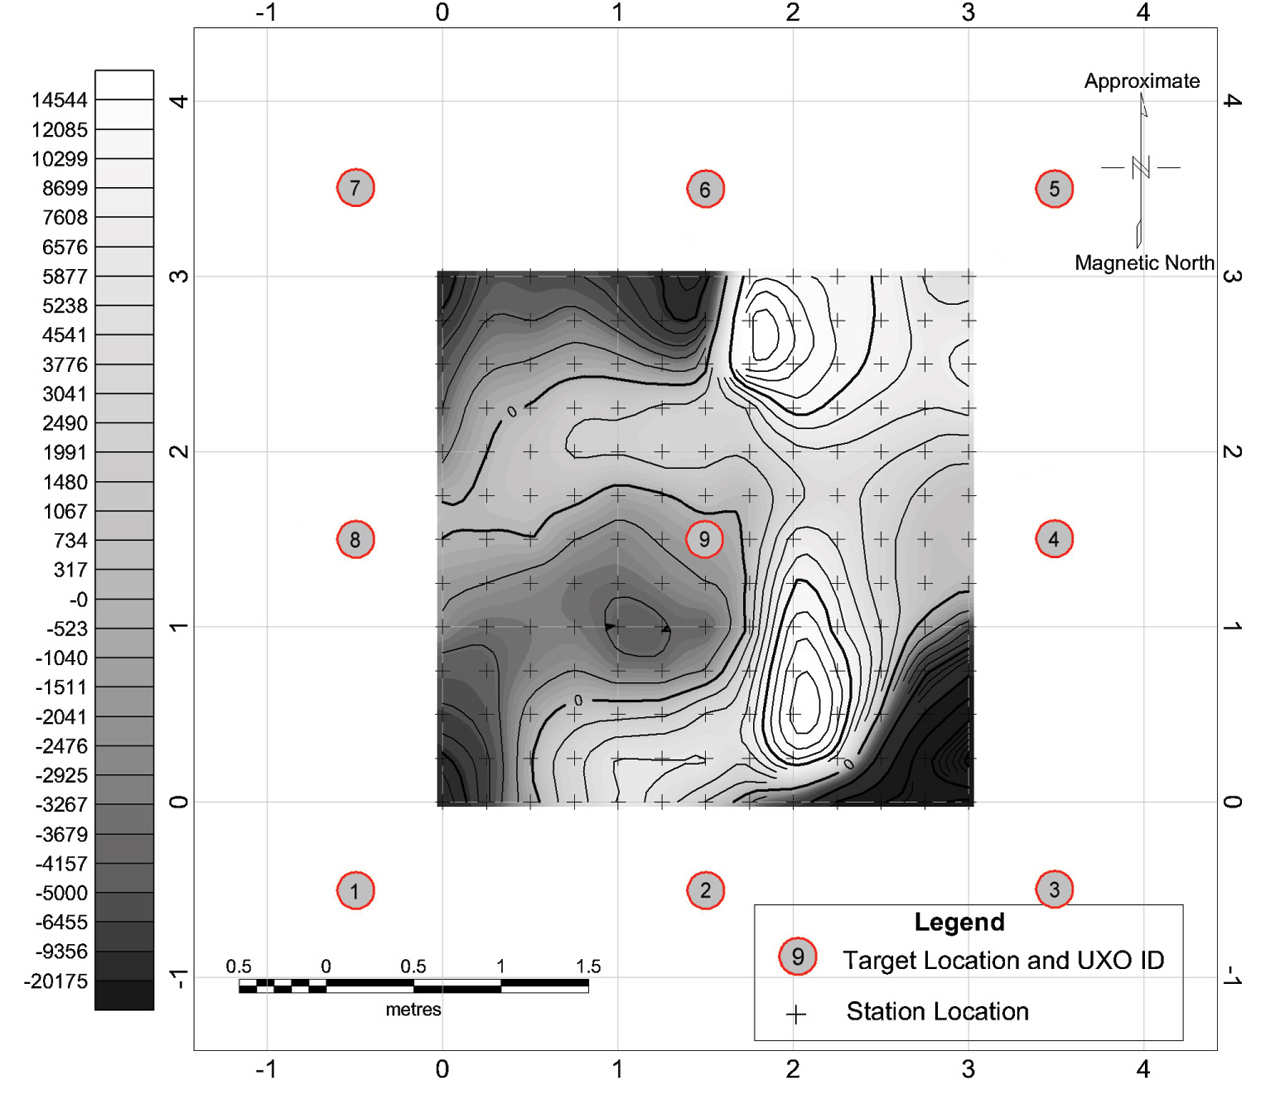
Figure 4 shows a determinant map of how the survey would look if the data were processed only through the leakage-handling calibrations. The leakage has gone away, but thermal-drift effects dominate so heavily that no hint of the anticipated target anomaly is yet visible.
Figure 4. Determinant map of the data reduced through the calibration stages. |
|
Drift is handled in the "thermal-drift correction" reduction stage shown in figure 2. We collected data for this correction by occupying a base location three times during the survey—at the beginning, middle, and end. The correction was simply to require the gradients at the base location to be constant and to adjust the intervening data with linear functions.
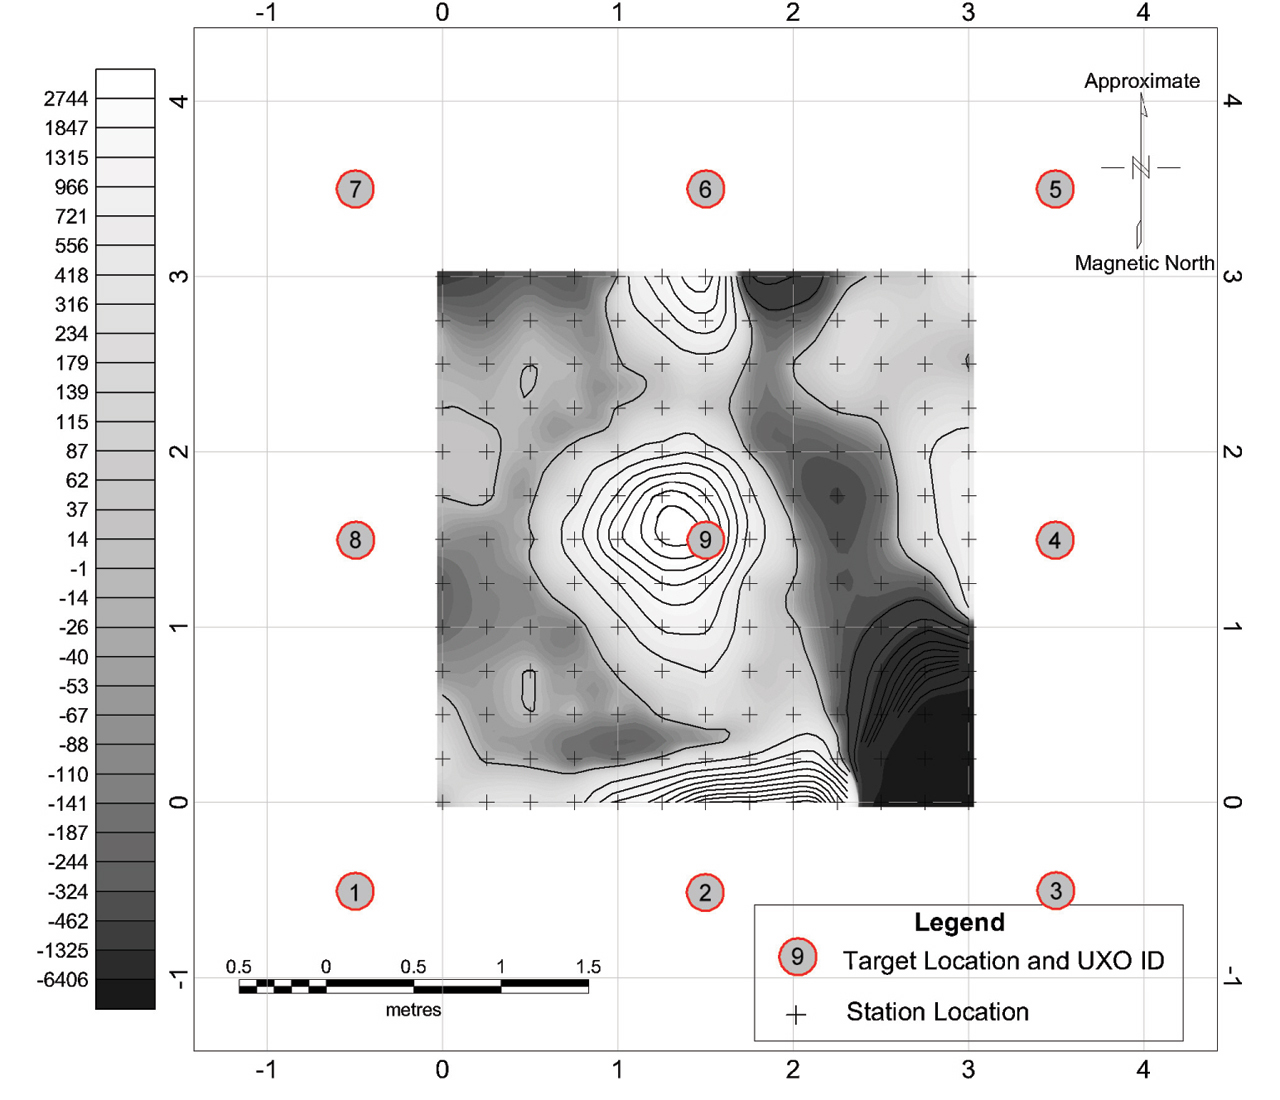
The final tensors resulting from the reduction process have been converted to determinants and are shown in figure 5. Of particular importance are the obvious circular anomaly in the center of the map and the near coincidence of its peak with the plotted location of the target UXO. The amplitude and sharpness of the anomaly is significant. It is not obscured in a sea of noise but, rather unmistakably, detects both the presence and the location of the source.
|
Figure 5. Determinant map of the final processed data. |
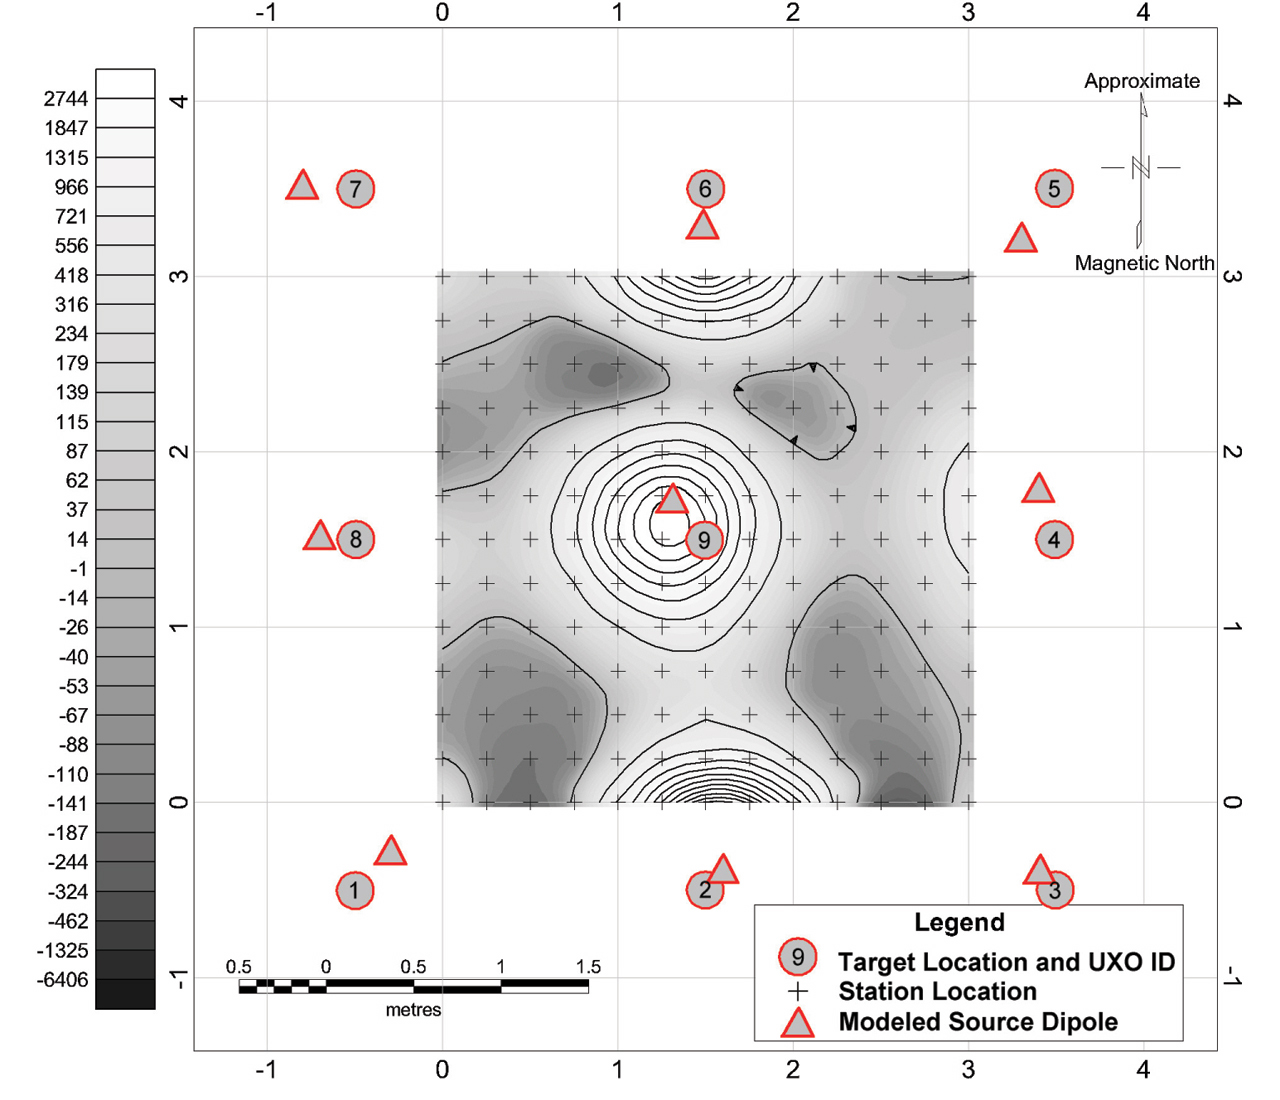
In order to confirm that the final processed map is reasonable, we produced a model of magnetic dipolar sources near the known locations of the UXO targets in the survey area, calculated ideal tensors at the survey station locations, and made a map of the determinants, as shown in figure 6. The magnetic fields of the center target and eight edge targets were modeled using depth and location specifications provided by YPG. Positions of dipolar sources were adjusted horizontally, up to a quarter of a meter from the specified locations, in order to align anomalies. We obtained a reasonable moment magnitude for the center target by adjusting the peak value of its anomaly to match the reduced anomaly.
Figure 6. Modeled determinant map with locations of the dipolar sources used in the model. |
|
In conclusion, the similarity of the reduced and modeled results indicates that the reduction process is producing real tensor data. This preliminary analysis is convincing for two compelling reasons. First, the determinant uses all nine tensor components, making its value representative of the whole tensor. Second, the reduced and modeled invariant maps are quite similar, which means that the system consistently produced realistic values under a large variety of target-field conditions.
Several stages of the data reduction are critical. If any stage is missing or its coefficients are inaccurate, the resultant tensor map will be incomprehensible. This is in contrast to a typical scalar magnetics survey in which the basic anomalies are usually visible from the raw data and simply improve as reductions are performed. The TMGS processing stages are analogous to a keyed lock—if any tumbler is out of place, the lock will not open. This observation is well illustrated in figure 4, which shows how the final processed map would have appeared if all but the last two reduction stages were performed. The map is completely devoid of any hint that the reduction is moving toward a reasonable result.
Future work on our system includes changing the geometry and reducing the size of the sensor array to handle field curvature and modifying the data-acquisition systems to facilitate data collection on the fly. We expect further research on the reduction process to validate proposed tracking algorithms and to allow an abbreviated spin calibration. We are also studying tensors and tensor invariants for detecting, locating, and modeling sources.
This research was supported by the U.S. Department of Defense through the Strategic Environmental Research and Development Program (SERDP). We acknowledge YPG personnel for facilitating our work at the Standardized UXO Test Site and Professor Yaoguo Li of Colorado School of Mines for providing consultation.
Manuscript approved for publication February 24, 2005
Published in the Central Region, Denver, Colorado
Editing, layout, photocomposition—Richard W. Scott, Jr.
Graphics by the authors
Document Accessibility: Adobe Systems Incorporated has information about PDFs and the visually impaired. This information provides tools to help make PDF files accessible. These tools convert Adobe PDF documents into HTML or ASCII text, which then can be read by a number of common screen-reading programs that synthesize text as audible speech. In addition, an accessible version of Acrobat Reader 6.0, which contains support for screen readers, is available. These tools and the accessible reader may be obtained free from Adobe at Adobe Access.
| AccessibilityFOIAPrivacyPolicies and Notices | |
| |
|