
|
|
|
||||
| Scientific Investigations Report 2005–5196 |
In cooperation with the Ohio Department of Natural Resources, Division of Mineral Resource Management
Chemical Characteristics of the Watershed
Appendix 1. Complete water-quality, fish-species, and macroinvertebrate-s...
Figure 1. Water-quality sampling sites in the upper Rush Creek w...
Figure 2. Water-quality sampling sites near Rehoboth, Perry Coun...
Figure 3. Water-quality sampling sites in the Turkey Run subwate...
Figure 4. Discharge, computed loads of metals and net alkalinity...
Figure 5. Discharge, computed loads of metals and net alkalinity...
Figure 6. pH in the Rush Creek watershed, Perry County, Ohio, 20...
Figure 7. Boron concentrations in the Rush Creek watershed, Perr...
Figure 8. Discharge, computed loads of metals and net alkalinity...
Figure 9. Discharge, computed loads of metals and net alkalinity...
Figure 10. pH in Rush Creek watershed, Perry County, Ohio, 2004.
Figure 11. Boron concentrations in the Rush Creek watershed, Per...
Photo 1. Seep at the Rehoboth reclamation site.
Photo 2. Seep at the Rehoboth reclamation site.
Photo 3. Tile drain at site 3004.
Photo 4. Outfall from pond 5 at site 3005.
Table 1. Identification information for sites used during the 20...
Table 2. Biocriteria for streams in the Allegheny Plateaus regio...
Table 3. Concentration limits defined by Primary and Secondary D...
Table 4. Water-quality criteria that suggest acid-mine-drainage ...
Table 5. Biological data collected at water-quality sampling sit...
Table 6. Comparison of combined metal load to sulfate, acidity, ...
Table 7. Comparison of combined metal load to sulfate, alkalinit...
Table 1–1. Chemical characteristics of water-quality samples colle...
Table 1–2. Species list and numbers of fish collected at main-stem...
Table 1–3. Species list and numbers of fish collected at tributary...
Table 1–4. Species list and numbers of macroinvertebrates collecte...
Table 1–5. Species list and numbers of macroinvertebrates collecte...
| Multiply | By | To obtain | |
| Length | |||
| inch (in.) | 2.54 | centimeter (cm) | |
| foot (ft) | 0.3048 | meter (m) | |
| mile (mi) | 1.609 | kilometer (km) | |
| Area | |||
| square mile (mi 2 ) | 2.590 | square kilometer (km 2 ) | |
| acre | 0.4047 | hectare (ha) | |
| Volume | |||
| cubic yard (yd 3 ) | 0.7646 | cubic meter (m 3 ) | |
| Rate | |||
| cubic foot per second | 0.02832 | cubic meter per second (m 3 /s) | |
| Mass | |||
| foot per second (ft/s) | 0.3048 | meter per second (m/s) | |
| inch per year (in/yr) | 25.4 | millimeter per year (mm/yr) | |
Temperature in degrees Celsius (°C) may be converted to degrees Fahrenheit (°F) as follows:
°F=(1.8x°C)+32
Temperature in degrees Fahrenheit (°F) may be converted to degrees Celsius (°C) as follows:
°C=(°F-32)/1.8
Vertical coordinate information is referenced to the North American Vertical Datum of 1988 (NAVD 88).
Horizontal coordinate information is referenced to the North American Datum of 1983 (NAD 83).
Specific conductance is given in microsiemens per centimeter at 25 degrees Celsius (µS/cm at 25 °C).
Concentrations of chemical constituents in water are given either in milligrams per liter (mg/L) or micrograms per liter (µg/L). Loads of chemical constituents are given in kilograms per day (kg/d).
| AMD | Acid mine drainage. |
| Channel sinuosity | Ratio of channel length to distance downstream, the number of bends in the channel. |
| Embeddedness | The degree to which gravel-sized and larger particles are surrounded or enclosed by finer-sized particles. |
| EPT | Pollution-sensitive members of the taxonomic orders Ephemeroptera, Plecoptera, and Trichoptera, representing mayflies, stoneflies, and caddisflies. |
| EWH | Exceptional Warmwater Habitat, comparable to 75th percentile of reference sites. |
| FGD | Flue-gas desulfurization by-product. FGD by-products result from the combustion of high-sulfur coal in combination with scrubbers that use sorbents such as limestone or dolostone to reduce sulfur emissions (Haefner and Rowe, 1997). |
| ICI | Invertebrate Community Index, a multiple metric scoring tool for macroinvertebrates. |
| IBI | Index of Biotic Integrity, a multiple metric scoring tool for fish. |
| IWB | Index of Well-Being, a fish index based on the numbers of all species and weight. |
| LRW-AMD | Limited resource water-acid mine drainage, habitat degraded. |
| MWH | Modified Warmwater Habitat, physical modifications to habitat. |
| Ohio EPA | Ohio Environmental Protection Agency. |
| ODNR-MRM | Ohio Department of Natural Resources—Division of Mineral Resource Management. |
| QHEI | Qualitative Habitat Evaluation Index, a visual tool used to assess the quality of cover. |
| SMCL | Secondary Maximum Contaminant Level is a nonenforceable, esthetically based standard set by the U.S. EPA and modified by states for public drinking water. SMCLs are established for constituents that can adversely affect the odor and appearance of water. |
| USEPA | U.S. Environmental Protection Agency. |
| USGS | U.S. Geological Survey. |
| WWH | Warmwater habitat, comparable to 25th percentile of reference sites. |
In 2003, the U.S. Geological Survey (USGS), in cooperation with the Ohio Department of Natural Resources, Division of Mineral Resources Management (ODNR-MRM), began a study to identify sources and magnitudes of acid mine drainage in the Rush Creek watershed by measuring streamflow, characterizing water quality, and determining the condition of aquatic life. This investigation builds on a large body of prior cooperative efforts between USGS and ODNR-MRM to characterize the hydrogeology and water quality in the coal-producing areas of southeastern Ohio. Data collection focused on documenting current conditions adjacent to a historically mined area known as the Rehoboth abandoned-mine land reclamation site. A total of 54 samples were collected at 40 sites throughout the watershed and analyzed for water-quality characteristics and a suite of inorganic constituents. Aquatic biological data were collected at 18 sites to produce an Invertebrate Community Index (ICI), an Index of Biotic Integrity (IBI), a Qualitative Habitat Evaluation Index (QHEI), and a modified Index of Well-Being (IWB) where applicable.
Nearly 50 percent (332 kg/d) of the combined metal load in the Rush Creek watershed was produced in the watershed containing the Rehoboth reclamation area, the site of abandoned-mine land reclamation efforts. A detailed study in the Rehoboth watershed identified sources of acid mine drainage that have median iron, manganese, and aluminum concentrations of 96.0, 17.8, and 23.3 mg/L, respectively, and a maximum boron concentration of 1.16 mg/L.
The streamflow and water-quality data from the moderate-flow sampling in 2003 was used to compare the combined loads of iron, manganese, and aluminum (total metal load) to sulfate and net alkalinity loads and biological indices where available. The tributary with the highest total metal load was the watershed including the Rehoboth reclamation area, accounting for 49.7 percent of the total metal load in the Rush Creek watershed. The detailed study of the Rehoboth reclamation area revealed that site 3004 (underdrain from pond 5) is producing 51.4 percent of the load in the subwatershed.
Fish and macroinvertebrate communities and stream habitat failed to attain Ohio Environmental Protection Agency's Warmwater habitat criteria at all 18 sites on Rush Creek. The upper reaches of Rush Creek and its tributaries support the Ohio Environmental Protection Agency's Limited resource water/Acid mine drainage use designation. This designation is based on water chemistry, geology, and type of impairment (whether it is caused by acidic or nonacidic mine drainage). The biodiversity study determined that most of the main stem of Rush Creek within the area of interest is currently uninhabitable to macroinvertebrates and fish because of water with high acidity and low pH and minimal habitat within the stream. However, the quality and quantity of biota collected by the U.S. Geological Survey in 2003 were improved in comparison to results from similar studies by the Ohio Environmental Protection Agency in 1982 and 1990.
Surface and deep mining and coal processing in the headwaters of the Rush Creek watershed in Perry County, Ohio (fig.1), have resulted in exposure of substantial amounts of mine spoils and deposition of coal refuse (primarily low-grade coal mixed with shale, sandstone, and pyritic spoils) within the flood plain. Oxidation of these materials causes acid mine drainage (AMD) and, along with runoff from abandoned mine sites, results in impairment of water quality in Rush Creek.
One of the most significant sources of AMD to the Rush Creek watershed is the site of an abandoned surface mine near Rehoboth, in the northeastern part of the watershed (fig. 2). In 1997, the Ohio Department of Natural Resources (ODNR) began a three-phase reclamation project of the site that included regrading and capping of the refuse with flue-gas desulfurization (FGD) by-product and installation of ponds through the creation of a series of low-head dams. ODNR's reclamation effort includes approximately 450 acres of land that has a long history of use (Bennett & Williams Environmental Consultants, Inc., 1995). A brief chronological history of the site is included; full details are listed in Bennett & Williams Environmental Consultants, Inc. (1995).
Figure 1. Water-quality sampling sites in the upper Rush Creek watershed, Perry County, Ohio.
This investigation builds on a large body of prior cooperative efforts between the USGS and the Ohio Department of Natural Resources-Division of Mineral Resources Management (ODNR-MRM)to characterize the hydrogeology and water quality in the coal-producing areas of southeastern Ohio. Previous efforts focused on classifying the entire region on the basis of AMD effects on surface water and ground water (Childress, 1985; Cunningham and Jones, 1990; Jones, 1988; Nichols, 1985; Razem and Sedam, 1985; Sedam, 1991; Westover and Eberle, 1987; Wilson, 1985, 1988). This study focused on a single watershed and added a biological component that had not previously been studied to this extent.
The purpose of this report is to describe the current (2003–04) water-quality conditions in the Rush Creek watershed, Perry County, Ohio. In doing so, this report also indicates the areas most affected by AMD. During 2003, a total of 54 water-quality samples were collected at 40 sites on the main stem of and tributaries to Rush Creek. The samples were analyzed for major ions, acidity, and alkalinity. In conjunction with the water-quality sampling, a full biological assessment was done at 18 sites. In 2004, a total of 20 water-quality samples were collected during low-flow conditions at 20 sites on the Rush Creek main stem and tributaries. Historical water-quality and biological data also were obtained from USGS and Ohio Environmental Protection Agency (EPA) databases. Water-quality and biological indices were compiled to compare main-stem and tributary conditions.
Rush Creek drains 234.5 mi 2 in Perry County, Ohio. The stream reaches of interest for this study drain about 45.6 mi 2 and include the headwaters downstream to about river mile 21.1. A reference site on Center Branch Rush Creek drains an additional 22.4 mi 2 at the confluence with Rush Creek at about river mile 20.85 (site 1009, fig.1). All of Rush Creek is in the Western Allegheny Plateau Ecoregion; part of the Center Branch Rush Creek watershed is in the Erie/Ontario Lake Plain Ecoregion (Ohio Environmental Protection Agency, 2002a). From 1931 to 1980, average annual precipitation within the Rush Creek watershed was 39–40 in/yr, and the average temperature was 52 o F (Harstine, 1991).
Perry County is in the Kanawha Section of the Appalachian Plateaus Physiographic Province (Fenneman and Johnson, 1946). The lower one-third of the study area was covered by Illinoian glacial drift and "gives rise to long gentle slopes rather than the more abrupt ones such as those found outside the glaciated areas" (Flint, 1951). The bottom of the Rush Creek valley is dominated by nearly level, poorly drained soils formed in lacustrine sediments, loess, and alluvium (Rubel and Jenny, 1988). In the glaciated upland area of the watershed, gently sloping to moderately steep, well-drained soils have formed in loess, glacial till, and residuum and colluvium derived from siltstone, sandstone, and shale (Rubel and Jenny, 1988).
The unglaciated part of Perry County consists primarily of rocks of Pennsylvanian and Mississippian age (Flint, 1951). Mississippian-age rocks are exposed in the deeper valleys that have not been filled with glacial sediment. Upland soils in the unglaciated area are dominated by nearly level to very steep, well-drained and moderately well drained soils formed in colluvium and residuum derived from sandstone, siltstone, shale, limestone, and in mine spoil (Rubel and Jenny, 1988).
The land cover in the Rush Creek watershed is predominantly agricultural (51 percent) and wooded (40.6 percent). The remaining land is urban (4.2 percent), scrub (1.2 percent), open water (0.8 percent), unforested (0.4 percent) and barren (1.8 percent) (U.S. Geological Survey, 2000). Barren land cover is indicative of unreclaimed strip mines.
Figure 2. Water-quality sampling sites near Rehoboth, Perry County, Ohio.
A search of the USGS National Water Information System (NWIS) database and the USEPA STORET database was done to identify locations of previously sampled water within the watershed. Tributaries and main stem sites between existing sites were investigated by doing field reconnaissance. After the database search and field reconnaissance, nine main-stem and nine tributary sites were selected for water-quality studies. During summer 2003, water-quality and biological sampling was done at all 18 sites. Initial analyses of these data indicated that a water-quality sample at the wastewater-treatment plant and one other tributary would be useful. These two sites were added to the low-flow sampling in 2004. Three sites were selected for intermittent sampling, and five or six samples were collected at each site over the 2-year period. Two subwatersheds were selected for more detailed water-quality studies: Turkey Run and the watershed near Rehoboth, Ohio. In 2004, during low flow, the original 18 sites, plus the 2 additional tributary sites, were again sampled.
Pertinent historical data were compiled from the USGS database prior to sampling. Five surface-water sites in the network for this study have historical USGS data associated with them (sites 1017, 1011, 1009, 1001, and 1018; fig. 1). The Ohio EPA provided historical fish and macroinvertebrate information for sites along Rush Creek and its tributaries; four sites from a previous Ohio EPA study (sites 1000, 1026, 1018, and 1006; fig.1) were included in the study network.
During the field reconnaissance of potential sites in the watershed that would best represent water quality, onsite measurements were made of specific conductance, pH, water temperature, dissolved-oxygen concentration, and in some cases, oxidation-reduction potential and streamflow. Stream-location coordinates were determined with a GPS receiver. All field-reconnaissance data were entered into a GIS database to be used for site selection.
Site selection was based on field measurements, drainage area, location, accessibility, and recommendations by staff at ODNR-MRM. The main-stem sites were selected to bracket the sites on the tributaries, one upstream and one downstream from each confluence. The tributary sites were selected to include as much of the flow into Rush Creek as possible. Center Branch Rush Creek was selected as a possible reference site of premining conditions. At the request of ODNR-MRM and in an attempt to explain preliminary results at the main-stem site 1018, an additional tributary site east of New Lexington (site 1050; fig. 1) was added in March 2004. To explain results from the first round of sampling in 2003, the effluent from the New Lexington wastewater-treatment plant (site 1051; fig. 1) was sampled during the low-flow synoptic in August 2004.
An additional 13 sites in the Rehoboth reclamation area were selected to provide more detailed information (fig. 2), and an additional 8 sites were selected in the Turkey Run subwatershed (fig. 3). Location information for all sites is listed in table 1.
Figure 3. Water-quality sampling sites in the Turkey Run subwatershed, Perry County, Ohio.
[mi 2 , square miles; --, not determined; RM, river mile]
| Map ID | USGS site ID | Site name | Latitude | Longitude | Drainage area (mi 2 ) |
|---|---|---|---|---|---|
| 1000 | 394307082175400 | Rush Creek 22.5 RM above mouth at Junction City | 39°43'07" | 82°17'54" | 35.3 |
| 1001 | 394317082164300 | 051 Rush Creek (28-4) near Junction City | 39°43'17" | 82°16'43" | 28.1 |
| 1002 | 394344082152200 | Unnamed tributary to Rush Creek near Junction City | 39°43'44" | 82°15'22" | 1.7 |
| 1003 | 394339082111500 | Unnamed tributary 0.25 RM above mouth near Rehoboth | 39°43'39" | 82°11'15" | 3.9 |
| 1006 | 394324082102900 | Rush Creek 30.3 RM above mouth near New Lexington | 39°43'24" | 82°10'29" | 2.6 |
| 1007 | 394323082200000 | Rush Creek 20.5 RM above mouth near Junction City | 39°43'23" | 82°20'00" | 39.5 |
| 1009 | 03156549 | Center Branch Rush Creek near Junction City | 39°43'24" | 82°20'36" | 24.7 |
| 1011 | 394214082160900 | 051 Turkey Run (28-6) near Junction City | 39°42'14" | 82°16'09" | 4.7 |
| 1012 | 394302082125500 | Unnamed tributary to Rush Creek at New Lexington | 39°43'02" | 82°P12'55" | 2.4 |
| 1014 | 394305082130000 | Rush Creek 27.8 RM above mouth at New Lexington | 39°43'05" | 82°P13'00" | 12.2 |
| 1015 | 394312082132800 | Rush Creek 27.3 RM above mouth at New Lexington | 39°43'12" | 82°13'28" | 16.8 |
| 1017 | 394313082130600 | 051 Unnamed tributary to Rush Creek (28-3) at New Lexington | 39°43'13" | 82°13'06" | 4.7 |
| 1018 | 394306082121900 | 051 Rush Creek (28-2) at New Lexington | 39°43'06" | 82°12'19" | 9.4 |
| 1023 | 394316082200000 | Dry Run near Junction City | 39°43'16" | 82°20'00" | 5.2 |
| 1024 | 394324082202400 | Rush Creek 20.2 RM above mouth near Junction City | 39.°.43'24" | 82°20'24" | 45.3 |
| 1025 | 394341082184300 | Unnamed tributary to Rush Creek at Junction City | 39°43'41" | 82°18'43" | 2.1 |
| 1026 | 394327082143800 | Rush Creek 26.2 RM above mouth near Mainsville | 39°43'27" | 82°14'38" | 23 |
| 1027 | 394314082140900 | Unnamed tributary to Rush Creek at Mainsville | 39°43'14" | 82°14'09" | 3.8 |
| 1050 | 394304082114600 | Unnamed tributary to Rush Creek near New Lexington | 39°43'04" | 82°11'46" | -- |
| 1051 | 394322082141100 | Wastewater-treatment plant | 39°43'22" | 82°14'11" | -- |
| 3000 | 394404082111400 | Seep 3000 near Rehoboth | 39°44'04" | 82°11'14" | -- |
| 3001 | 394359082111200 | Seep 3001 near Rehoboth | 39°43'59" | 82°11'12" | -- |
| 3002 | 394416082112600 | Seep 3002 near Rehoboth | 39°44'16" | 82°11'26" | -- |
| 3003 | 394418082112700 | Seep 3003 near Rehoboth | 39°44'18" | 82°11'27" | -- |
| 3004 | 394425082112300 | Tile drain 3004 near Rehoboth | 39°44'25" | 82°11'23" | -- |
| 3005 | 394426082112200 | Pond drain 3005 near Rehoboth | 39°44'26" | 82°11'22" | -- |
| 3006 | 394441082111800 | Unnamed tributary near Rehoboth | 39°44'41" | 82°11'18" | -- |
| 3007 | 394409082112500 | Seep 3007 near Rehoboth | 39°44'09" | 82°11'25" | -- |
| 3008 | 394351082110800 | Seep 3008 near Rehoboth | 39°43'51" | 82°11'08" | -- |
| 3009 | 394440082112300 | Unnamed tributary at Rehoboth | 39°44'40" | 82°11'36" | -- |
| 3010 | 394426082113600 | 051 Unnamed tributary to Rush Creek (28-1) at Rehoboth | 39°44'26" | 82°11'36" | 1.6 |
| 3011 | 394412082112800 | Unnamed tributary 1.1 RM above mouth at Rehoboth | 39°44'12" | 82°11'28" | -- |
| 3012 | 394407082112000 | Unnamed tributary 0.95 RM above mouth at Rehoboth | 39°44'07" | 82°11'20" | -- |
| 5000 | 394115082154700 | Tributary to Turkey Run near Bristol Station | 39°41'15" | 82°15'47" | -- |
| 5001 | 394207082155100 | Tributary to Turkey Run near Clarksville | 39°42'07" | 82°15'51" | -- |
| 5002 | 394211082152600 | Tributary to Turkey Run near Mainsville | 39°42'11" | 82°15'26" | -- |
| 5003 | 394030082135900 | Turkey Run at Bristol | 39°40'30" | 82°13'59" | -- |
| 5004 | 394051082142800 | Turkey Run at Bristol Station | 39°40'51" | 82°14'28" | -- |
| 5005 | 394205082152600 | Turkey Run at RCCD Dam | 39°42'05" | 82°15'26" | -- |
| 5006 | 394209082154200 | Turkey Run at Township Road 131 near Junction City | 39°42'09" | 82°15'42" | -- |
| 5007 | 394121082145400 | Turkey Run near Bristol Station | 39°41'12" | 82°.14'54" | -- |
Characteristics from the low-flow, partial-record station on Rush Creek (03156550) were used for the estimation of flow duration. This station is no longer operating, but the stream characteristics were confirmed by Straub (2001). Station 03156550 is just downstream from the confluence with Center Branch Rush Creek (fig. 1) and accounts for 71 mi 2 of the Rush Creek drainage area. About 99 percent (70 mi 2 ) of the 71 mi 2 can be accounted for by combining the drainage areas of sites 1024 and 1009 (fig. 1).
According to Straub (2001), the streamflow that needs to be equaled or exceeded to meet median flow (50th percentile) at station 03156550 for the period May through November is 12 ft 3 /s. The combined streamflow for sites 1009 and 1024 during the August 2003 sampling were 16.2 ft 3 /s (about 45 percent duration), just above median flow. The combined streamflow for sites 1024 during the August 2004 sampling was 8.5 (ft 3 /s) (about 60 percent duration), just below median flow. Ideally, the low-flow sampling should have been done closer to combined streamflows of about 6 ft 3 /s (70 percent duration). However, because of to above-average precipitation during summers 2003 and 2004, conditions were generally wet, and flows in August 2004 were the lowest during the duration of the project.
The moderate-flow synoptic sampling was targeted to determine water quality at median or above-median flow. These flow conditions were observed on August 5 and 6, 2003, and two sampling teams collected water-quality samples and measured streamflow at 18 selected sites. Ten samples were collected on August 5, and the remaining eight were collected on August 6. Hydrologic conditions remained consistent throughout the sampling period.
The low-flow synoptic was targeted to determine maximum constituent concentrations, which generally occur during low-flow conditions. These flow conditions were observed on August 17–18, 2004, and two sampling teams collected water-quality samples and measured streamflow at 20 selected sites. Ten samples were collected on August 17, and the remaining 10 samples were collected on August 18. Two additional sites were sampled during this period that were not sampled in 2003: one at a tributary to Rush Creek east of New Lexington (site 1050; fig.1) and the second at the New Lexington wastewater-treatment plant (site 1051; fig.1). Hydrologic conditions remained consistent throughout the sampling period.
These data were collected for a comparison to historical data and to assist others in a total maximum daily load modeling effort. Three sites were chosen for more frequent sampling. The first site is just below the confluence of the unnamed tributary flowing through the reclamation area with Rush Creek (site 1018; fig.1). The second site was chosen by dividing the total drainage area in half and selecting the site closest to the midpoint (site 1001; fig.1). The third site is at the bridge near the bottom of the watershed (site 1007; fig.1).
An additional 13 sites were selected in the Rehoboth reclamation area to obtain more detailed information in the subwatershed containing the reclamation area near Rehoboth (fig. 2). The samples from the reclamation area were collected between August 26 and September 10, 2003.
Preliminary results from the first round of sampling indicated a source of AMD in the Turkey Run subwatershed. To help define the source, an additional eight water-quality samples were collected in the Turkey Run subwatershed (fig. 3) on December 16 and 17, 2003.
Onsite measurements of streamflow, specific conductance, dissolved oxygen, pH, water temperature, alkalinity, and acidity were made for each sample. Streamflow was measured by the methods described in Rantz and others (1982). Specific conductance, pH, water temperature, and alkalinity were measured by the methods described in the "National Field Manual for the Collection of Water-Quality Data" (Wilde and Radtke, var.). Samples for laboratory analysis were collected according to methods in the USGS National Field Manual (Wilde and others, 1999), and the samples were shipped to the USGS National Water Quality Laboratory (NWQL) in Denver, Colo. All samples were analyzed for the dissolved phase of constituents that included calcium, magnesium, potassium, sodium, bromide, chloride, fluoride, silica, sulfate, aluminum, boron, iron, and manganese. Twenty-two samples were selected for analyses of the dissolved constituents and additional constituents of total aluminum, arsenic, cadmium, chromium, cobalt, copper, total iron, lead, lithium, silver, total manganese, nickel, selenium, strontium, vanadium, and zinc. All water-quality data are available in the 2003 and 2004 USGS annual water-data reports for Ohio (Shindel and others, 2004 and 2005)
Instantaneous loads were computed by multiplying the concentration of constituents by the streamflow at the time of sampling and converting the units to kilograms per day (kg/d). Total metal loads were determined by combining the loads of iron, aluminum, and manganese.
The following field procedures were used to collect information to compute the net alkalinity. Alkalinity and hot peroxide titrations were run in the field as soon as possible after the sample was collected.
Net alkalinity was computed as the alkalinity minus acidity. Using this designation, water with a positive net alkalinity is considered alkaline, and water with a negative net alkalinity is considered acidic.
In this study, the Ohio EPA's biocriteria for stream-use designation were the basis for comparing the ability of each site to support aquatic life. The use designation assigned to each site in this report is not an Ohio EPA official designation. It is used only as a way to compare different areas. The last Ohio EPA assessment of the Rush Creek watershed, in 1982, stated that Rush Creek from the headwaters to the confluence with Little Rush Creek at river mile 15.7 is Limited resource water-Acid mine drainage (LRW-AMD) (Ohio Environmental Protection Agency, 2002b).
A combination of biological, chemical, and physical attributes was used to determine stream-use attainment levels for aquatic life and habitat for 18 sites in the Rush Creek watershed. For aquatic life, attainment was based on the Ohio Water Quality Standards (WQS; Ohio Environmental Protection Agency, 2002a), which include the Index of Biotic Integrity (IBI), modified Index of Well-Being (IWB), and the Invertebrate Community Index (ICI). For habitat, the Qualitative Habitat Evaluation Index (QHEI) was used. This index measures the physical features of habitat that affect fish populations and are important to macroinvertebrates and other aquatic communities (Rankin, 1989).
The aquatic-life attainment status can be full or partial attainment or nonattainment based on the following criteria:
Partial attainment and nonattainment indicate that the site is impaired and does not meet the aquatic-use criteria specified by the Ohio WQS (Ohio Environmental Protection Agency, 1997).
Data collected during a fish survey were used to compute the Index of Biotic Integrity (IBI) developed by Karr (1981; Fausch and others, 1984; Karr and others, 1986) and the Index of Well-Being (IWB) modified from Gammon (1976; Gammon and others, 1981). The IBI uses a multiple-metric approach to evaluate fish communities. The IWB was developed to evaluate the response of fish populations in rivers and streams to disturbance. Criteria for the IBI and IWB were defined by the Ohio EPA for each of the five ecoregions in Ohio, as well as the three stream sizes (headwater, wadeable, and boat). IBI scores range from a minimum of 12 to a maximum of 60.
Fish were sampled by means of electrofishing at 18 of the water-quality sites (fig.1). At 12 of the 18 sites, the electrofishing was done in conjunction with the installation of the macroinvertebrate sampling devices that began July 14. Upstream sites were sampled first; sampling followed a general progression downstream until July 18. Because of frequent rainfall, electrofishing at the final six sites did not resume until August 13 and was completed on August 15.
The survey followed the standard procedures adopted by the Ohio EPA (1987a, 1987b, 1989a, 1989b). These procedures describe specific gear, power source, power output, anode location, sampling direction, and distance sampled for the stream type.
Twelve of the 18 water-quality sites have drainage areas less than 20 mi 2 and were sampled according to procedures suitable for headwater streams. The remaining six sites required more rigorous procedures, including a boat and generator equipped for wadeable-type streams.
Macroinvertebrate data collected during this study were used to compute the Invertebrate Community Index (ICI), which was developed by the Ohio EPA and has become a widely accepted method to measure the condition of macroinvertebrate communities. The ICI can be used to compare the biological community in a study stream to other communities from reference streams of similar size within the same ecoregions (Karr and others, 1986; DeShon, 1995). Similar to the IBI, the ICI is a multiple metric method developed to evaluate macroinvertebrate populations (Ohio Environmental Protection Agency, 1987a). ICI scores range from a minimum of 0 to a maximum of 60.
Part of the ICI was determined by a qualitative method that included a sample collected with a D-framed dipnet at each site (Lenat, 1988). A qualitative sample is collected from all the available natural substrates. Target species from the qualitative sampling are the pollution-sensitive members of the taxonomic orders Ephemeroptera, Plecoptera, and Trichoptera (EPT), representing mayflies, stoneflies, and caddisflies. Members in these groups as a whole are more sensitive to disturbance and pollution than other groups found living in streams. A qualitative sample is collected at the end of the quantitative survey.
The quantitative part of the survey of macroinvertebrate communities was done by means of Hester-Dendy samplers (Hester and Dendy, 1962). Quantitative samples were collected after a 6-week colonization period that begins on or after June 15 and ends on or before September 30 (Ohio Environmental Protection Agency, 1987b). Macroinvertebrates were sampled at 18 of the water-quality sites. The Hester-Dendy sampler installation began July 14 and extended through July 24. Retrieval of sampling devices was scheduled to begin August 25. The stream velocity at one site (1009) had fallen below the minimum of 0.3 ft/s required by the Ohio EPA, Division of Surface Water. Sampling devices at three other sites (1001, 1018, and 1026) were covered with sediment, rendering them useless. On August 21, sampling devices were reset at sites 1001, 1009, and 1026. The device at site 1018 was not reset because the unfavorable conditions were not recognized until too late in the season to obtain a representative sample. Retrieval of the 15 original samplers began on August 25 and ended on September 5. The three remaining sampling devices (at sites 1001, 1009, and 1026) were retrieved on October 1.
The potential for a stream to support aquatic life is related to the quality and quantity of habitat. The QHEI is a visual estimate of habitat features in a stream (Rankin, 1995). Similar to the IBI and ICI, criteria used for computing a QHEI consist of five metrics. Each metric includes a list of descriptors pertaining to key features in a typical stream. Those features found in streams with high biological diversity receive the highest score. Scores decrease progressively as streams display less desirable features in habitat. The QHEI score ranges from a minimum of 5 to a maximum of 100 points. The QHEI for 18 of the water-quality sites was determined during the fish surveys of July 14–18, and August 13–15, 2003.
On the basis of IBI, IWB, ICI, and QHEI scores listed in table 2, each study site was evaluated and assigned one of the following Ohio EPA stream-use designations:
Table 2. Biocriteria for streams in the Allegheny Plateaus region.
[NA, not applicable; stream-use designation requirements from Ohio Environmental Protection Agency, 2002a, and Ohio Environmental Protection Agency, 1997]
| Criteria | Exceptional warmwater habitat | Warmwater habitat | Modified warmwater habitat | Limited resource water— Acid mine drainage |
|---|---|---|---|---|
| Qualitative Habitat Evaluation Index | 75 | 60 | 45 | NA |
| Invertebrate Community Index | 46 | 36 | 30 | 8 |
| Index of Biotic Integrity |
a
50 b 48 |
a
44 b 40 |
24 | 18 |
| Index of Well-Being |
a
9.4 b 9.6 |
a
8.4 b 8.6 |
a
5.5 b 5.4 |
a
4.0 b 4.0 |
a Wading sites.
b Boat sites.
Constituent concentrations from this study are compared to Ohio EPA standards for drinking water. The standards apply only to drinking water and are discussed here as a reference point. Constituent concentrations and physical properties from this study are also compared to U.S. Environmental Protection Agency (USEPA) standards that are used to determine waters that may be affected by AMD. The two synoptics (low and moderate streamflow) are discussed and compared.
The only surface water used as public-water supply within the Rush Creek watershed is a reservoir used by the city of New Lexington above site 1017. Drinking-water standards are listed in table 3. The standards apply to finished drinking water only and are presented here as reference points. Secondary Maximum Contaminant Level (SMCL) is a nonenforceable, esthetically based standard set by the USEPA and modified by states for public drinking water. SMCLs are established for constituents that can adversely affect the odor and appearance of water.
[USEPA, U.S. Environmental Protection Agency; SMCL, Secondary Maximum Contaminant Level; mg/L, milligrams per liter; µS/cm, microsiemens per centimeter; CaCO 3 , calcium carbonate; >, greater than; <, less than; NE, none established. SMCLs based on standards set by the Ohio Environmental Protection Agency (2002c)]
| Constituent or property | SMCL | Concentration limits and water-use implications | Number of the 74 water-quality samples collected greater than SMCL |
|---|---|---|---|
| Specific conductance, µS/cm | NE | Regulatory standards not established with respect to drinking water. | NE |
| pH, standard units | >7.0 and <10.5 | Values outside this range may be corrosive to metal well casings and pipes, creating costly replacement problems. A pH below 6.5 can generate health-related problems by dissolving small quantities of trace metals such as lead, especially in a house built before lead solder was banned in 1987. | 62 |
| Magnesium, dissolved, mg/L | NE | Regulatory standards not established with respect to drinking water. Contributes to hardness and scale formation. At high concentrations (>125 mg/L) may cause laxative effects, especially to transient users. | NE |
| Sodium, dissolved, mg/L | NE | Regulatory standards not established with respect to drinking water, but is listed on the USEPA Drinking Water Contaminant Candidate List (CCL) as a Research Priority. | NE |
| Alkalinity, mg/L as CaCO 3 | NE | Regulatory standards not established with respect to drinking water. Alkalinity is a measure of the capacity of a water to neutralize acid. | NE |
| Sulfate, dissolved, mg/L as SO 4 | 250 mg/L | Combines with calcium to form scale in water heaters and boilers. At concentrations exceeding 500–600 mg/L, imparts a bitter taste and may cause laxative effects in some individuals. | 54 |
| Chloride, dissolved, mg/L | 250 mg/L | At concentrations greater than 250 to 400 mg/L, imparts a salty taste to water depending on individual tolerance. High concentrations are corrosive to most metals. | 0 |
| Aluminum, dissolved, mg/L | 0.05 to 0.2 mg/L | At concentrations exceeding the SMCL, aluminum may discolor water and cause scaling or sedimentation problems. | 54 |
| Boron, dissolved, mg/L | NE | Regulatory standards not established with respect to drinking water. No health or esthetic implications for the range of concentrations found in this study. Boron is essential for plant nutrition but is toxic to some plants at high concentrations. | NE |
| Iron, dissolved, mg/L | 0.3 mg/L | At concentrations exceeding the SMCL, iron contributes to staining of fixtures, utensils, and laundry. Higher concentrations form reddish-brown sediment and water-line deposits. At concentration greater than 1.8 mg/L the water has a metallic taste. | 55 |
| Manganese, dissolved, mg/L | 0.05 mg/L | At concentrations exceeding the SMCL, manganese may cause dark-brown or black staining of fixtures, utensils, and laundry. | 73 |
Criteria listed in table 4 were created by the USEPA to suggest when water may be affected by AMD. By these criteria, at least 28 of the 41 sites in this study are possibly affected by AMD.
[mg/L, milligrams per liter; µS/cm, microsiemens per centimeter]
| Property or constituent | Limit | Number of the 41 study sites greater than the limit |
|---|---|---|
| Iron | 0.5 mg/L | 31 |
| Manganese | 0.5 mg/L | 35 |
| Aluminum | 0.3 mg/L | 29 |
| Specific conductance | 800 µS/cm | 28 |
| Sulfate | 74 mg/L | 38 |
| Alkalinity | 20 mg/L (upper limit) | 28 |
| pH | 6 (upper limit) | 28 |
Total metal load, net alkalinity load, and streamflow for the August 2003 moderate-flow synoptic on the main stem of Rush Creek are presented in figure 4; tributary data are presented in figure 5. Metal loads increase from site 1006 (the most upstream) through site 1015 (fig. 4). Downstream from site 1015 the metal loads decrease slightly, whereas the net alkalinity load follows an inverted pattern. The downstream decrease of metals loads could be a combination of natural attenuation and (or) dilution. The water from the tributaries not only dilutes the constituents already in the creek but also may cause iron to precipitate as Fe(OH) 3 , owing to addition of water with a pH greater than 5. A wastewater-treatment plant discharges to Rush Creek between sites 1015 and 1027; the effluent was not sampled in August 2003, but it was added to the sampling schedule for the low-flow sampling in 2004. Metal load is the sum of iron, manganese, and aluminum loads; positve net alkalinity is alkaline; negative net alkalinity is acidic.
The highest metal load and the most acidic load in the tributaries were from site 1003 (fig. 5). With a metals load 3 times larger than the next closest tributary load (265 kg/d) and a net alkalinity load 5 times more acidic than that of the next closest load (-1,670 kg/d), this tributary was the single largest surface-water contributor of AMD to the Rush Creek watershed. During the same flow conditions, the reference site at Center Branch Rush Creek (site 1009) added a net alkalinity load equal to 1,300 kg/d. Site 1050 was sampled in March 2004 but is included with this graph as a baseline point. Metal load is the sum of iron, manganese, and aluminum loads; positve net alkalinity is alkaline; negative net alkalinity is acidic.
The pH at the headwaters (site 1006) was 3.8 and decreased to 2.8 at site 1018 and then increased to 4.7 at the bottom of the study area (site 1024; fig. 6). Main-stem water appears to have high buffering capacity because inputs of high-pH waters from tributaries downstream from 1014 had little effect on overall pH rise (for example, input of pH 7 from 1017 water raised pH in the main stem from 2.9 to 3.0).
Figure 6. pH in the Rush Creek watershed, Perry County, Ohio, 2003.
Boron, which can be toxic to very tolerant vegetation at concentrations of 6 to 15 mg/L (Ayers and Westcot, 1994), is present in FGD by-product applied at the reclamation site and as a trace element in coal (Hupe and Dziubek, 1984; Botoman and Stith, 1978). Other sources of boron include glass manufacturing, use of borates (cleaning compounds) in the home and industry, leaching from treated wood, and sewage. Boron concentrations for the August 2003 moderate-flow synoptic peaked at site 1006 (0.152 mg/L), steadily decreased downstream to site 1015, and then increased slightly at sight 1026, which is just below the wastewater-treatment plant (fig. 7).
Figure 7. Boron concentrations in the Rush Creek watershed, Perry County, Ohio, 2003.
Site 1003 had the highest boron concentration of the tributaries (0.103 mg/L in August 2003). During the subwatershed detailed study (August 26–September 10, 2003) at the Rehoboth reclamation site (upstream from site 1003 in the subwatershed where the FGD was applied), boron concentrations were as high as 1.16 mg/L; median concentration was 0.166 mg/L. In contrast, the subwatershed study on Turkey Run (with no known FGD by-product application in the subwatershed) showed a maximum boron concentration of 0.59 mg/L and a median of 0.035 mg/L. The 1.16-mg/L concentration is significant because, at this level, boron is toxic to moderately sensitive plants (Ayers and Westcot, 1994) and possibly to the vegetation used as ground cover in reclamation efforts.
The basis of Ohio EPA standards for stream use and biological samples, the upper reaches of Rush Creek, from the headwaters downstream to Center Branch Rush Creek, revealed very poor to poor conditions for aquatic organisms (table 5). Fish and macroinvertebrate communities and stream habitat failed to attain full WWH criteria at all of the water-quality sites on the main stem of Rush Creek, supporting the Ohio EPA official designation of the upper reaches of Rush Creek and its tributaries as LRW-AMD. Of the biological data collected, macroinvertebrate results (ICI) varied the most between main-stem sites (table 4). Biological data at each site are discussed in more detail in the "Site Characterization" section.
[RM, river mile, designates RM on Rush Creek at the confluence of tributary; mi 2 , square miles; IBI, Index of Biotic Integrity; IWB, Index of Well-Being; —, not applicable; QHEI, Qualitative Habitat Evaluation Index; ICI, Invertebrate Community Index; LRW-AMD, Limited resource water-Acid mine drainage; ND, no data; WWH, Warmwater habitat, BOLD type indicates meeting LRW-AMD standard; ITALIC font indicates meeting WWH standard]
| Site | RM | Drainage area (mi 2 ) | IBI | IWB | QHEI | ICI | LRW-AMD attainment status |
|---|---|---|---|---|---|---|---|
| Main stem | |||||||
| 1006 | 31 | 2.6 | 12 | — | 51 | 2 | Non |
| 1018 | 29.3 | 9.1 | 12 | — | 49 | ND | Non |
| 1014 | 28.6 | 12.2 | 12 | — | 51 | 4 | Non |
| 1015 | 28.2 | 16.8 | 12 | — | 51 | 10 | Non |
| 1026 | 27.1 | 23 | 14 | 2.4 | 45 | 2 | Non |
| 1001 | 25 | 28 | 12 | 1.6 | 50 | 2 | Non |
| 1000 | 23.4 | 35.3 | 14 | 2.7 | 49 | 0 | Non |
| 1007 | 21.4 | 39.5 | 30 | 4.2 | 43 | 16 | Full |
| 1024 | 21.1 | 45.6 | 14 | 3.5 | 44 | 30 | Non |
| Tributaries | |||||||
| 1003 | 30.32 | 3.9 | 12 | — | 49 | 10 | Non |
| 1012 | 28.65 | 2.4 | 12 | — | 42 | 2 | Non |
| 1017 | 28.46 | 4.6 | 26 | — | 48 | 32 | Full |
| 1027 | 27.4 | 3.8 | 26 | — | 61 | 40 | Full |
| 1002 | 26.13 | 1.7 | 28 | — | 57 | 30 | Full |
| 1011 | 24.37 | 4.6 | 32 | — | 54 | 4 | Non |
| 1025 | 22.38 | 2.1 | 32 | — | 59 | 50 | Full |
| 1023 | 22.18 | 5.2 | 28 | — | 51 | 30 | Full |
| 1009 | 20.85 | 22.4 | 42 | 7.0 | 73 | 40 | Partial 1 |
1 Site 1009 met partial attainment for WWH.
Sensitive EPT taxa were found at sites where fish were present and were not found at sites where fish were absent. One green sunfish was collected at site 1006, and then fish were not observed again until site 1026. One mayfly was collected at site 1006, and then the EPT taxa disappeared until site 1026. Macroinvertebrate samples collected at sites below site 1026 contained EPT taxa. Site 1024 failed to attain LRW-AMD criteria because the IBI and IWB did not meet the respective benchmarks.
The total metal load increased from site 1006 to site 1018, remained constant from site 1018 to site 1026, and then decreased slightly from site 1026 to the bottom of the reach at site 1024 (fig. 8). This pattern is similar but not identical to that found in 2003. During low flow (2004), net alkalinity load peaks were similar to those in 2003 but did not move from acidic to alkaline as quickly (fig. 8). For the 18 sampling sites that were sampled in 2003 and 2004, the median pH dropped from 4.2 to 3.5, and the net alkalinity became more acidic (median net alkalinity in 2003 of -500 kg/d and -1,000 kg/d in 2004). Metal load is the sum of iron, manganese, and aluminum loads; positve net alkalinity is alkaline; negative net alkalinity is acidic.
During low flow in 2004, the largest contribution of metals came from site 1003 (fig. 9). From 2003 to 2004, the net alkalinity load from this tributary became slightly less acidic (-1,670 kg/d in 2003 and -1,480 kg/d in 2004), and the metals load was lower (332 kg/d in 2003 to 268 kg/d in 2004). The flow reduction was about 46 percent (2.2 ft 3 /s in 2003 and 1.2 ft 3 /s in 2004). The net alkalinity load from Center Branch Rush Creek (site 1009), which met standards for partial WWH attainment, was 1,300 kg/d in 2003 (fig. 5) and 504 kg/d in 2004 (fig. 9) corresponding to a flow reduction of about 68 percent (6.2 to 2.0 ft 3 /s). Metal load is the sum of iron, manganese, and aluminum loads; positve net alkalinity is alkaline; negative net alkalinity is acidic.
The pH at the headwaters (site 1006) was 3.3 and dropped to 2.8 at site 1018, then gradually increased to 3.5 at site 1024 (fig. 10). This pattern is similar to that for median flows of 2003 except that the overall pH in the main stem was generally lower and less variable in 2004. The median pH during the 2003 moderate-flow synoptic was 3.5 (maximum was 4.7), and the median pH during the 2004 low-flow synoptic was 3.1 (maximum was 3.5).
Figure 10. pH in Rush Creek watershed, Perry County, Ohio, 2004.
During the 2003 investigation, it was noted that the boron concentration in the main stem of Rush Creek was slightly elevated just downstream from the wastewater-treatment plant. A sample of the effluent from the wastewater-treatment plant was collected during the low-flow investigation in 2004. The median boron concentration during low-flow conditions in the main stem was 0.0898 mg/L; the peak on the main stem was at site 1000, at 0.147 mg/L (fig. 11). The peak boron concentration in the tributaries was at site 1051 (0.249 mg/L), which is the effluent from the wastewater-treatment plant. The boron concentration from site 1003 was 0.135 mg/L. None of these concentrations would be toxic to vegetation (Ayers and Westcot, 1994).
Figure 11. Boron concentrations in the Rush Creek watershed, Perry County, Ohio, 2004.
Each site is described in detail concerning biologic life and habitat. Water quality is presented at sites where the USGS has collected historical water-quality data that can be compared with the water-quality data collected in 2003–2004. Samples collected in 2003 were at flow conditions above median flow, and samples collected in 2004 were at or near low-flow conditions. Water quality is also discussed at the three sites used for intermittent studies and two subwatersheds that were selected for detailed studies. In this section the main-stem sites are presented in order from upstream to downstream, followed by the tributaries, also presented in order from upstream to downstream.
Although QHEI numbers will be discussed for each site, no QHEI benchmark is established for LRW-AMD sites because this designation applies to waters receiving severe AMD from abandoned mine lands. The QHEI presented in the following section is used to compare sites in this study and provide a benchmark to evaluate future reclamation. A table of fish and macroinvertebrates collected at each site is presented in Appendix 1.
| Name: | Rush Creek 30.3 river miles above mouth near New Lexington —USGS station identification number 394324082102900 |
| Location: | River mile 31 |
| USGS Quadrangle: | New Lexington |
| Drainage Area: | 2.6 mi 2 |
Only one green sunfish was collected, resulting in an IBI score of 12; the lowest possible score is 12, even if no fish are collected. Green sunfish are highly pollution tolerant. An IWB was not done because the drainage area is less than the 20-mi 2 minimum.
Macroinvertebrate samples included nine total taxa. The quantitative portion of macroinvertebrate sampling yeilded 55 organisms in 8 distinct taxa, including a Caenis sp. mayfly (an EPT member). Qualitative sampling with a dipnet showed four distinct taxa, including the Caenis sp. mayfly. The ICI score for this site was 2.
The QHEI score for habitat was 51. Sand and silt were the major substrates in the stream channel. Substrate quality was poor because of the amount of silt and degree of embeddedness. Coal fines were present. The sediment layer was approximately 3 ft deep and made walking very difficult. Instream cover was sparse. Channel sinuosity was moderate. Poor development and low stability characterized the channel. A moderate to wide corridor of mature trees bordered the stream. Pool/current quality scored 9 out of a possible 12, and riffle/run scored 0 out of 8. Site 1006 failed to meet the LRW-AMD category because neither the IBI nor the ICI met the respective aquatic use.
In 2004, the metals load was slightly higher and the net alkalinity load was more than 2 times more acidic than that of 2003. The sulfate load was 2 times lower in 2004 than in 2003. Iron concentrations were 12 times higher; manganese concentrations were 3 times higher; and aluminum concentrations were 2 times higher in 2004 than in 2003. Streamflow was 3 times lower and the boron concentration was about 2 times lower in 2004 than in 2003. At this site, metal loads were generally lower and net alkalinities were generally more alkaline than the next three main-stem sites, indicating significant AMD inputs to Rush Creek between sites 1006 and 1015 that adversely affect water quality.
For both samples collected at this site, iron, manganese, aluminum, specific conductance, sulfate, alkalinity, and pH exceeded the criteria that suggest AMD impacts (table 4).
Concentration of major ions and field-measured characteristics at site 1006, Rush Creek, Perry County, Ohio.
[ft 3 /s, cubic feet per second; mg/L, milligrams per liter; µS/cm, microsiemens per centimeter; --, not determined]
| Date | Streamflow (ft 3 /s) | pH, field | Specific conductance, field (µS/cm) | Calcium, dissolved (mg/L) | Magnesium, dissolved (mg/L) | Potassium, dissolved (mg/L) | Sodium, dissolved (mg/L) | Acidity, hot peroxide (mg/L as CaCO 3 ) | Alkalinity (mg/L as CaCO 3 ) |
|---|---|---|---|---|---|---|---|---|---|
| 08/05/03 | 1.4 | 3.8 | 1,970 | 179 | 101 | 6.43 | 68.5 | 50 | -- |
| 08/18/04 | .49 | 3.3 | 2,630 | 279 | 217 | 7.73 | 42.9 | 302 | -- |
| Date | Bromide, dissolved (mg/L) | Chloride, dissolved (mg/L) | Fluoride, dissolved (mg/L) | Silica, dissolved (mg/L as SiO 2 ) | Sulfate, dissolved (mg/L as SO 4 ) | Aluminum, dissolved (mg/L) | Boron, dissolved (mg/L) | Iron, dissolved (mg/L) | Manganese, dissolved (mg/L) |
|---|---|---|---|---|---|---|---|---|---|
| 08/05/03 | 0.13 | 20.5 | 0.5 | 13.9 | 1,180 | 2.55 | 0.152 | 7.68 | 23.9 |
| 08/18/04 | .19 | 21.2 | 1.0 | 28.6 | 1,880 | 7.04 | .082 | 90.8 | 42.3 |
Instantaneous loads for selected constituents at site 1006, Rush Creek, Perry County, Ohio.
[ft 3 /s, cubic feet per second; kg/d, kilograms per day]
| Date | Streamflow (ft 3 /s) | Net alkalinity load (kg/d) | Sulfate load (kg/d) | Aluminum load (kg/d) | Iron load (kg/d) | Manganese load (kg/d) | Metal load (kg/d) |
|---|---|---|---|---|---|---|---|
| 08/05/03 | 1.4 | -171 | 4,040 | 8.7 | 26 | 82 | 117 |
| 08/18/04 | .49 | -362 | 2,250 | 8.4 | 109 | 51 | 168 |
| Name: | 051 Rush Creek (28-2) at New Lexington—USGS station identification number 394306082121900 |
| Location: | River mile 29.3 |
| USGS Quadrangle: | New Lexington |
| Drainage Area: | 9.1 mi 2 |
No fish were collected, scoring 12 for an IBI. Previous sampling done by the Ohio EPA in 1982 near site 1018 did not find fish. No ICI is available for this station because the quantitative portion was lost when the Hester-Dendy samplers were buried by the shifting channel. Qualitative sampling with a dipnet showed seven distinct taxa. None of these taxa were EPT members. Qualitative sampling done in 1982 by the Ohio EPA near site 1018 yeilded two taxa. Neither of these taxa belonged to the EPT group either.
The QHEI for habitat was 49. Sand was the major substrate in the stream channel. Substrate quality was poor because of the amount of silt and degree of embeddedness. Coal fines were present. Litter was strewn throughout the channel and along the banks. Instream cover was moderate. Riprap lined the banks. The channel was characterized by poor development and low stability. A field comment described the site as "a channel of sand." A very narrow corridor of less than 15 ft protected the stream from residential land use. Pool/current quality scored 8 out of a possible 12, and riffle/run scored 0 out of 8; the only riffle in the study reach was directly under the bridge and a result of bricks and other smaller forms of riprap. Site 1018 failed to meet the LRW-AMD category because the IBI and the narrative macroinvertebrate evaluation failed to meet the respective aquatic use.
This site, in the city limits of New Lexington, was chosen as one of the three sites to collect intermittent water-quality samples. In addition to the 2003 and 2004 synoptic sampling, four more water-quality samples were collected and analyzed. The highest total metal load occurred during spring runoff (3/10/04), but the highest concentrations were recorded during the low-flow sampling (8/18/04).
Comparing the 2003 synoptic to the 2004 synoptic, the metals and the net alkalinity load are about the same. The sulfate load was slightly lower in 2004 than in 2003. Iron, manganese, and aluminum concentrations were higher in 2004 than in 2003; the streamflow that was 2 times lower; the boron concentration was unchanged. For all six samples collected at this site, iron, manganese, aluminum, specific conductance, sulfate, alkalinity, and pH exceeded the criteria that suggest AMD impacts (table 4).
Concentration of major ions and field-measured characteristics at site 1018, Rush Creek, Perry County, Ohio.
[ft 3 /s, cubic feet per second; mg/L, milligrams per liter; µS/cm, microsiemens per centimeter; --, not determined; BOLD type indicates samples collected during a synoptic]
| Date | Streamflow (ft 3 /s) | pH, field | Specific conductance, field (µS/cm) | Calcium, dissolved (mg/L) | Magnesium, dissolved (mg/L) | Potassium, dissolved (mg/L) | Sodium, dissolved (mg/L) | Acidity, hot peroxide (mg/L as CaCO 3 ) | Alkalinity (mg/L as CaCO 3 ) |
|---|---|---|---|---|---|---|---|---|---|
| 08/05/03 | 4.0 | 2.8 | 2,060 | 148 | 87.7 | 6.27 | 30.2 | 226 | -- |
| 09/24/03 | 10 | 3.5 | 1,380 | 89.9 | 53.1 | 4.84 | 13.4 | 69 | -- |
| 10/21/03 | 4.4 | 3.3 | 1,800 | 123 | 78.6 | 5.80 | 18.0 | 207 | -- |
| 12/16/03 | 8.2 | 3.4 | 1,270 | 93.7 | 60.7 | 3.55 | 13.0 | 141 | -- |
| 03/10/04 | 9.0 | 3.7 | 1,540 | 107 | 73.5 | 3.53 | 13.7 | 208 | -- |
| 08/18/04 | 2.4 | 2.8 | 2,660 | 199 | 144 | 6.85 | 22.5 | 390 | -- |
| Date | Bromide, dissolved (mg/L) | Chloride, dissolved (mg/L) | Fluoride, dissolved (mg/L) | Silica, dissolved (mg/L as SiO 2 ) | Sulfate, dissolved (mg/L as SO 4 ) | Aluminum, dissolved (mg/L) | Boron, dissolved (mg/L) | Iron, dissolved (mg/L) | Manganese, dissolved (mg/L) |
|---|---|---|---|---|---|---|---|---|---|
| 08/05/03 | 0.24 | 26.1 | 0.7 | 25.3 | 1,050 | 13.1 | 0.107 | 18.6 | 15.7 |
| 09/24/03 | .11 | 20.8 | .6 | 17.4 | 737 | 8.19 | .076 | 13.5 | 10.5 |
| 10/21/03 | .20 | 25.9 | .7 | 20.3 | 1,030 | 11.1 | .084 | 23.5 | 14.8 |
| 12/16/03 | .17 | 22.8 | .6 | 18.2 | 749 | 7.76 | .056 | 26.7 | 11.2 |
| 03/10/04 | .17 | 18.0 | .7 | 19.9 | 1,040 | 12.3 | .052 | 35.3 | 12.9 |
| 08/18/04 | .41 | 24.9 | 1.1 | 31.8 | 1,530 | 18.1 | .104 | 38.8 | 25.8 |
Instantaneous loads for selected constituents at site 1018, Rush Creek, Perry County, Ohio.
[ft 3 /s, cubic feet per second; kg/d, kilograms per day; BOLD font indicates samples collected during a synoptic]
| Date | Streamflow (ft 3 /s) | Net alkalinity load (kg/d) | Sulfate load (kg/d) | Aluminum load (kg/d) | Iron load (kg/d) | Manganese load (kg/d) | Metal load (kg/d) |
|---|---|---|---|---|---|---|---|
| 08/05/03 | 4.0 | -2,210 | 10,300 | 130 | 180 | 150 | 460 |
| 09/24/03 | 10 | -1,690 | 18,000 | 200 | 330 | 260 | 790 |
| 10/21/03 | 4.4 | -2,230 | 11,100 | 120 | 250 | 160 | 530 |
| 12/16/03 | 8.2 | -2,830 | 15,000 | 160 | 540 | 220 | 920 |
| 03/10/04 | 9.0 | -4,580 | 22,900 | 270 | 780 | 280 | 1,330 |
| 08/18/04 | 2.4 | -2,270 | 8,980 | 110 | 230 | 150 | 490 |
Water-quality data for site 1018 date back as far as the early 1970s. The average net alkalinity concentration of eight samples collected between 1975 and 1989 indicates historically acidic water (-560 mg/L as CaCO 3 ). The average net alkalinity concentration of six samples collected in 2003 and 2004 was slightly less acidic (-210 mg/L as CaCO 3 ). Average concentrations of aluminum, iron, and manganese were lower in the 2003 and 2004 sampling than in the historical data. Average combined metals loads were 4,150 kg/d in the historical data and 760 kg/d in the 2003 and 2004 sampling.
Multiple factors prohibit the use of statistical analyses of these data to gage improvement of the quality of the water in the last 30 years. These factors include but are not limited to
Therefore, from the 1970s to the present, many more samples would have been necessary to show statistical significance. Collecting more historical data is impossible, but an ongoing effort to collect water-quality data henceforth could help determine whether there is a significant trend (up or down) in the water quality of Rush Creek from the current baseline.
Streamflow characteristics and average net alkalinity and metals loads for site 1018.
[ft 3 /s, cubic feet per second; kg/d, kilograms per day]
| Sampling period | Average streamflow (ft 3 /s) | Streamflow range (ft 3 /s) | Net alkalinity (kg/d as CaCO 3 ) | Aluminum (kg/d) | Iron (kg/d) | Manganese (kg/d) | Total metals (kg/d) |
|---|---|---|---|---|---|---|---|
| 1975–1989 Number of samples | 15.9 4 | 1.0 to 46 8 | -11,200 8 | 600 4 | 2,900 4 | 650 4 | 4,150 4 |
| 2003–04 Number of samples | 6.3 6 | 2.4 to 10 6 | -2,600 6 | 170 6 | 390 6 | 200 6 | 760 6 |
Average concentrations of net alkalinity and metals for site 1018.
[mg/L, milligrams per liter]
| Sampling period | Net alkalinity (mg/L as CaCO 3 ) | Aluminum (mg/L) | Iron (mg/L) | Manganese (mg/L) |
|---|---|---|---|---|
| 1975–1989 Number of samples | -560 8 | 27.0 4 | 126 4 | 30.0 4 |
| 2003–04 Number of samples | -210 6 | 12.0 6 | 26.0 6 | 15.0 6 |
| Name: | Rush Creek 27.8 river miles above mouth at New Lexington—USGS station identification number 394305082130000 |
| Location: | River mile 28.6 |
| USGS Quadrangle: | New Lexington |
| Drainage Area: | 12.2 mi 2 |
No fish were collected, resulting in an IBI score of 12. Macroinvertebrate samples included nine total taxa. The quantitative portion of macroinvertebrate sampling yielded 140 organisms in 9 distinct taxa. The qualitative portion collected with a dipnet showed three distinct taxa. No EPT taxa were collected by either method. The ICI score for this site was 4.
The QHEI for habitat was 51. Sand and silt were the major substrates in the stream channel. Substrate quality was poor because of the amount of silt and degree of embeddedness. The stream bottom was soft to the step. Coal fines were present, as well as litter. Instream cover was sparse other than the remnant clay products from local clay plants. Bank collapsing from scouring was evident, contributing to low stability at this site. The overall channel was characterized by low sinuosity and poor development. A very narrow corridor of less than 15 ft protected the left bank from a trailer park. A moderate riparian corridor of 30–160 ft protected the right bank from urban and industrial land use. Pool/current and riffle/run quality scored 11 out of a possible 12, and riffle/run scored 0 out of 8. Site 1014 failed to meet the LRW-AMD category because neither the IBI nor ICI met the respective aquatic use.
In 2004, the metals load was slightly lower and the net alkalinity load was about the same as that of 2003. The sulfate load was slightly higher in 2004 than in 2003. Iron, manganese, and aluminum concentrations were higher in 2004 than in 2003; streamflow was half and the boron concentration was about the same. For both samples collected at this site, iron, manganese, aluminum, specific conductance, sulfate, alkalinity, and pH exceeded the criteria that suggest AMD impacts (table 4).
Concentration of major ions and field-measured characteristics at site 1014, Rush Creek, Perry County, Ohio.
[ft 3 /s, cubic feet per second; mg/L, milligrams per liter; µS/cm, microsiemens per centimeter; --, not determined]
| Date | Streamflow (ft 3 /s) | pH, field | Specific conductance, field (µS/cm) | Calcium, dissolved (mg/L) | Magnesium, dissolved (mg/L) | Potassium, dissolved (mg/L) | Sodium, dissolved (mg/L) | Acidity, hot peroxide (mg/L as CaCO 3 ) | Alkalinity (mg/L as CaCO 3 ) |
|---|---|---|---|---|---|---|---|---|---|
| 08/05/03 | 5.5 | 2.9 | 1,810 | 122 | 70.1 | 5.22 | 30.5 | 183 | -- |
| 08/18/04 | 2.7 | 2.9 | 2,350 | 177 | 131 | 6.63 | 25.0 | 360 | -- |
| Date | Bromide, dissolved (mg/L) | Chloride, dissolved (mg/L) | Fluoride, dissolved (mg/L) | Silica, dissolved (mg/L as SiO 2 ) | Sulfate, dissolved (mg/L as SO 4 ) | Aluminum, dissolved (mg/L) | Boron, dissolved (mg/L) | Iron, dissolved (mg/L) | Manganese, dissolved (mg/L) |
|---|---|---|---|---|---|---|---|---|---|
| 08/05/03 | 0.22 | 35.7 | 0.7 | 23.4 | 949 | 17.8 | 0.096 | 19.2 | 14.8 |
| 08/18/04 | .26 | 30.1 | 1.2 | 34.8 | 1,360 | 21.9 | .102 | 30.0 | 22.3 |
Instantaneous loads for selected constituents at site 1014, Rush Creek, Perry County, Ohio.
[ft 3 /s, cubic feet per second; kg/d, kilograms per day]
| Date | Streamflow (ft 3 /s) | Net alkalinity load (kg/d) | Sulfate load (kg/d) | Aluminum load (kg/d) | Iron load (kg/d) | Manganese load (kg/d) | Metal load (kg/d) |
|---|---|---|---|---|---|---|---|
| 08/05/03 | 5.5 | -2,460 | 12,800 | 240 | 260 | 200 | 700 |
| 08/18/04 | 2.7 | -2,380 | 8,980 | 150 | 200 | 150 | 500 |
| Name: | Rush Creek 27.3 river miles above mouth at New Lexington—USGS station identification number 394312082132800 |
| Location: | River mile 28.2 |
| USGS Quadrangle: | New Lexington |
| Drainage Area: | 16.8 mi 2 |
No fish were collected, resulting in an IBI score of 12. Previous sampling done by the Ohio EPA in 1982 near site 1015 did not find fish.
The quantitative portion of the macroinvertebrate samples included 103 organisms in 8 distinct taxa. The qualitative portion collected with a dipnet yielded three distinct taxa. No EPT taxa were collected by either method. The ICI score for this site was 10.
The QHEI for habitat was 51. Sand and hardpan were the major substrates in the stream channel. Substrate quality was poor because of the amount of silt and degree of embeddedness. Coal fines were present. Instream cover was sparse to moderate. The channel was characterized low stability, with low to moderate sinuosity and poor development. A lowhead dam is above the study reach.
Orange precipitate coated the depositional areas. A very narrow corridor of less than 15 ft protected the right bank fields leading to the fairground, and a moderate riparian corridor of 30–160 ft protected the left bank from the property adjacent to a church. Bank erosion was moderate to severe. Pool/current quality scored 9 out of a possible 12, and riffle/run scored 1 out of 8. Site 1015 could have partially met the LRW-AMD category on the basis of the ICI score of 10, but the IBI index score of 12 failed to meet the respective aquatic stream use.
In 2004, the metals load was lower than that of 2003. The net alkalinity load was slightly higher than that of 2003, indicating slightly less acidic water. The sulfate load was lower in 2004 than in 2003. Iron, manganese, and aluminum concentrations were slightly higher in 2004 than in 2003, whereas streamflow was about half and boron concentration about the same. For both samples collected at this site, iron, manganese, aluminum, specific conductance, sulfate, alkalinity, and pH exceeded the criteria that suggest AMD impacts (table 4).
Concentration of major ions and field-measured characteristics at site 1015, Rush Creek, Perry County, Ohio.
[ft 3 /s, cubic feet per second; mg/L, milligrams per liter; µS/cm, microsiemens per centimeter; --, not determined]
| Date | Streamflow (ft 3 /s) | pH, field | Specific conductance, field (µS/cm) | Calcium, dissolved (mg/L) | Magnesium, dissolved (mg/L) | Potassium, dissolved (mg/L) | Sodium, dissolved (mg/L) | Acidity, hot peroxide (mg/L as CaCO 3 ) | Alkalinity (mg/L as CaCO 3 ) |
|---|---|---|---|---|---|---|---|---|---|
| 08/05/03 | 7.1 | 3.0 | 1,620 | 108 | 60.6 | 4.80 | 28.9 | 153 | -- |
| 08/17/04 | 3.4 | 2.9 | 2,070 | 157 | 112 | 4.76 | 22.3 | 276 | -- |
| Date | Bromide, dissolved (mg/L) | Chloride, dissolved (mg/L) | Fluoride, dissolved (mg/L) | Silica, dissolved (mg/L as SiO 2 ) | Sulfate, dissolved (mg/L as SO 4 ) | Aluminum, dissolved (mg/L) | Boron, dissolved (mg/L) | Iron, dissolved (mg/L) | Manganese, dissolved (mg/L) |
|---|---|---|---|---|---|---|---|---|---|
| 08/05/03 | 0.16 | 35.3 | 0.6 | 21.3 | 834 | 16.2 | 0.086 | 16.8 | 14.0 |
| 08/17/04 | .17 | 31.7 | 1.1 | 29.6 | 1,080 | 17.5 | .097 | 24.2 | 18.7 |
Instantaneous loads for selected constituents at site 1015, Rush Creek, Perry County, Ohio.
[ft 3 /s, cubic feet per second; kg/d, kilograms per day]
| Date | Streamflow (ft 3 /s) | Net alkalinity load (kg/d) | Sulfate load (kg/d) | Aluminum load (kg/d) | Iron load (kg/d) | Manganese load (kg/d) | Metal load (kg/d) |
|---|---|---|---|---|---|---|---|
| 08/05/03 | 7.1 | -2,660 | 14,500 | 280 | 290 | 240 | 810 |
| 08/17/04 | 3.4 | -2,300 | 8,980 | 150 | 200 | 160 | 510 |
| Name: | Rush Creek 26.2 river miles above mouth near Mainsville—USGS station identification number 394327082143800 |
| Location: | River mile 27.1 |
| USGS Quadrangle: | New Lexington |
| Drainage Area: | 23 mi 2 |
Four green sunfish and eight bluegill sunfish were collected, resulting in an IBI score of 14. The IWB score was 2.4. Previous sampling done by the Ohio EPA in 1982 near site 1026 did not find fish at this site.
Macroinvertebrate samples included 17 total taxa. The quantitative portion yielded 69 organisms in 8 distinct taxa. Qualitative sampling with a dipnet showed 13 distinct taxa, including a coolwater midge, Zavrelimyia sp., and two EPT taxa (caddisflies ). Zavrelimyia sp. is a coolwater taxon. Coolwater taxa are often indicators of ground water entering the stream, but this species alone is not enough to suspect a ground-water source at this location. The ICI score for this site was 2.
The QHEI score for habitat was 45. A score less than 46 is not expected to support a warmwater community (Ohio Environmental Protection Agency, 1997). Sand and silt were the major substrates in the stream channel. Substrate quality was poor because of the amount of silt and degree of embeddedness. Coal fines were scattered about, as well as litter. Instream cover was sparse. Low stability characterized the channel with low to no sinuosity and poor development. Mature trees in the narrow to moderate riparian corridor (30–160 ft) protected both banks, but bank erosion was still severe. The metric for pool/current quality scored 9 out of a possible 12, and riffle/run scored 1 out of 8. Site 1026 failed to meet the LRW-AMD category because the IBI, IWB, and ICI did not meet the respective aquatic uses.
In 2004, the metal load was slightly higher than that of 2003. The net alkalinity load was slightly more acidic than that of 2003. The sulfate load was lower in 2004 than in 2003. Iron, manganese, and aluminum concentrations were higher in 2004 than in 2003, whereas streamflow was about half and boron concentration about the same. During the 2003 synoptic, an anomaly was noted between sites 1015 and 1026. Boron concentration increased (fig. 7), and concentrations at tributary 1027 were not high enough to explain the difference. During the 2004 synoptic, a water-quality sample was collected at the New Lexington wastewater-treatment plant, which discharges to Rush Creek between sites 1015 and 1026. Results indicate that the wastewater-treatment plant, not another abandoned mine treated with FGD by-product, is most likely the source of the boron (fig. 11). The reported boron concentration at the wastewater-treatment plant of 0.249 mg/L is not high enough to be toxic to vegetation. For both samples collected at this site, iron, manganese, aluminum, specific conductance, sulfate, alkalinity, and pH exceeded the criteria that suggest AMD impacts (table 4).
Concentration of major ions and field-measured characteristics at site 1026, Rush Creek, Perry County, Ohio.
[ft 3 /s, cubic feet per second; mg/L, milligrams per liter; µS/cm, microsiemens per centimeter; --, not determined]
| Date | Streamflow (ft 3 /s) | pH, field | Specific conductance, field (µS/cm) | Calcium, dissolved (mg/L) | Magnesium, dissolved (mg/L) | Potassium, dissolved (mg/L) | Sodium, dissolved (mg/L) | Acidity, hot peroxide (mg/L as CaCO 3 ) | Alkalinity (mg/L as CaCO 3 ) |
|---|---|---|---|---|---|---|---|---|---|
| 08/05/03 | 9.1 | 3.5 | 1,230 | 87.3 | 48.0 | 4.82 | 34.9 | 73 | -- |
| 08/17/04 | 4.9 | 3.1 | 1,670 | 127 | 80.2 | 5.77 | 38.9 | 183 | -- |
| Date | Bromide, dissolved (mg/L) | Chloride, dissolved (mg/L) | Fluoride, dissolved (mg/L) | Silica, dissolved (mg/L as SiO 2 ) | Sulfate, dissolved (mg/L as SO 4 ) | Aluminum, dissolved (mg/L) | Boron, dissolved (mg/L) | Iron, dissolved (mg/L) | Manganese, dissolved (mg/L) |
|---|---|---|---|---|---|---|---|---|---|
| 08/05/03 | 0.14 | 42.8 | 0.6 | 18.2 | 584 | 6.80 | 0.112 | 3.94 | 9.41 |
| 08/17/04 | .13 | 43.3 | 1.0 | 24.9 | 837 | 13.5 | .124 | 15.2 | 13.6 |
Instantaneous loads for selected constituents at site 1026, Rush Creek, Perry County, Ohio.
[ft 3 /s, cubic feet per second; kg/d, kilograms per day]
| Date | Streamflow (ft 3 /s) | Net alkalinity load (kg/d) | Sulfate load (kg/d) | Aluminum load (kg/d) | Iron load (kg/d) | Manganese load (kg/d) | Metal load (kg/d) |
|---|---|---|---|---|---|---|---|
| 08/05/03 | 9.1 | -1,630 | 13,000 | 150 | 88 | 210 | 448 |
| 08/17/04 | 4.9 | -2,190 | 10,000 | 160 | 180 | 160 | 500 |
| Name: | 051 Rush Creek (28-4) near Junction City—USGS station identification number 394317082164300 |
| Location: | River mile 25 |
| USGS Quadrangle: | Junction City |
| Drainage Area: | 28 mi 2 |
Three bluegill sunfish and one creek chub were collected, resulting in an IBI score of 12. Creek chubs are highly tolerant of pollution. The IWB score was 1.6.
Macroinvertebrate samples included 14 total taxa. The quantitative portion yielded 42 organisms in 8 distinct taxa, including 2 EPT taxa (mayflies). Qualitative sampling with a dipnet showed 12 distinct taxa, including 4 EPT taxa (2 mayflies and 2 caddisflies). One species of midge, Psilometriocnemus triannulatus , a coolwater species, was collected by qualitative sampling. Coolwater taxa are often indicators of ground water entering the stream, but this species alone is not enough to suspect a ground-water source at this location. The ICI score for this site was 2.
The QHEI score for habitat was 50. Sand and silt were the major substrates in the stream channel. Substrate quality was poor because of the amount of silt and degree of embeddedness. Coal fines were present in the depositional areas. Instream cover was sparse. The channel was characterized by low stability, with low sinuosity and poor development. Mature trees in the narrow to moderate (30–160 ft) riparian corridor protected both banks. Collapsing sections of the banks indicated that erosion was severe. A service road runs a short distance along the left corridor. The pool/current quality metric score was 10 out of a possible 12. The score for the riffle/run was 1 out of a possible 8. Site 1001 failed to meet LRW-AMD category because the IBI, IWB, and ICI did not meet the respective aquatic uses.
During the synoptic studies in 2004, the metals and net alkalinity loads were the same as those of the synoptic study in 2003. The sulfate load was higher in 2004 than in 2003. Iron, manganese, and aluminum concentrations were higher in 2004 than in 2003, whereas streamflow was about half and boron concentration was about the same. Most constituent concentrations were highest during the lowest flows, but the largest loads occurred during spring runoff (March 2004) and December 2003 snowmelt. Except for specific conductance and iron concentration in the sample from September 24, 2003, iron, manganese, aluminum, specific conductance, sulfate, alkalinity, and pH in all six samples collected at this site exceeded the criteria that suggest AMD impacts (table 4).
Concentration of major ions and field-measured characteristics at site 1001, Rush Creek, Perry County, Ohio.
[ft 3 /s, cubic feet per second; mg/L, milligrams per liter; µS/cm, microsiemens per centimeter; --, not determined; BOLD type indicates samples collected during a synoptic]
| Date | Streamflow (ft 3 /s) | pH, field | Specific conductance, field (µS/cm) | Calcium, dissolved (mg/L) | Magnesium, dissolved (mg/L) | Potassium, dissolved (mg/L) | Sodium, dissolved (mg/L) | Acidity, hot peroxide (mg/L as CaCO 3 ) | Alkalinity (mg/L as CaCO 3 ) |
|---|---|---|---|---|---|---|---|---|---|
| 08/06/03 | 8.3 | 3.5 | 1,210 | 97.6 | 54.1 | 5.11 | 33.5 | 81 | -- |
| 09/24/03 | 37 | 5.7 | 639 | 55.0 | 28.6 | 3.44 | 17.5 | 4 | 3 |
| 10/21/03 | 11 | 4.2 | 960 | 81.2 | 48.1 | 4.81 | 23.5 | 55 | -- |
| 12/16/03 | 29 | 5.5 | 630 | 53.2 | 30.2 | 2.63 | 18.1 | 14 | 3 |
| 03/10/04 | 29 | 4.9 | 780 | 59.0 | 37.8 | 2.58 | 16.1 | 52 | -- |
| 08/17/04 | 4.1 | 3.1 | 1,650 | 128 | 78.8 | 5.70 | 35.3 | 167 | -- |
| Date | Bromide, dissolved (mg/L) | Chloride, dissolved (mg/L) | Fluoride, dissolved (mg/L) | Silica, dissolved (mg/L as SiO 2 ) | Sulfate, dissolved (mg/L as SO 4 ) | Aluminum, dissolved (mg/L) | Boron, dissolved (mg/L) | Iron, dissolved (mg/L) | Manganese, dissolved (mg/L) |
|---|---|---|---|---|---|---|---|---|---|
| 08/06/03 | 0.14 | 41.4 | 0.6 | 20.9 | 577 | 8.19 | 0.122 | 1.70 | 8.61 |
| 09/24/03 | .13 | 29.4 | .3 | 14.4 | 268 | .380 | .070 | .466 | 3.70 |
| 10/21/03 | .14 | 37.1 | .5 | 18.0 | 522 | 6.52 | .079 | .957 | 7.63 |
| 12/16/03 | .17 | 31.7 | .3 | 13.9 | 283 | .720 | .047 | 4.35 | 3.79 |
| 03/10/04 | .15 | 27.6 | .4 | 15.3 | 469 | 5.77 | .044 | 5.04 | 5.50 |
| 08/17/04 | .14 | 42.1 | .9 | 24.6 | 821 | 13.1 | .112 | 10.1 | 13.5 |
Instantaneous loads for selected constituents at site 1001, Rush Creek, Perry County, Ohio.
[ft 3 /s, cubic feet per second; kg/d, kilograms per day; BOLD type indicates samples collected during a synoptic]
| Date | Streamflow (ft 3 /s) | Net alkalinity load (kg/d) | Sulfate load (kg/d) | Aluminum load (kg/d) | Iron load (kg/d) | Manganese load (kg/d) | Metal load (kg/d) |
|---|---|---|---|---|---|---|---|
| 08/06/03 | 8.3 | -1,640 | 11,700 | 170 | 35 | 170 | 375 |
| 09/24/03 | 37 | -362 | 24,300 | 34 | 42 | 330 | 406 |
| 10/21/03 | 11 | -1,480 | 14,000 | 180 | 26 | 210 | 416 |
| 12/16/03 | 29 | -993 | 20,100 | 51 | 310 | 270 | 631 |
| 03/10/04 | 29 | -3,690 | 33,300 | 410 | 360 | 390 | 1,160 |
| 08/17/04 | 4.1 | -1,680 | 8,240 | 130 | 100 | 140 | 370 |
Streamflow characteristics and average net alkalinity and metals loads for site 1001.
[ft 3 /s, cubic feet per second; kg/d, kilograms per day]
| Sampling period | Average streamflow (ft 3 /s) | Streamflow range (ft 3 /s) | Net alkalinity (mg/L as CaCO 3 ) | Aluminum (mg/L) | Iron (mg/L) | Manganese (mg/L) |
|---|---|---|---|---|---|---|
| 1975–1989 Number of samples | 34 4 | 8.3 to 94 4 | 10,900 4 | 650 3 | 1,400 3 | 1,020 3 |
| 2003–04 Number of samples | 20 4 | 4.1 to 37 6 | 2,700 6 | 160 6 | 140 6 | 250 6 |
Water-quality data for site 1001 date back as far as the early 1970s. The average net alkalinity concentration of four samples collected between 1975 and 1989 was -260 mg/L as CaCO 3 . The average net alkalinity concentration of six samples collected in 2003 and 2004 was -60 mg/L as CaCO 3 . Average concentrations of aluminum, iron, and manganese were lower in the 2003 and 2004 sampling than in the historical data. Average combined metals loads were 3,070 kg/d in the historical data compared to 550 kg/d in the 2003 and 2004 sampling.
Average concentrations of net alkalinity and metals for site 1001.
[mg/L, milligrams per liter; No., number]
| Sampling period | Net alkalinity (mg/L as CaCO 3 ) | Aluminum (mg/L) | Iron (mg/L) | Manganese (mg/L) |
|---|---|---|---|---|
| 1975–1989 No. of samples | -260 4 | 13 3 | 31 3 | 21 3 |
| 2003–04 No. of samples | -60 6 | 5.0 6 | 3.0 6 | 7.0 6 |
As with site 1018, not enough data are available to allow statistical analyses of these data; therefore, these data are presented as a baseline for future studies.
| Name: | Rush Creek 22.5 river miles above mouth at Junction City—USGS station identification number 394307082175400 |
| Location: | River mile 23.4 |
| USGS Quadrangle: | Junction City |
| Drainage Area: | 35.3 mi 2 |
Two green sunfish, three bluegill sunfish, and two creek chubs were collected. The IBI score was 14 for this site. The IWB score was 2.7. Previous sampling done by the Ohio EPA in 1982 near site 1000 did not produce fish.
Macroinvertebrate samples included 18 total taxa. The quantitative portion yielded 23 organisms in 7 distinct taxa. Qualitative sampling with a dipnet showed 16 distinct taxa, including 3 EPT taxa (1 mayfly and 2 caddisflies). One of the caddisflies, Diplectrona modesta , is a species indicator for cool water. Also important are the collection of midges Zavrelimyia sp. and Parametriocnemus sp. at this site. When Diplectrona modesta is found with two other coolwater taxa, their presence indicates a source of ground water entering the streambed, possibly entering just upstream through a tributary or bank seep. ( Psilometriocnemus triannulatus collected at site 1001 and Zavrelimyia sp. collected at site 1026 are also coolwater taxa, but alone these two are not strong indicators because their temperature tolerance is slightly greater than that of Diplectrona modesta .) The ICI score for this site was 0.
The QHEI score for habitat was 49. Gravel and sand were the major substrates in the stream channel. Substrate quality was poor because of the amount of silt and degree of embeddedness. Coal fines covered the depositional areas. Instream cover was sparse. The channel was characterized by low stability, with no sinuosity and poor development. A narrow riparian corridor of 15–30 ft protected the right bank from urban or industrial land use, and a wide corridor of greater than 160 ft with mature trees protected the left bank. Bank erosion was moderate to severe. The metric for pool/current quality score was 9 out of a possible 12. The metric for riffle/run score was 1 out of a possible of 8. Site 1000 failed to meet LRW-AMD category because the IBI, IWB, and ICI did not meet the respective aquatic uses.
Concentration of major ions and field-measured characteristics at site 1000, Rush Creek, Perry County, Ohio.
[ft 3 /s, cubic feet per second; mg/L, milligrams per liter; µS/cm, microsiemens per centimeter; --, not determined]
| Date | Streamflow (ft 3 /s) | pH, field | Specific conductance, field (µS/cm) | Calcium, dissolved (mg/L) | Magnesium, dissolved (mg/L) | Potassium, dissolved (mg/L) | Sodium, dissolved (mg/L) | Acidity, hot peroxide (mg/L as CaCO 3 ) | Alkalinity (mg/L as CaCO 3 ) |
|---|---|---|---|---|---|---|---|---|---|
| 08/06/03 | 10 | 3.8 | 1,080 | 88.5 | 52.5 | 4.69 | 32.1 | 52 | -- |
| 08/17/04 | 5.5 | 3.2 | 1,490 | 120 | 73.3 | 6.01 | 36.2 | 123 | -- |
| Date | Bromide, dissolved (mg/L) | Chloride, dissolved (mg/L) | Fluoride, dissolved (mg/L) | Silica, dissolved (mg/L as SiO 2 ) | Sulfate, dissolved (mg/L as SO 4 ) | Aluminum, dissolved (mg/L) | Boron, dissolved (mg/L) | Iron, dissolved (mg/L) | Manganese, dissolved (mg/L) |
|---|---|---|---|---|---|---|---|---|---|
| 08/06/03 | 0.18 | 43.5 | 0.6 | 18.4 | 526 | 5.80 | 0.101 | 0.974 | 8.80 |
| 08/17/04 | .17 | 44.7 | .9 | 23.1 | 725 | 11.0 | .147 | 5.16 | 11.8 |
Instantaneous loads for selected constituents at site 1000, Rush Creek, Perry County, Ohio.
[ft 3 /s, cubic feet per second; kg/d, kilograms per day]
| Date | Streamflow (ft 3 /s) | Net alkalinity load (kg/d) | Sulfate load (kg/d) | Aluminum load (kg/d) | Iron load (kg/d) | Manganese load (kg/d) | Metal load (kg/d) |
|---|---|---|---|---|---|---|---|
| 08/06/03 | 10 | -1,270 | 12,900 | 140 | 24 | 220 | 384 |
| 08/17/04 | 5.5 | -1,660 | 9,760 | 150 | 69 | 160 | 379 |
During the synoptic studies in 2004, the metals load was unchanged and net alkalinity load was slightly more acidic than that of the synoptic study in 2003. The sulfate load was lower in 2004 than in 2003. Iron, manganese, and aluminum concentrations were higher in 2004 than in 2003, whereas streamflow was about half and boron concentration slightly higher. For both samples collected at this site, iron, manganese, aluminum, specific conductance, sulfate, alkalinity, and pH exceeded the criteria that suggest AMD impacts (table 4).
| Name: | Rush Creek 20.5 river miles above mouth near Junction City—USGS station identification number 394323082200000 |
| Location: | River mile 21.4 |
| USGS Quadrangle: | Junction City |
| Drainage Area: | 39.5 mi 2 |
Three green sunfish, 23 bluegill sunfish, 10 creek chub, 1 sand shiner, 2 yellow bullhead, and 1 largemouth bass were collected. The IBI score was 30. Yellow bullheads are highly tolerant of pollution, and sand shiners are moderately intolerant. The largemouth bass is rated moderate in pollution tolerance (Barbour and others, 1999). The IWB score for this site was 4.2.
Macroinvertebrate samples included 35 total taxa. The quantitative portion yielded 111 organisms in 23 distinct taxa, including 2 EPT taxa (caddisflies). Qualitative sampling with a dipnet showed 17 distinct taxa, including 3 EPT taxa (1 mayfly and 2 caddisflies). Diplectrona modesta , Zavrelimyia sp., and Parametriocnemus sp. were collected at site 1007. These coolwater species continue to suggest a source of ground water entering Rush Creek at or above site 1000 (river mile 23.4). The ICI score for this site was 16.
The QHEI score for habitat was 43. QHEI scores for habitat were lower at the downstream sites of the study area, possibly from the cumulative effects of nonpoint-source runoff. Sand and silt were the major substrates in the stream channel. Substrate quality was poor because of the amount of silt and degree of embeddedness. Coal fines settled in the depositional areas. A drain pipe installed on the left bank just above the bridge created a one-side channel modification. Instream cover was sparse. The channel was characterized by low stability, with no sinuosity and poor development. A narrow riparian corridor (<15 ft) protected the right bank from State Route 37, and a moderate corridor (30–160 ft) of mature trees protected the left bank from row crops at the upper end of the study reach. The lower end of the reach was bordered by mature trees in a forest setting. Bank erosion was moderate. The metric for pool/current quality score was 10 out of a possible 12. The metric for riffle/run score was 1 out of a possible of 8. Site 1007 met the LRW-AMD criteria because the IBI, IWB, and ICI met the respective aquatic uses. If ground water is entering the stream above this site, the source of freshwater may explain the sudden increase in the fish and macroinvertebrate communities.
During the synoptic studies in 2004, the metals load was about the same, and the net alkalinity load was slightly more acidic than that of the synoptic study in 2003. The sulfate load was lower in 2004 than in 2003. Iron, manganese, and aluminum concentrations were higher in 2004 than in 2003, whereas streamflow was about half and boron concentration slightly higher. Similar to site 1001, most constituent concentrations were highest during the lowest flows, but the largest loads occurred during spring runoff (March 2004). For all five samples collected at this site, manganese, sulfate and alkalinity exceeded the criteria that suggest AMD impacts (table 4). For five of the six samples, aluminum and pH exceeded the criteria. For three of the five samples, specific conductance exceeded the criteria. For two of the five samples, iron exceeded the criteria.
Concentration of major ions and field-measured characteristics at site 1007, Rush Creek, Perry County, Ohio.
[ft 3 /s, cubic feet per second; mg/L, milligrams per liter; µS/cm, microsiemens per centimeter; --, not determined; BOLD type indicates samples collected during a synoptic; E, estimated]
| Date | Streamflow (ft 3 /s) | pH, field | Specific conductance, field (µS/cm) | Calcium, dissolved (mg/L) | Magnesium, dissolved (mg/L) | Potassium, dissolved (mg/L) | Sodium, dissolved (mg/L) | Acidity, hot peroxide (mg/L as CaCO 3 ) | Alkalinity (mg/L as CaCO 3 ) |
|---|---|---|---|---|---|---|---|---|---|
| 08/06/03 | 10 | 4.5 | 1,030 | 95.8 | 51.1 | 5.12 | 33.9 | 38 | -- |
| 09/24/03 | 52 | 6.2 | 565 | 52.2 | 25.6 | 3.91 | 16.6 | -- | E8 |
| 10/21/03 | 16 | 5.0 | 820 | 71.9 | 41.0 | 4.67 | 23.8 | 14 | 3 |
| 03/10/04 | 40 | 5.4 | 660 | 53.3 | 32.3 | 2.48 | 15.2 | 31 | 2 |
| 08/17/04 | 6.0 | 3.4 | 1,410 | 118 | 69.2 | 6.23 | 34.2 | 104 | -- |
| Date | Bromide, dissolved (mg/L) | Chloride, dissolved (mg/L) | Fluoride, dissolved (mg/L) | Silica, dissolved (mg/L as SiO 2 ) | Sulfate, dissolved (mg/L as SO 4 ) | Aluminum, dissolved (mg/L) | Boron, dissolved (mg/L) | Iron, dissolved (mg/L) | Manganese, dissolved (mg/L) |
|---|---|---|---|---|---|---|---|---|---|
| 08/06/03 | 0.16 | 43.8 | 0.6 | 20.6 | 494 | 3.09 | 0.115 | 0.240 | 6.78 |
| 09/24/03 | .11 | 30.3 | 0.2 | 13.9 | 215 | .060 | .067 | .300 | 2.87 |
| 10/21/03 | .17 | 38.8 | 0.5 | 16.1 | 367 | 2.13 | .075 | .421 | 5.51 |
| 03/10/04 | .14 | 26.5 | 0.4 | 14.3 | 409 | 3.14 | .042 | 3.11 | 4.35 |
| 08/17/04 | .17 | 46.8 | 0.9 | 22.2 | 686 | 10.7 | .104 | 2.79 | 11.3 |
Instantaneous loads for selected constituents at site 1007, Rush Creek, Perry County, Ohio.
[ft 3 /s, cubic feet per second; kg/d, kilograms per day; BOLD type indicates samples collected during a synoptic]
| Date | Streamflow (ft 3 /s) | Net alkalinity load (kg/d) | Sulfate load (kg/d) | Aluminum load (kg/d) | Iron load (kg/d) | Manganese load (kg/d) | Metal load (kg/d) |
|---|---|---|---|---|---|---|---|
| 08/06/03 | 10 | -930 | 12,100 | 150 | 6.2 | 170 | 326 |
| 09/24/03 | 52 | 1,020 | 27,400 | 7.6 | 38 | 370 | 416 |
| 10/21/03 | 16 | -550 | 14,400 | 83 | 16 | 220 | 319 |
| 03/10/04 | 40 | -3,030 | 40,000 | 310 | 300 | 430 | 1,040 |
| 08/17/04 | 6.0 | -1,530 | 10,100 | 160 | 41 | 170 | 371 |
| Name: | Rush Creek 20.2 river miles above mouth near Junction City—USGS station identification number 394324082202400 |
| Location: | River mile 21.1 |
| USGS Quadrangle: | Junction City |
| Drainage Area: | 45.6 mi 2 |
One johnny darter, 3 green sunfish, 5 bluegill sunfish, 10 creek chub, 3 sand shiner, and 4 spotfin shiner were collected. The IBI score was 14. Johnny darter and spotfin shiner are moderately pollution tolerant (Barbour and others, 1999). The IWB score was 3.5. Fish samples collected at the last two main-stem sites were similar in quantity and species diversity. Two species at site 1024 differed from those collected at site 1007, but the IBI does not discriminate well when sample sets are small. The index adjusts the scores of samples containing less than 200 fish and adjusts again for those samples containing less than 50 fish. A culvert below site 1007 drains surface-water runoff from State Route 37 into Rush Creek; its presence above site 1024 may explain the IBI and IWB scores at site 1024 being lower than the scores at site 1007, located upstream.
Macroinvertebrate samples included 39 total taxa. The quantitative portion yielded 124 organisms in 3 distinct taxa, including 5 EPT taxa (3 mayflies and 2 caddisflies). Qualitative sampling with a dipnet showed 14 distinct taxa, including 1 EPT taxon (caddisfly). Diplectrona modesta , Zavrelimyia sp., and Parametriocnemus sp., the same coolwater taxa collected at sites 1000 and 1007, were also collected at site 1024. The ICI score was 30.
The QHEI score for habitat was 44. Sand and silt were the major substrates in the stream channel. Substrate quality was poor because of the amount of silt and degree of embeddedness. Coal fines settled in the depositional areas. Instream cover was sparse. The channel was characterized by low stability, with low to no sinuosity and poor development. A narrow to moderate riparian corridor (15–160 ft) protected the right bank from State Route 37, and a wide corridor (>160 ft) of mature trees protected the left bank. Bank erosion was moderate. The metric for pool/current quality score was 9 out of a possible 12. The metric for riffle/run score was 1 out of possible 8. Site 1024 did not meet the LRW-AMD criteria because the IBI, IWB, and ICI did not meet the respective aquatic uses.
Concentration of major ions and field-measured characteristics at site 1024, Rush Creek, Perry County, Ohio.
[ft 3 /s, cubic feet per second; mg/L, milligrams per liter; µS/cm, microsiemens per centimeter; --, not determined]
| Date | Streamflow (ft 3 /s) | pH, field | Specific conductance, field (µs/cm) | Calcium, dissolved (mg/L) | Magnesium, dissolved (mg/L) | Potassium, dissolved (mg/L) | Sodium, dissolved (mg/L) | Acidity, hot peroxide (mg/L as CaCO 3 ) | Alkalinity (mg/L as CaCO 3 ) |
|---|---|---|---|---|---|---|---|---|---|
| 08/06/03 | 12 | 4.7 | 963 | 79.2 | 46.0 | 4.49 | 30.0 | 23 | -- |
| 08/17/04 | 6.5 | 3.5 | 1,360 | 114 | 67.0 | 5.15 | 33.2 | 111 | -- |
| Date | Bromide, dissolved (mg/L) | Chloride, dissolved (mg/L) | Fluoride, dissolved (mg/L) | Silica, dissolved (mg/L as SiO 2 ) | Sulfate, dissolved (mg/L as SO 4 ) | Aluminum, dissolved (mg/L) | Boron, dissolved (mg/L) | Iron, dissolved (mg/L) | Manganese, dissolved (mg/L) |
|---|---|---|---|---|---|---|---|---|---|
| 08/06/03 | 0.16 | 43.1 | 0.6 | 16.1 | 437 | 3.26 | 0.090 | 0.196 | 8.00 |
| 08/17/04 | .20 | 45.6 | .8 | 21.4 | 671 | 10.2 | .101 | 2.31 | 11.0 |
Instantaneous loads for selected constituents at site 1024, Rush Creek, Perry County, Ohio.
[ft 3 /s, cubic feet per second; kg/d, kilograms per day]
| Date | Streamflow (ft 3 /s) | Net alkalinity load (kg/d) | Sulfate load (kg/d) | Aluminum load (kg/d) | Iron load (kg/d) | Manganese load (kg/d) | Metal load (kg/d) |
|---|---|---|---|---|---|---|---|
| 08/06/03 | 12 | -675 | 12,800 | 96 | 5.8 | 230 | 332 |
| 08/17/04 | 6.5 | -1,770 | 10,700 | 160 | 37 | 180 | 377 |
Four indicator taxa in a stream generally indicate coolwater habitat, but in this case the taxa indicate a source of ground water rather than coolwater habitat as defined by the Ohio EPA. Ground water entering the stream above this site may explain why fish were largely absent in the main stem until site 1026. Because the reach upstream from site 1026 was not receiving ground water (or was receiving it at a reduced rate), the AMD was not diluted by the ground water to a point that allowed for a fish population to exist. Ground water entering the stream may also explain the increase in diversity of the macroinvertebrate community in the same area.
During the synoptic studies in 2004, the metal load was higher than that of the synoptic study in 2003. The net alkalinity load was more acidic than that of the synoptic study in 2003. The sulfate load was lower in 2004 than in 2003. Iron, manganese, and aluminum concentrations were higher in 2004 than in 2003, whereas streamflow was about half and boron concentration about the same. For both samples collected at this site, manganese, aluminum, specific conductance, sulfate, alkalinity and pH exceeded the water-quality standards that suggest AMD impacts (table 4). For one of the two samples, iron exceeded the criterion table 4.
| Name: | Unnamed tributary 0.25 river mile above mouth near Rehoboth—USGS station identification number 394339082111500 |
| Location: | River mile 0.30 |
| USGS Quadrangle: | New Lexington |
| Drainage Area: | 3.9 mi 2 |
In 1997, the Ohio Department of Natural Resources (ODNR) began a three-phase reclamation project of approximately 450 acres of abandoned mine land in this subwatershed. Work on the site included regrading and capping of the refuse with flue-gas desulfurization (FGD) by-product and installation of ponds through the creation of a series of low-head dams (Bennett & Williams Environmental Consultants Inc, 1995). The reclamation created five ponds, four inline with the creek and one in the northwest quadrant of the reclamation between the gob pile capped with FGD and the stream (fig. 2). Site 1003 is between the bottom of the reclaimed area and the confluence with Rush Creek. An additional 13 water-quality samples were collected to identify potential AMD sources within the reclaimed area.
No fish were collected. The IBI score was 12, the lowest possible score. This site includes the riprap in the outfall below the retention pond. An IWB score is not valid because the drainage area is less than the 20-mi 2 minimum.
Macroinvertebrate samples included six total taxa. The quantitative portion yielded 2,543 organisms in 4 distinct taxa. Qualitative sampling with a dipnet showed two distinct taxa plus four of the taxa found in the quantitative sample. No EPT taxa were collected by either the quantitative or qualitative sampling methods. Tanytarsus sp. dominated the quantitative sample with 1,756 individuals collected. Many species in the Tanytarsini tribe are sensitive to pollution, which is why the ICI score site 1003 was 10; but, Tanytarsus sp. is not identified to the species level. The undetermined species collected at site 1003 must have been facultative, able to thrive in acid mine drainage with pH <3.
The QHEI score for habitat was 49. A QHEI score is not included when determining the aquatic-use status of a river or stream designated LRW-AMD. No QHEI score is established for LRW-AMD sites because this designation applies to waters receiving severe acid mine drainage from abandoned mine lands. The Ohio EPA considers habitat in waters designated LRW-AMD to be poor in quality.
Sand and silt were the major substrates in the stream channel. Substrate quality below the retention-dam riprap was poor. Instream cover was sparse; the channel had low to moderate sinuosity, poor development, and low stability. A wide riparian corridor (>160 ft) of mature trees protected both banks below the area cleared for dam construction. Bank erosion was moderate to severe and may be remnant of the pre-construction period. The metric score for pool/current quality was 11 out of a possible 12. The metric score for riffle/run was 0 out of a possible 8. Site 1003 did not meet the LRW-AMD category because the IBI and ICI did not meet the respective aquatic-use criteria. The ICI score of 10 met the LRW-AMD criteria, but the IBI score of 12 did not. Both scores must meet or exceed the respective aquatic use.
Concentration of major ions and field-measured characteristics at site 1003, Rush Creek, Perry County, Ohio.
[ft 3 /s, cubic feet per second; mg/L, milligrams per liter; µS/cm, microsiemens per centimeter; - -, not determined; BOLD type indicates samples collected during a synoptic]
| Date | Streamflow (ft 3 /s) | pH, field | Specific conductance, field (µS/cm) | Calcium, dissolved (mg/L) | Magnesium, dissolved (mg/L) | Potassium, dissolved (mg/L) | Sodium, dissolved (mg/L) | Acidity, hot peroxide (mg/L as CaCO 3 ) | Alkalinity (mg/L as CaCO 3 ) |
|---|---|---|---|---|---|---|---|---|---|
| 07/15/03 | 2.0 | 3.1 | 2,100 | 127 | 79.8 | 1.72 | 12.6 | 276 | -- |
| 08/05/03 | 2.2 | 2.5 | 2,270 | 137 | 85.7 | 5.88 | 14.2 | 311 | -- |
| 09/10/03 | 2.2 | 3.0 | 1,950 | 124 | 73.6 | 5.68 | 12.0 | 272 | -- |
| 08/18/04 | 1.2 | 2.7 | 2,760 | 182 | 127 | 7.27 | 14.9 | 504 | -- |
| Date | Bromide, dissolved (mg/L) | Chloride, dissolved (mg/L) | Fluoride, dissolved (mg/L) | Silica, dissolved (mg/L as SiO 2 ) | Sulfate, dissolved (mg/L as SO 4 ) | Aluminum, dissolved (mg/L) | Boron, dissolved (mg/L) | Iron, dissolved (mg/L) | Manganese, dissolved (mg/L) |
|---|---|---|---|---|---|---|---|---|---|
| 07/15/03 | 0.27 | 26.9 | 0.8 | 21.2 | 1,060 | 13.2 | 0.088 | 20.7 | 13.9 |
| 08/05/03 | .40 | 28.8 | .8 | 24.2 | 1,190 | 15.6 | .103 | 31.7 | 14.4 |
| 09/10/03 | .30 | 22.8 | .9 | 21.5 | 1,340 | 14.4 | .094 | 27.1 | 13.8 |
| 08/18/04 | .46 | 22.8 | 1.3 | 32.1 | 1,490 | 24.8 | .135 | 47.3 | 18.8 |
Instantaneous loads for selected constituents at site 1003, Rush Creek, Perry County, Ohio.
[ft 3 /s, cubic feet per second; kg/d, kilograms per day; BOLD type indicates samples collected during a synoptic]
| Date | Streamflow (ft 3 /s) | Net alkalinity load (kg/d) | Sulfate load (kg/d) | Aluminum load (kg/d) | Iron load (kg/d) | Manganese load (kg/d) | Metal load (kg/d) |
|---|---|---|---|---|---|---|---|
| 07/15/03 | 2.0 | -1,350 | 5,190 | 65 | 100 | 68 | 233 |
| 08/05/03 | 2.2 | -1,670 | 6,410 | 84 | 170 | 78 | 332 |
| 09/10/03 | 2.2 | -1,460 | 7,210 | 78 | 150 | 74 | 302 |
| 08/18/04 | 1.2 | -1,480 | 4,374 | 73 | 140 | 55 | 268 |
This site is the largest contributor of AMD to the Rush Creek watershed and affects the water quality of Rush Creek for miles downstream. The highest metal and most acidic loads that feed into Rush Creek are from site 1003 (figs. 5 and 9). The metals load (265 kg/d) was 3 times that of the next highest tributary. The net alkalinity load (-1,670 kg/d) was 5 times that of the next highest tributary. After the addition of water from site 1003 and site 1050, the metals load in the main stem increases and remains elevated to the next downstream site. For all four samples collected at this site, iron, manganese, aluminum, specific conductance, sulfate, alkalinity and pH exceeded the criteria that suggest AMD impacts (table 4).
An additional 13 samples were collected in the Rehoboth reclamation area, including tributaries and seeps that drain into the main tributary to Rush Creek.
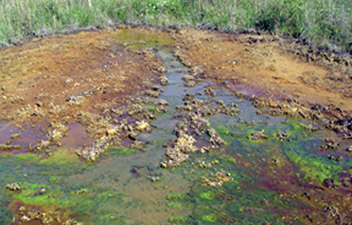
Photo 1. Seep at the Rehoboth reclamation site.
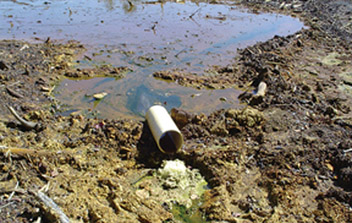
Photo 2. Seep at the Rehoboth reclamation site.

Photo 3. Tile drain at site 3004.
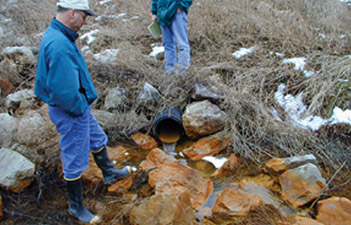
Photo 4. Outfall from pond 5 at site 3005.
Concentration of major ions and field-measured water-quality characteristics in the Rehoboth reclamation area subwatershed, Rush Creek, Perry County, Ohio.
[ft 3 /s, cubic feet per second; mg/L, milligrams per liter; µS/cm, microsiemens per centimeter; <, less than; --, not determined]
| Site | Date | Site type | Flow (ft 3 /s) | pH, field | Specific conductance, field (µS/cm) | Calcium, dissolved (mg/L) | Magnesium, dissolved (mg/L) |
|---|---|---|---|---|---|---|---|
| 3000 | 08/26/03 | Seep | 0.04 | 2.7 | 4,420 | 473 | 235 |
| 3001 | 08/26/03 | Seep | .02 | 3.0 | 2,970 | 329 | 180 |
| 3002 | 08/27/03 | Seep | .004 | 3.0 | 9,490 | 472 | 228 |
| 3003 | 08/27/03 | Seep | .002 | 2.9 | 10,500 | 443 | 235 |
| 3004 | 08/27/03 | Tile | .07 | 3.2 | 6,360 | 443 | 167 |
| 3005 | 08/27/03 | Tile | .004 | 2.3 | 3,900 | 414 | 49.3 |
| 3006 | 08/27/03 | Upgradient | .07 | 2.5 | 2,090 | 132 | 82.0 |
| 3007 | 08/29/03 | Seep | .003 | 3.2 | 3,360 | 493 | 239 |
| 3008 | 08/29/03 | Seep | .04 | 2.7 | 2,460 | 160 | 97.0 |
| 3009 | 09/09/03 | Upgradient | .61 | 3.6 | 1,130 | 103 | 61.9 |
| 3010 | 09/09/03 | Upgradient | 1.1 | 3.2 | 1,500 | 105 | 75.3 |
| 3011 | 09/09/03 | Stream | .72 | 2.8 | 2,150 | 141 | 65.5 |
| 3012 | 09/10/03 | Stream | 1.5 | 3.0 | 1,890 | 128 | 75.4 |
| Site | Potassium, dissolved (mg/L) | Sodium, dissolved (mg/L) | Acidity, hot peroxide (mg/L as CaCO 3 ) | Alkalinity (mg/L as CaCO 3 ) | Bromide, dissolved (mg/L) | Chloride, dissolved (mg/L) | Fluoride, dissolved (mg/L) |
|---|---|---|---|---|---|---|---|
| 3000 | 14.1 | 21.1 | 1,850 | -- | 10.7 | 27.9 | 1.9 |
| 3001 | 10.0 | 21.8 | 610 | -- | 3.02 | 31.8 | .8 |
| 3002 | 34.0 | 17.5 | 6,910 | -- | 35.6 | 24.1 | 1.4 |
| 3003 | 62.2 | 20.5 | 9,830 | -- | 110 | 34.8 | 2.9 |
| 3004 | 66.5 | 37.8 | 4,560 | -- | 11.4 | 71.9 | <.8 |
| 3005 | 3.35 | 2.75 | 1,070 | -- | 1.05 | 12.8 | 1.2 |
| 3006 | 5.72 | 7.60 | 282 | -- | .31 | 9.40 | .9 |
| 3007 | 11.7 | 25.9 | 490 | -- | 3.14 | 21.9 | .4 |
| 3008 | 10.2 | 9.69 | 246 | -- | .38 | 13.9 | .6 |
| 3009 | 4.50 | 13.1 | 46 | -- | .07 | 21.0 | .6 |
| 3010 | 3.98 | 10.2 | 146 | -- | .13 | 16.7 | 1.2 |
| 3011 | 6.88 | 12.4 | 449 | -- | .57 | 23.6 | .6 |
| 3012 | 5.51 | 12.6 | 298 | -- | .26 | 22.9 | .9 |
| Site | Silica, dissolved (mg/L as SiO 2 ) | Sulfate, dissolved (mg/L as SO 4 ) | Aluminum, dissolved (mg/L) | Boron, dissolved (mg/L) | Iron, dissolved (mg/L) | Manganese, dissolved (mg/L) | |
|---|---|---|---|---|---|---|---|
| 3000 | 45.6 | 4,660 | 33.9 | 0.153 | 887 | 37.7 | |
| 3001 | 31.0 | 2,380 | 5.76 | .130 | 271 | 33.3 | |
| 3002 | 57.7 | 10,100 | 394 | .178 | 2,650 | 51.6 | |
| 3003 | 43.8 | 13,200 | 520 | <2.80 | 3,970 | 51.3 | |
| 3004 | 84.1 | 6,780 | 299 | .844 | 1,810 | 22.5 | |
| 3005 | 28.0 | 2,710 | 72.5 | 1.160 | 96.0 | 3.63 | |
| 3006 | 38.8 | 1,150 | 10.5 | .200 | 29.7 | 12.6 | |
| 3007 | 39.1 | 2,840 | 11.1 | .215 | 168 | 29.9 | |
| 3008 | 24.8 | 1,170 | 2.31 | .130 | 26.7 | 17.8 | |
| 3009 | 19.5 | 636 | 7.58 | .086 | 7.68 | 5.52 | |
| 3010 | 23.4 | 902 | 27.5 | .046 | 6.41 | 16.6 | |
| 3011 | 21.8 | 1,230 | 23.3 | .218 | 88.7 | 7.46 | |
| 3012 | 23.1 | 1,100 | 16.8 | .123 | 45.7 | 13.7 |
Sites 3000–3003 and 3007, 3008 are all seeps at the toe of slopes on the reclamation site (photos 1 and 2). Most are fed from water percolating through the cap and spoil, hitting hardpan and then moving horizontally until the water reaches the surface at the toe of a graded slope. Samples from sites 3002 and 3003 had the highest dissolved metals and lowest net alkalinities measured during this study and are most likely fed by water moving through the gob pile capped with FGD to the east. Water-level measurements in a piezometer installed in pond 2 show that the head in ground water is 0.25 ft higher than that of the pond (unpublished data on file at the Columbus, Ohio, USGS office), indicating that the creek and the four ponds along creek are being fed by ground water.
Site 3004 (photo 3) is the outfall for a tile drain that is installed under pond 5 (fig. 2) that holds runoff from the gob pile capped with FGD. Site 3005 (photo 4) is the outfall of the surface water overflow from the pond. Water-level measurements in a piezometer installed in pond 1 indicate a difference of 0.5 ft between ground water and the surface of the pond (unpublished data on file at the Columbus, Ohio, USGS office). More study would be needed for confirmation, but the two piezometers and multiple seeps indicate that ground water is most likely flowing into the surface water along the creek.
The surface-water quality entering the Rehoboth reclamation area from the west, including Lake Essington, was sampled at site 3010 (fig. 2). Sites 3006 and 3009 were sampled to determine the surface-water quality entering the reclamation area from the north. The combined streamflow from the upgradient sites was 1.8 ft 3 /s; 2.2 ft 3 /s was flowing offsite (site 1003 on 9/10/03). The combined metal load produced by the three upgradient sites was 176 kg/d compared to 298 kg/d flowing offsite. The net alkalinity load from upgradient sites was -510 kg/d, and -1,460 kg/d was moving offsite. With an increase in 0.4 ft 3 /s, the metals load increased by 122 kg/d (69 percent) and net alkalinity load became more acidic by -950 kg/d (186 percent).
The median iron, manganese, and aluminum concentrations for all 13 samples collected during the detailed study are 96.0, 17.8, and 23.3 mg/L, respectively. The maximum pH measured was 3.6, and the minimum pH measured was 2.3. The median net alkalinity was -490 mg/L as CaCO 3 , and the most acidic net alkalinity was -9,832 mg/L as CaCO 3 . The seeps had some of the highest concentrations of dissolved metals, but the flows were so low that the loads are much less than in the main stem of the creek.
Ground water that does not enter the tile-drain system at site 3004 moves downgradient to the four constructed ponds. The seep emanating from the base of the gob pile derives its water from ground water and has an iron concentration of 887 mg/L (site 3000). This gob pile accepts only a limited amount of recharge because it was covered with FGD material, but it will likely keep on producing AMD at this rate as long as (1) some recharge is going through the gob pile (or bypasses the drain), (2) it keeps getting oxygen from the atmosphere, or (3) until all the pyrite in the pile is oxidized.
Concentration of major ions and field-measured characteristics at site 1050, Rush Creek, Perry County, Ohio.
[ft 3 /s, cubic feet per second; mg/L, milligrams per liter; µS/cm, microsiemens per centimeter; E, estimated; --, not determined]
| Date | Streamflow (ft 3 /s) | pH, field | Specific conductance, field (µS/cm) | Calcium, dissolved (mg/L) | Magnesium, dissolved (mg/L) | Potassium, dissolved (mg/L) | Sodium, dissolved (mg/L) | Acidity, hot peroxide (mg/L as CaCO 3 ) | Alkalinity (mg/L as CaCO 3 ) |
|---|---|---|---|---|---|---|---|---|---|
| 03/10/04 | 0.43 | 3.5 | 1,640 | 107 | 80.6 | 3.08 | 15.8 | 234 | -- |
| 08/18/04 | .22 | 2.5 | 3,050 | 203 | 155 | 5.30 | 17.8 | 528 | -- |
| Date | Bromide, dissolved (mg/L) | Chloride, dissolved (mg/L) | Fluoride, dissolved (mg/L) | Silica, dissolved (mg/L as SiO 2 ) | Sulfate, dissolved (mg/L as SO 4 ) | Aluminum, dissolved (mg/L) | Boron, dissolved (mg/L) | Iron, dissolved (mg/L) | Manganese, dissolved (mg/L) |
|---|---|---|---|---|---|---|---|---|---|
| 03/10/04 | 0.23 | 27.5 | 0.8 | 25.4 | 1,070 | 14.9 | 0.028 | 37.0 | 21.5 |
| 08/18/04 | 2.68 | 30.8 | 1.4 | 42.7 | 2,000 | 24.1 | E.037 | 56.2 | 41.0 |
Instantaneous loads for selected constituents at site 1050, Rush Creek, Perry County, Ohio.
[ft 3 /s, cubic feet per second; kg/d, kilograms per day]
| Date | Streamflow (ft 3 /s) | Net alkalinity load (kg/d) | Sulfate load (kg/d) | Aluminum load (kg/d) | Iron load (kg/d) | Manganese load (kg/d) | Metal load (kg/d) |
|---|---|---|---|---|---|---|---|
| 03/10/04 | 0.43 | -246 | 1,130 | 16 | 39 | 23 | 78 |
| 08/18/04 | .22 | -284 | 1,080 | 13 | 30 | 22 | 65 |
| Name: | Unnamed tributary to Rush Creek near New Lexington—USGS station identification number 394304082114600 |
| Location: | River mile 0.10 |
| USGS Quadrangle: | New Lexington |
| Drainage Area: | 0.50 mi 2 |
No biological data were collected at this site.
During the synoptic study in 2004, the metal load and the net alkalinity load were similar to the loads of the synoptic study in 2003. The sulfate load was also very similar in 2004 to that in 2003. Iron, manganese, and aluminum concentrations were higher in 2004 than in 2003, whereas streamflow was about half. For both samples collected at this site, iron, manganese, aluminum, specific conductance, sulfate, alkalinity, and pH exceeded the criteria that suggest AMD impacts (table 4).
| Name: | Unnamed tributary to Rush Creek at New Lexington—USGS station identification number 394302082125500 |
| Location: | River mile 0.10 |
| USGS Quadrangle: | New Lexington |
| Drainage Area: | 2.4 mi 2 |
No fish were collected. The IBI score was 12. Macroinvertebrate samples included 13 total taxa. The quantitative portion yielded 40 organisms in 10 distinct taxa. Qualitative sampling with a dipnet showed 10 distinct taxa. No EPT taxa were collected by either the quantitative or qualitative sampling methods. Zavrelimyia sp., a coolwater species whose presence often indicates a source of ground water, was collected by qualitative sampling. The ICI score for this site was 2.
Concentration of major ions and field-measured characteristics at site 1012, Rush Creek, Perry County, Ohio.
[ft 3 /s, cubic feet per second; mg/L, milligrams per liter; µS/cm, microsiemens per centimeter; --, not determined]
| Date | Streamflow (ft 3 /s) | pH, field | Specific conductance, field (µS/cm) | Calcium, dissolved (mg/L) | Magnesium, dissolved (mg/L) | Potassium, dissolved (mg/L) | Sodium, dissolved (mg/L) | Acidity, hot peroxide (mg/L as CaCO 3 ) | Alkalinity (mg/L as CaCO 3 ) |
|---|---|---|---|---|---|---|---|---|---|
| 08/05/03 | 1.2 | 3.8 | 1,030 | 64.5 | 38.7 | 3.25 | 22.4 | 114 | -- |
| 08/18/04 | .77 | 3.5 | 1,410 | 91.5 | 67.4 | 4.33 | 20.3 | 250 | -- |
| Date | Bromide, dissolved (mg/L) | Chloride, dissolved (mg/L) | Fluoride, dissolved (mg/L) | Silica, dissolved (mg/L as SiO 2 ) | Sulfate, dissolved (mg/L as SO 4 ) | Aluminum, dissolved (mg/L) | Boron, dissolved (mg/L) | Iron load (mg/L) | Manganese, dissolved (mg/L) |
|---|---|---|---|---|---|---|---|---|---|
| 08/05/03 | 0.21 | 49.6 | 0.8 | 26.4 | 492 | 23.6 | 0.074 | 1.92 | 9.05 |
| 08/18/04 | .19 | 37.2 | 1.4 | 38.7 | 765 | 30.5 | .075 | 2.83 | 11.0 |
Instantaneous loads for selected constituents at site 1012, Rush Creek, Perry County, Ohio.
[ft 3 /s, cubic feet per second; kg/d, kilograms per day]
| Date | Streamflow (ft 3 /s) | Net alkalinity load (kg/d) | Sulfate load (kg/d) | Aluminum load (kg/d) | Iron load (kg/d) | Manganese load (kg/d) | Metal load (kg/d) |
|---|---|---|---|---|---|---|---|
| 08/05/03 | 1.2 | -335 | 1,440 | 69 | 5.6 | 27 | 102 |
| 08/18/04 | .77 | -471 | 1,440 | 57 | 5.3 | 21 | 83 |
The QHEI score for habitat was 42. Sand and broken pieces of clay pottery (tile and bricks) were the major substrates. Substrate quality was poor because of the amount of silt and degree of embeddedness of the natural and artificial substrate. Coal fines settled in the depositional areas. Instream cover was moderate. The channel was characterized by fair to good development with no sinuosity and low to moderate stability. A very narrow strip of grass (<15 ft) protected the left bank from a city street, and a very narrow riparian corridor (<15 ft) protected the right bank from residential land use. The metric for pool/current quality score was 7 out of a possible 12. The metric for riffle/run score was 2 out of a possible 8. Site 1012 did not meet the LRW-AMD category because neither IBI nor the ICI met the respective aquatic uses.
During the synoptic studies in 2004, the metal load was lower and the net alkalinity load was more acidic than those of the synoptic study in 2003. The sulfate load was the same in 2004 as in 2003. Iron, manganese, and aluminum concentrations were higher in 2004 than in 2003, whereas streamflow was lower by a third and boron concentration was the same. For both samples collected at this site, iron, manganese, aluminum, specific conductance, sulfate, alkalinity, and pH exceeded the criteria that suggest AMD impacts (table 4).
| Name: | 051 Unnamed tributary to Rush Creek (28-3) at New Lexington—USGS station identification number 394313082130600 |
| Location: | River mile 0.20 |
| USGS Quadrangle: | New Lexington |
| Drainage Area: | 4.6 mi 2 |
Eleven johnny darter, 1 silverjaw minnow, 2 central stoneroller, 2 largemouth bass, 21 bluegill sunfish, and 65 creek chub were collected. The IBI score was 26. Creek chubs are highly tolerant to pollution, and the other species collected have intermediate tolerance to pollution and other forms of environmental stress (Barbour and others, 1999).
Macroinvertebrate samples included 49 total taxa. The quantitative portion yielded 1,219 organisms in 34 distinct taxa, including 3 EPT taxa (1 mayfly and 2 caddisflies). Qualitative sampling with a dipnet showed 30 distinct taxa, including 6 EPT taxa (4 mayflies and 2 caddisflies). The ICI score for this site was 32.
Concentration of major ions and field-measured characteristics at site 1017, Rush Creek, Perry County, Ohio.
[ft 3 /s, cubic feet per second; mg/L, milligrams per liter; µS/cm, microsiemens per centimeter; --, not determined]
| Date | Streamflow (ft 3 /s) | pH, field | Specific conductance, field (µS/cm) | Calcium, dissolved (mg/L) | Magnesium, dissolved (mg/L) | Potassium, dissolved (mg/L) | Sodium, dissolved (mg/L) | Acidity, hot peroxide (mg/L as CaCO 3 ) | Alkalinity (mg/L as CaCO 3 ) |
|---|---|---|---|---|---|---|---|---|---|
| 08/05/03 | 0.94 | 7.3 | 630 | 54.6 | 24.7 | 2.91 | 25.6 | -- | 74 |
| 08/18/04 | .65 | 7.4 | 520 | 49.5 | 24.9 | 3.36 | 16.5 | -- | 68 |
| Date | Bromide, dissolved (mg/L) | Chloride, dissolved (mg/L) | Fluoride, dissolved (mg/L) | Silica, dissolved (mg/L as SiO 2 ) | Sulfate, dissolved (mg/L as SO 4 ) | Aluminum, dissolved (mg/L) | Boron, dissolved (mg/L) | Iron, dissolved (mg/L) | Manganese, dissolved (mg/L) |
|---|---|---|---|---|---|---|---|---|---|
| 08/05/03 | 0.13 | 46.5 | 0.3 | 10.8 | 158 | 0.026 | 0.053 | 0.016 | 0.614 |
| 08/18/04 | .07 | 22.9 | 0.3 | 8.80 | 130 | .010 | .048 | .008 | .803 |
Instantaneous loads for selected constituents at site 1017, Rush Creek, Perry County, Ohio.
[ft 3 /s, cubic feet per second; kg/d, kilograms per day]
| Date | Streamflow (ft 3 /s) | Net alkalinity load (kg/d) | Sulfate load (kg/d) | Aluminum load (kg/d) | Iron load (kg/d) | Manganese load (kg/d) | Metal load (kg/d) |
|---|---|---|---|---|---|---|---|
| 08/05/03 | 0.94 | 170 | 363 | 0.060 | 0.037 | 1.4 | 1.5 |
| 08/18/04 | .65 | 108 | 207 | .015 | .013 | 1.3 | 1.3 |
The QHEI score for habitat was 48. Sand and silt were the major substrates in the stream channel. Substrate quality was poor because of the amount of silt and degree of embeddedness. Coal fines, as well as larger lumps, were present. Riprap and remnants of clay pottery were strewn along the streambed. Instream cover was sparse. The channel was characterized by low stability and sinuosity and fair to poor development. A very narrow riparian corridor (<15 ft) protected the stream from State Route 13 along the right bank and portions of the left bank, which has a parking lot along it. The metric for pool/current quality score was 8 out of a possible 12. The metric for riffle/run score was 1 out of a possible 8. Site 1017 met the LRW-AMD category because the IBI and ICI met the respective aquatic uses. Both the IBI score and ICI score increased at site 1017, indicating the water quality is higher than that at the other sites farther up in the watershed.
Concentration of major ions and field-measured characteristics at site 1017, Rush Creek, Perry County, Ohio, 1980–82.
[ft 3 /s, cubic feet per second; mg/L, milligrams per liter; µS/cm, microsiemens per centimeter; --, not determined; <, less than]
| Date | Streamflow (ft 3 /s) | pH, field | Specific conductance, field (µS/cm) | Acidity, hot peroxide (mg/L as CaCO 3 ) | Alkalinity (mg/L as CaCO 3 ) | Chloride, dissolved (mg/L) | Sulfate, dissolved (mg/L as SO 4 ) | Aluminum, dissolved (mg/L) | Iron, dissolved (mg/L) | Manganese, dissolved (mg/L) |
|---|---|---|---|---|---|---|---|---|---|---|
| 09/04/80 | 2.2 | 7.1 | 790 | -- | 25 | -- | -- | -- | -- | -- |
| 04/21/81 | 25 | 7.6 | 440 | -- | 28 | 69 | 95 | <0.2 | 0.070 | 1.42 |
| 07/17/81 | 1.9 | 6.9 | 766 | -- | 36 | 20 | 205 | .338 | .330 | 3.32 |
| 07/28/82 | .59 | 6.7 | 1,000 | -- | 38 | 120 | 260 | -- | -- | -- |
The watershed for this tributary to Rush Creek contains a reservoir that is used for drinking water in New Lexington.
Metals loads from this tributary are insignificant when compared to those in the main stem of Rush Creek. The net alkalinity is positive at this site, indicating alkaline waters that help offset the acidic water in the main stem. Concentrations of aluminum, iron, and manganese were below the SMCL during both water-quality synoptics. For both samples collected at this site, manganese and sulfate exceeded the criteria that suggest AMD impacts (table 4). The iron, aluminum, alkalinity, and pH criteria were not exceeded in either sample.
USGS personnel collected water-quality samples at this site in the early 1980s. These historical data are presented in the following table.
| Name: | Unnamed tributary to Rush Creek at Mainsville—USGS station identification number 394314082140900 |
| Location: | River mile 0.20 |
| USGS Quadrangle: | New Lexington |
| Drainage Area: | 3.8 mi 2 |
Seventeen johnny darter, 18 bluegill sunfish, 4 green sunfish, 4 largemouth bass, 2 southern redbelly dace, and 51 creek chub were collected. The IBI score for this site was 26. Southern redbelly dace have intermediate tolerance to pollution and environmental stress (Barbour and others, 1999). The fish data collected at site 1027 were similar to the data collected at site 1017.
Concentration of major ions and field-measured characteristics at site 1027, Rush Creek, Perry County, Ohio.
[ft 3 /s, cubic feet per second; mg/L, milligrams per liter; µS/cm, microsiemens per centimeter; --, not determined; E, estimated]
| Date | Streamflow (ft 3 /s) | pH, field | Specific conductance, field (µS/cm) | Calcium, dissolved (mg/L) | Magnesium, dissolved (mg/L) | Potassium, dissolved (mg/L) | Sodium, dissolved (mg/L) | Acidity, hot peroxide (mg/L as CaCO 3 ) | Alkalinity (mg/L as CaCO 3 ) |
|---|---|---|---|---|---|---|---|---|---|
| 08/05/03 | 1.2 | 7.0 | 450 | 38.4 | 21.1 | 2.55 | 10.8 | -- | 48 |
| 08/18/04 | .34 | 6.6 | 550 | 51.8 | 32.0 | 2.76 | 11.2 | -- | E29 |
| Date | Bromide, dissolved (mg/L) | Chloride, dissolved (mg/L) | Fluoride, dissolved (mg/L) | Silica, dissolved (mg/L as SiO 2 ) | Sulfate, dissolved (mg/L as SO 4 ) | Aluminum, dissolved (mg/L) | Boron, dissolved (mg/L) | Iron load (mg/L) | Manganese, dissolved (mg/L) |
|---|---|---|---|---|---|---|---|---|---|
| 08/05/03 | 0.04 | 20.2 | 0.3 | 11.8 | 132 | 0.003 | 0.036 | 0.018 | 0.463 |
| 08/18/04 | .07 | 16.0 | .3 | 12.1 | 194 | .002 | .039 | .010 | .352 |
Instantaneous loads for selected constituents at site 1027, Rush Creek, Perry County, Ohio.
[ft 3 /s, cubic feet per second; kg/d, kilograms per day]
| Date | Streamflow (ft 3 /s) | Net alkalinity load (kg/d) | Sulfate load (kg/d) | Aluminum load (kg/d) | Iron load (kg/d) | Manganese load (kg/d) | Metal load (kg/d) |
|---|---|---|---|---|---|---|---|
| 08/05/03 | 1.2 | 141 | 388 | 0.0088 | 0.054 | 1.4 | 1.5 |
| 08/18/04 | .34 | 24 | 161 | .0017 | .0085 | .29 | .30 |
Macroinvertebrate samples included 55 total taxa. The quantitative portion yielded 451 organisms in 32 distinct taxa, including 6 EPT taxa (4 mayflies and 2 caddisflies). Qualitative sampling with a dipnet showed 37 distinct taxa, including 9 EPT taxa (6 mayflies, 1 stonefly, and 2 caddisflies). The ICI score for this site was 40.
The QHEI score for habitat was 61, the highest value of all the sites except site 1009, which was used as a reference site. Sand and silt were the major substrates in the stream channel. Substrate quality was poor, although the amount of silt and degree of embeddedness was moderate instead of severe as it was at the other sites. Coal fines were not observed; bedrock and boulders were present in the reach. Instream cover was moderate, and channel sinuosity was low to moderate. The channel was characterized by fair to good development and moderate stability. A wide riparian corridor (>160 ft) of mature trees bordered the left bank and a narrow strip (15–30 ft) protected the right bank. The metric for pool/current quality score was 7 out of a possible 12. The metric for riffle/run score was 1.5 out of a possible 8.
Site 1027 met the LRW-AMD category. The biological data collected at site 1027 are similar in score to the data collected at site 1017. The ICI score at site 1027, more than the IBI score, supports the higher QHEI score of 61.
Metals loads from this tributary are insignificant when compared to the main stem of Rush Creek. The net alkalinity is positive at this site, indicating alkaline waters that help offset the acidic water in the main stem. For both samples collected at this site, sulfate concentrations exceeded the criteria for that suggest AMD impacts (table 4). No other constituent exceeded the criteria in table 4.
| Name: | Unnamed tributary to Rush Creek near Junction City—USGS station identification number 394344082152200 |
| Location: | River mile 0.60 |
| USGS Quadrangle: | Junction City |
| Drainage Area: | 1.7 mi 2 |
Concentration of major ions and field-measured characteristics at site 1002, Rush Creek, Perry County, Ohio.
[ft 3 /s, cubic feet per second; mg/L, milligrams per liter; µS/cm, microsiemens per centimeter; --, not determined]
| Date | Streamflow (ft 3 /s) | pH, field | Specific conductance, field (µS/cm) | Calcium, dissolved (mg/L) | Magnesium, dissolved (mg/L) | Potassium, dissolved (mg/L) | Sodium, dissolved (mg/L) | Acidity, hot peroxide (mg/L as CaCO 3 ) | Alkalinity (mg/L as CaCO 3 ) |
|---|---|---|---|---|---|---|---|---|---|
| 08/05/03 | 0.23 | 6.9 | 520 | 49.8 | 23.3 | 2.52 | 11.6 | -- | 48 |
| 08/17/04 | .07 | 6.8 | 720 | 78.1 | 37.3 | 3.21 | 14.7 | -- | 53 |
| Date | Bromide, dissolved (mg/L) | Chloride, dissolved (mg/L) | Fluoride, dissolved (mg/L) | Silica, dissolved (mg/L as SiO 2 ) | Sulfate, dissolved (mg/L as SO 4 ) | Aluminum, dissolved (mg/L) | Boron, dissolved (mg/L) | Iron, dissolved (mg/L) | Manganese, dissolved (mg/L) |
|---|---|---|---|---|---|---|---|---|---|
| 08/05/03 | 0.06 | 20.3 | 0.2 | 11.5 | 173 | 0.003 | 0.043 | 0.012 | 0.546 |
| 08/17/04 | .09 | 21.1 | .2 | 8.59 | 284 | .002 | .045 | <.006 | .148 |
Instantaneous loads for selected constituents at site 1002, Rush Creek, Perry County, Ohio.
[ft 3 /s, cubic feet per second; kg/d, kilograms per day]
| Date | Streamflow (ft 3 /s) | Net alkalinity load (kg/d) | Sulfate load (kg/d) | Aluminum load (kg/d) | Iron load (kg/d) | Manganese load (kg/d) | Metal load (kg/d) |
|---|---|---|---|---|---|---|---|
| 08/05/03 | 0.23 | 27 | 97 | 0.0017 | 0.0070 | 0.31 | 0.32 |
| 08/17/04 | .07 | 9.1 | 49 | .00034 | -- | .025 | .025 |
Sixty-six bluegill sunfish, 90 green sunfish, 10 largemouth bass, and 59 creek chub were collected. The IBI score for this site was 28. Macroinvertebrate samples included 50 total taxa. The quantitative portion yielded 1,230 organisms in 29 distinct taxa, including 4 EPT taxa (mayflies). Qualitative sampling with a dipnet showed 32 distinct taxa, including 5 EPT taxa (4 mayflies and 1 caddisfly). The ICI score was 30.
The QHEI score for habitat was 57. Sand and hardpan were the major substrates in the stream channel. Substrate quality was poor, although the amount of silt was normal for an area of agricultural land use. The degree of embeddedness was normal. Coal fines were not observed. Cobble and boulders were present in the reach. Instream cover was sparse, and channel sinuosity was moderate. The channel was characterized by fair development and low to moderate stability. A very narrow riparian corridor (<15 ft) protected both banks. The metric for pool/current quality score was 7 out of a possible 12. The metric for riffle/run score was 2.5 out of a possible 8.
Site 1027 met the LRW-AMD category. The biological data collected at site 1002 are similar in score to the biological data collected at sites 1017 and 1027 but not as high, which is expected considering the increased amount of land used for agriculture at site 1002.
Metals loads from this tributary are insignificant when compared to the main stem of Rush Creek. The net alkalinity is positive at this site, indicating alkaline waters that help offset the acidic water in the main stem. For both samples collected at this site, sulfate concentrations exceeded the criteria for that suggest AMD impacts (table 4). For one sample, manganese exceeded the criterion. No other constituent exceeded the criteria in table 4.
Concentration of major ions and field-measured characteristics at site 1011, Rush Creek, Perry County, Ohio.
[ft 3 /s, cubic feet per second; mg/L, milligrams per liter; µS/cm, microsiemens per centimeter]
| Date | Streamflow (ft 3 /s) | pH, field | Specific conductance, field (µS/cm) | Calcium, dissolved (mg/L) | Magnesium, dissolved (mg/L) | Potassium, dissolved (mg/L) | Sodium, dissolved (mg/L) | Acidity, hot peroxide (mg/L as CaCO 3 ) | Alkalinity (mg/L as CaCO 3 ) |
|---|---|---|---|---|---|---|---|---|---|
| 08/06/03 | 1.4 | 4.8 | 860 | 77.8 | 41.3 | 3.46 | 15.2 | 16 | 1 |
| 12/16/03 | 5.3 | 6.1 | 480 | 48.5 | 26.0 | 2.18 | 9.70 | 2 | 5 |
| 08/17/04 | .93 | 4.6 | 980 | 94.5 | 52.9 | 2.44 | 14.5 | 33 | 2 |
| Date | Bromide, dissolved (mg/L) | Chloride, dissolved (mg/L) | Fluoride, dissolved (mg/L) | Silica, dissolved (mg/L as SiO 2 ) | Sulfate, dissolved (mg/L as SO 4 ) | Aluminum, dissolved (mg/L) | Boron, dissolved (mg/L) | Iron, dissolved (mg/L) | Manganese, dissolved (mg/L) |
|---|---|---|---|---|---|---|---|---|---|
| 08/06/03 | 0.27 | 32.9 | 0.5 | 15.9 | 405 | 1.810 | 0.063 | 0.333 | 7.75 |
| 12/16/03 | .17 | 19.2 | .2 | 14.3 | 226 | .380 | .035 | .793 | 3.44 |
| 08/17/04 | .18 | 27.1 | .6 | 18.8 | 478 | 3.770 | .070 | .467 | 8.02 |
Instantaneous loads for selected constituents at site 1011, Rush Creek, Perry County, Ohio.
[ft 3 /s, cubic feet per second; kg/d, kilograms per day]
| Date | Streamflow (ft 3 /s) | Net alkalinity load (kg/d) | Sulfate load (kg/d) | Aluminum load (kg/d) | Iron load (kg/d) | Manganese load (kg/d) | Metal load (kg/d) |
|---|---|---|---|---|---|---|---|
| 08/06/03 | 1.4 | -54 | 1,390 | 6.2 | 1.1 | 27 | 34 |
| 12/16/03 | 5.3 | -26 | 2,930 | 4.9 | 10 | 45 | 60 |
| 08/17/04 | 0.93 | -75 | 1,090 | 8.6 | 1.1 | 18 | 28 |
Concentration of major ions and field-measured characteristics at site 1011, Rush Creek, Perry County, Ohio, 1980–82.
[ft 3 /s, cubic feet per second; mg/L, milligrams per liter; µS/cm, microsiemens per centimeter; --, not determined; <, less than]
| Date | Streamflow (ft 3 /s) | pH, field | Specific conductance, field (µS/cm) | Acidity, hot peroxide (mg/L as CaCO 3 ) | Alkalinity (mg/L as CaCO 3 ) | Chloride, dissolved (mg/L) | Sulfate, dissolved (mg/L as SO 4 ) | Aluminum, dissolved (mg/L) | Iron, dissolved (mg/L) | Manganese, dissolved (mg/L) |
|---|---|---|---|---|---|---|---|---|---|---|
| 09/04/80 | 3.2 | 4.4 | 1,100 | 89 | -- | -- | -- | -- | -- | -- |
| 04/13/81 | 15 | 4.8 | 562 | 70 | -- | 39 | 210 | 1.70 | 0.810 | 4.15 |
| 07/24/81 | 1.4 | 4.3 | 1,300 | 119 | -- | 110 | 490 | 10.1 | .520 | 12.0 |
| 04/03/82 | 18 | 4.9 | 620 | 32 | -- | -- | -- | -- | -- | -- |
| 07/20/82 | 1.1 | 4.0 | 1,360 | 99 | -- | 77 | 530 | 9.60 | .690 | 12.0 |
| Name: | 051 Turkey Run (28-6) near Junction City—USGS station identification number 394214082160900 |
| Location: | River mile 0.70 |
| USGS Quadrangle: | Junction City |
| Drainage Area: | 4.6 mi 2 |
Twelve bluegill sunfish, three green sunfish, and two creek chub were collected. The IBI score for this site was 32. With such a low number of individuals in the sample, the IBI does not discriminate well.
Macroinvertebrate samples included 18 total taxa. The quantitative portion yielded 30 organisms in 9 distinct taxa, including 2 EPT taxa (caddisflies). Qualitative sampling with a dipnet showed 10 distinct taxa, including 3 EPT taxa (caddisflies). The ICI score at this site was 4.
The QHEI score for habitat was 54. Sand and gravel were the major substrates in the stream channel. Substrate quality was fair, although the amount of silt was moderate to heavy. The degree of embeddedness was moderate to extensive. Coal fines were observed. Cobble and a few boulders were present in the reach. Instream cover was sparse, and channel sinuosity was low. The channel was characterized by fair development and low stability. A very narrow riparian corridor (<15 ft) protected each bank from fenced pasture on the left and residential areas on the right. The metric for pool/current quality score was 8 out of a possible 12. The metric for riffle/run score was 1.5 out of a possible 8.
Concentration of major ions and field-measured water-quality characteristics in the Turkey Run subwatershed, Rush Creek, Perry County, Ohio.
[ft 3 /s, cubic feet per second; mg/L, milligrams per liter; µS/cm, microsiemens per centimeter; --, not determined; BOLD type indicates sites that are possibly affected by snowmelt]
| Site | Date | Streamflow (ft 3 /s) | pH, field | Specific conductance, field (µS/cm) | Calcium, dissolved (mg/L) | Magnesium, dissolved (mg/L) | Potassium, dissolved (mg/L) |
|---|---|---|---|---|---|---|---|
| 5000 | 12/17/03 | 0.8 | 4.2 | 1,020 | 68.7 | 46.0 | 3.70 |
| 5001 | 12/16/03 | .32 | 3.2 | 1,320 | 50.4 | 43.8 | 1.43 |
| 5002 | 12/17/03 | 1.2 | 7.4 | 190 | 16.6 | 6.94 | 1.64 |
| 5003 | 12/17/03 | 1.7 | 6.6 | 630 | 73.5 | 31.0 | 3.13 |
| 5004 | 12/17/03 | 4.5 | 6.8 | 550 | 57.9 | 25.8 | 2.70 |
| 5005 | 12/17/03 | 19 | 7.3 | 410 | 39.1 | 19.2 | 2.67 |
| 5006 | 12/16/03 | 4.7 | 7.5 | 490 | 49.9 | 25.5 | 2.36 |
| 5007 | 12/17/03 | 6.5 | 7.8 | 490 | 49.1 | 22.1 | 2.51 |
| Site | Sodium, dissolved (mg/L) | Acidity, hot peroxide (mg/L as CaCO 3 ) | Alkalinity (mg/L as CaCO 3 ) | Bromide, dissolved (mg/L) | Chloride, dissolved (mg/L) | Fluoride, dissolved (mg/L) | |
|---|---|---|---|---|---|---|---|
| 5000 | 9.56 | 86 | -- | 0.27 | 29.4 | 0.8 | |
| 5001 | 8.94 | 262 | -- | .23 | 27.8 | .9 | |
| 5002 | 6.32 | -- | 28 | .06 | 11.0 | <.2 | |
| 5003 | 13.6 | -- | 90 | .04 | 20.7 | .2 | |
| 5004 | 9.87 | -- | 34 | .36 | 13.1 | .2 | |
| 5005 | 7.81 | -- | 21 | .09 | 15.0 | .2 | |
| 5006 | 9.93 | -- | 15 | .19 | 18.8 | .2 | |
| 5007 | 8.64 | -- | 30 | .19 | 13.3 | .2 |
| Site | Silica, dissolved (mg/L as SiO 2 ) | Sulfate, dissolved (mg/L as SO 4 ) | Aluminum, dissolved (mg/L) | Boron, dissolved (mg/L) | Iron, dissolved (mg/L) | Manganese, dissolved (mg/L) | |
|---|---|---|---|---|---|---|---|
| 5000 | 572 | 572 | 9.01 | 0.025 | 5.61 | 11.8 | |
| 5001 | 805 | 805 | 29.9 | .014 | 8.22 | 20.1 | |
| 5002 | 369 | 36.9 | .010 | .024 | .106 | .138 | |
| 5003 | 199 | 199 | .016 | .041 | .044 | .783 | |
| 5004 | 213 | 213 | .050 | .059 | 2.91 | 1.16 | |
| 5005 | 147 | 147 | .013 | .031 | .243 | 1.66 | |
| 5006 | 207 | 207 | .018 | .038 | .843 | 2.53 | |
| 5007 | 179 | 179 | .015 | .047 | 1.71 | 1.01 |
Instantaneous loads for selected constituents in the Turkey Run subwatershed, Rush Creek, Perry County, Ohio.
[ft 3 /s, cubic feet per second; kg/d, kilograms per day; BOLD type indicates sites that are possibly affected by snowmelt]
| Site | Date | Streamflow (ft 3 /s) | Net alkalinity load (kg/d) | Sulfate load (kg/d) | Aluminum load (kg/d) | Iron load (kg/d) | Manganese load (kg/d) | Metal load (kg/d) |
|---|---|---|---|---|---|---|---|---|
| 5000 | 12/17/03 | 0.8 | -170 | 1,120 | 18 | 11 | 23 | 52 |
| 5001 | 12/16/03 | .32 | -210 | 630 | 23 | 6.4 | 16 | 45 |
| 5002 | 12/17/03 | 1.2 | 82 | 110 | 0.03 | 0.31 | 0.41 | .75 |
| 5003 | 12/17/03 | 1.7 | 370 | 830 | 0.07 | .18 | 3.3 | 3.6 |
| 5004 | 12/17/03 | 4.5 | 370 | 2,350 | 0.55 | 32 | 13 | 46 |
| 5005 | 12/17/03 | 19 | 980 | 6,830 | 0.60 | 11 | 77 | 89 |
| 5006 | 12/16/03 | 4.7 | 170 | 2,380 | 0.21 | 10 | 29 | 39 |
| 5007 | 12/17/03 | 6.5 | 480 | 2,850 | 0.24 | 27 | 16 | 43 |
Site 1011 did not meet the LRW-AMD category because the ICI did not meet the respective aquatic use. For all three samples collected at this site, sulfate, manganese, alkalinity, and aluminum concentrations exceeded the criteria that suggest AMD impacts (table 4). The specific conductance criterion was exceeded in two of the samples and the iron-concentration criterion was exceeded in one sample.
USGS personnel collected water-quality samples at this site in the early 1980s. These historical data are presented in the following table.
During the sampling on December 17, the air temperature rose above freezing and the samples late in the day contained snowmelt. The introduction of water from snowmelt makes comparing sites within this subwatershed nearly impossible. The data are presented because the criteria in table 4 indicate that sites 5000 and 5001 show signs of AMD affects. During field reconnaissance an abandoned surface mine and possible deep mines were noted in the headwaters of Turkey Run (upstream from sites 5004 and 5003, fig. 3). The water-quality data indicate only slightly elevated metals and a positive net alkalinity at these sites. The abandoned surface mine may be grown over enough to not show signs of AMD, or the discharge from these areas may have been frozen. Time limitations to this study did not allow for more samples to be collected, but revisiting this subwatershed during spring runoff and low flow may produce different results.
Concentration of major ions and field-measured characteristics at site 1025, Rush Creek, Perry County, Ohio.
[ft 3 /s, cubic feet per second; mg/L, milligrams per liter; µS/cm, microsiemens per centimeter; --, not determined]
| Date | Streamflow (ft 3 /s) | pH, field | Specific conductance, field (µS/cm) | Calcium, dissolved (mg/L) | Magnesium, dissolved (mg/L) | Potassium, dissolved (mg/L) | Sodium, dissolved (mg/L) | Acidity, hot peroxide (mg/L as CaCO 3 ) | Alkalinity (mg/L as CaCO 3 ) |
|---|---|---|---|---|---|---|---|---|---|
| 08/06/03 | 0.36 | 7.0 | 360 | 37.9 | 13.0 | 2.75 | 14.9 | -- | 72 |
| 08/17/04 | .10 | 7.8 | 420 | 42.4 | 14.9 | 2.91 | 16.8 | -- | 99 |
| Date | Bromide, dissolved (mg/L) | Chloride, dissolved (mg/L) | Fluoride, dissolved (mg/L) | Silica, dissolved (mg/L as SiO 2 ) | Sulfate, dissolved (mg/L as SO 4 ) | Aluminum, dissolved (mg/L) | Boron, dissolved (mg/L) | Iron, dissolved (mg/L) | Manganese, dissolved (mg/L) |
|---|---|---|---|---|---|---|---|---|---|
| 08/06/03 | 0.10 | 32.4 | <0.2 | 9.26 | 48 | 0.004 | 0.041 | 0.009 | 0.152 |
| 08/17/04 | .09 | 34.3 | <0.2 | 7.64 | 61 | .003 | .052 | .009 | .123 |
Instantaneous loads for selected constituents at site 1025, Rush Creek, Perry County, Ohio.
[ft 3 /s, cubic feet per second; kg/d, kilograms per day]
| Date | Streamflow (ft 3 /s) | Net alkalinity load (kg/d) | Sulfate load (kg/d) | Aluminum load (kg/d) | Iron load (kg/d) | Manganese load (kg/d) | Metal load (kg/d) |
|---|---|---|---|---|---|---|---|
| 08/06/03 | 0.36 | 63 | 42 | 0.0035 | 0.0079 | 0.13 | 0.14 |
| 08/17/04 | .10 | 24 | 15 | .0007 | .0022 | .030 | .033 |
| Name: | Unnamed tributary to Rush Creek at Junction City—USGS station identification number 394341082184300 |
| Location: | River mile 0.40 |
| USGS Quadrangle: | Junction City |
| Drainage Area: | 2.1 mi 2 |
Five johnny darter, 11 largemouth bass, 56 bluegill sunfish, 10 green sunfish, and 38 creek chub were collected. The IBI score for this site was 32.
Macroinvertebrate samples included 50 total taxa. The quantitative portion yielded 1,509 organisms in 33 distinct taxa, including 9 EPT taxa (7 mayflies and 2 caddisflies) Qualitative sampling with a dipnet showed 35 distinct taxa, including 11 EPT taxa (7 mayflies and 4 caddisflies). The ICI score was 50—the highest ICI score of all the study sites, including site 1009, the reference site.
The QHEI score for habitat was 59. Hardpan and cobble were the major substrates and an unusual combination in the stream channel. Substrate quality was fair; the amount of silt was normal to moderate. The degree of embeddedness was also normal to moderate. Coal fines were not observed. Boulders, gravel, sand, and riprap were abundant substrates in the reach when compared to other sites in the study. Instream cover was moderate, and channel sinuosity was low. The channel was characterized by low to moderate stability and fair development. A very narrow riparian corridor (<15 ft) protected both banks from pasture on the left and State Route 668 on the right. The metric for pool/current quality score was 6 out of a possible 12. The metric for riffle/run quality score was 4.5 out of a possible 8. Riffle habitat was higher in quality and quantity than at the other sites in this study.
Site 1025 met the LRW-AMD category because both the IBI and ICI scores met the respective aquatic uses. The ICI score was highest for any of the sites in the study, due in part to the amount of unembedded riffle habitat available to sensitive species such as mayflies and caddisflies.
Metal loads from this tributary are insignificant when compared to the main stem of Rush Creek, and concentrations of aluminum, iron, and manganese are unchanged from 2003 to 2004 and are below the SMCLs. The net alkalinity is positive at this site, indicating alkaline waters that may help offset the acidic water in the main stem. The criteria that suggest AMD impacts (table 4) were not exceeded by any sample at the site.
Concentration of major ions and field-measured characteristics at site 1023, Rush Creek, Perry County, Ohio.
[ft 3 /s, cubic feet per second; mg/L, milligrams per liter; µS/cm, microsiemens per centimeter; --, not determined; E, estimated]
| Date | Streamflow (ft 3 /s) | pH, field | Specific conductance, field (µS/cm) | Calcium, dissolved (mg/L) | Magnesium, dissolved (mg/L) | Potassium, dissolved (mg/L) | Sodium, dissolved (mg/L) | Acidity, hot peroxide (mg/L as CaCO 3 ) | Alkalinity (mg/L as CaCO 3 ) |
|---|---|---|---|---|---|---|---|---|---|
| 08/06/03 | 1.1 | 6.8 | 440 | 38.7 | 19.6 | 2.96 | 13.5 | -- | 65 |
| 08/17/04 | 0.13 | 6.6 | 440 | 42.7 | 22.3 | 2.73 | 12.5 | -- | 70 |
| Date | Bromide, dissolved (mg/L) | Chloride, dissolved (mg/L) | Fluoride, dissolved (mg/L) | Silica, dissolved (mg/L as SiO 2 ) | Sulfate, dissolved (mg/L as SO 4 ) | Aluminum, dissolved (mg/L) | Boron, dissolved (mg/L) | Iron, dissolved (mg/L) | Manganese, dissolved (mg/L) |
|---|---|---|---|---|---|---|---|---|---|
| 08/06/03 | 0.05 | 26.6 | 0.2 | 6.78 | 103 | 0.004 | 0.038 | E0.008 | 0.428 |
| 08/17/04 | .08 | 26.1 | 0.2 | 3.54 | 108 | .004 | .040 | E.006 | .167 |
Instantaneous loads for selected constituents at site 1023, Rush Creek, Perry County, Ohio.
[ft 3 /s, cubic feet per second; kg/d, kilograms per day]
| Date | Streamflow (ft 3 /s) | Net alkalinity load (kg/d) | Sulfate load (kg/d) | Aluminum load (kg/d) | Iron load (kg/d) | Manganese load (kg/d) | Metal load (kg/d) |
|---|---|---|---|---|---|---|---|
| 08/06/03 | 1.1 | 175 | 277 | 0.11 | 0.022 | 1.2 | 1.3 |
| 08/17/04 | 0.13 | 22 | 34 | .0013 | .0018 | .053 | .056 |
| Name: | Dry Run near Junction City—USGS station identification number 394316082200000 |
| Location: | River mile 0.40 |
| USGS Quadrangle: | Junction City |
| Drainage Area: | 5.2 mi 2 |
Six largemouth bass, 18 bluegill sunfish, 2 green sunfish, 4 white sucker, 1 yellow bullhead, and 11 creek chub were collected. The IBI score for this site was 28. White suckers are highly tolerant of pollution. Some of the creek chubs had tumors, and the yellow bullhead had a chin lesion.
Macroinvertebrate samples included 45 total taxa. The quantitative portion yielded 741 organisms in 27 distinct taxa, including 4 EPT taxa (3 mayflies and 1 caddisfly). Qualitative sampling with a dipnet showed 31 distinct taxa, including 5 EPT taxa (2 mayflies and 3 caddisflies). The ICI score was 30.
The QHEI for habitat was 51. Sand and silt were the major substrates in the stream channel. Substrate quality was fair, and the amount of silt was moderate. The degree of embeddedness also was moderate. Coal fines were not observed. Boulders, cobble, and gravel were abundant. Instream cover was sparse, and channel sinuosity was low to moderate. The channel was characterized by fair to good development and low to moderate stability. A narrow riparian corridor (15–30 ft) protected each bank from row crops planted on both sides of the stream. Erosion was moderate to heavy. The metric for pool/current quality score was 5 out of a possible 12. The metric for riffle/run quality score was 3 out of a possible 8. Site 1023 met the LRW-AMD category because the IBI and ICI scores met the respective aquatic uses.
Metals loads from this tributary are insignificant when compared to the main stem of Rush Creek. The net alkalinity is positive at this site, indicating alkaline waters that help offset the acidic water in the main stem. Concentrations of sulfate, aluminum, and iron were below the SMCL during both water-quality synoptics. For both samples collected at this site, sulfate concentrations exceeded the criteria that suggest AMD impacts (table 4). No other constituent on concentration criteria were exceeded by either sample at the site.
| Name: | Center Branch Rush Creek near Junction City—USGS station identification number 03156549 |
| Location: | River mile 0.80 |
| USGS Quadrangle: | Junction City |
| Drainage Area: | 22.4 mi 2 |
Concentration of major ions and field-measured characteristics at site 1009, Rush Creek, Perry County, Ohio.
[ft 3 /s, cubic feet per second; mg/L, milligrams per liter; µS/cm, microsiemens per centimeter; --, not determined]
| Date | Streamflow (ft 3 /s) | pH, field | Specific conductance, field (µS/cm) | Calcium, dissolved (mg/L) | Magnesium, dissolved (mg/L) | Potassium, dissolved (mg/L) | Sodium, dissolved (mg/L) | Acidity, hot peroxide (mg/L as CaCO 3 ) | Alkalinity (mg/L as CaCO 3 ) |
|---|---|---|---|---|---|---|---|---|---|
| 08/06/03 | 6.2 | 7.4 | 380 | 35.7 | 13.7 | 3.13 | 15.5 | -- | 86 |
| 08/17/04 | 2.0 | 7.5 | 380 | 38.1 | 13.3 | 3.62 | 16.7 | -- | 103 |
| Date | Bromide, dissolved (mg/L) | Chloride, dissolved (mg/L) | Fluoride, dissolved (mg/L) | Silica, dissolved (mg/L as SiO 2 ) | Sulfate, dissolved (mg/L as SO 4 ) | Aluminum, dissolved (mg/L) | Boron, dissolved (mg/L) | Iron, dissolved (mg/L) | Manganese, dissolved (mg/L) |
|---|---|---|---|---|---|---|---|---|---|
| 08/06/03 | 0.07 | 34.2 | 0.2 | 5.00 | 46.4 | 0.006 | 0.038 | 0.011 | 0.0769 |
| 08/17/04 | .09 | 31.8 | 0.2 | 4.56 | 39.8 | .003 | .050 | .013 | .103 |
Instantaneous loads for selected constituents at site 1009, Rush Creek, Perry County, Ohio.
[ft 3 /s, cubic feet per second; kg/d, kilograms per day]
| Date | Streamflow (ft 3 /s) | Net alkalinity load (kg/d) | Sulfate load (kg/d) | Aluminum load (kg/d) | Iron load (kg/d) | Manganese load (kg/d) | Metal load (kg/d) |
|---|---|---|---|---|---|---|---|
| 08/06/03 | 6.2 | 1,300 | 704 | 0.091 | 0.17 | 1.2 | 1.5 |
| 08/17/04 | 2.0 | 504 | 195 | .015 | .063 | .50 | .58 |
Center Branch Rush Creek was the largest tributary in the study area and the only stream designated Warmwater Habitat (WWH) (table 4). This site was sampled as local reference to compare what may have existed as an aquatic environment and what may be possible again in the Rush Creek watershed.
Seven least brook lamprey, 4 northern hog sucker, 51 white sucker, 1 common carp, 19 creek chub, 17 spotfin shiner, 57 bluntnose minnow, 4 central stoneroller, 5 yellow bullhead, 8 brindled madtom, 4 blackstripe topminnow, 4 largemouth bass, 24 green sunfish, 116 bluegill sunfish, 7 blackside darter, 2 logperch darter, 9 johnny darter, 8 greenside darter, 4 banded darter, and 14 fantail darter were collected. The IBI score at this site was 42. A score of 42 is close enough to meet the minimum WWH score of 44. The IWB score of 7.0 at this site does not meet the minimum WWH score of 8.4.
Macroinvertebrate samples included 57 total taxa. The quantitative portion yielded 1,884 organisms in 43 distinct taxa, including 7 EPT taxa (4 mayflies and 3 caddisflies). Qualitative sampling with a dipnet showed 32 distinct taxa, including 10 EPT taxa (5 mayflies, 1 stonefly, and 4 caddisflies). The ICI score was 40. The ICI score meets the minimum WWH score of 36.
The QHEI score for habitat was 73. This is the highest of the study. A score of 76 is considered excellent. Similar to site 1025, the major substrate was sand and hardpan. Substrate quality was good. The amount of silt and degree of embeddedness was normal. Coal fines were not observed. Boulders, cobble, and gravel were present in the reach. Riprap under the bridge created the only riffle in the reach. The metric for instream cover was good, scoring 16 out of a possible 20. Channel sinuosity was low at best. The channel was characterized by fair to good development and moderate stability. A narrow riparian corridor (15–30 ft) of mature trees protected the left bank, and a narrow strip similar in width protected the right bank from fenced pasture and row crops. The metric for pool/current quality score was 12 out of a possible 12. The metric for riffle/run quality score was 6 out of a possible 8.
Site 1009 did not fully meet the WWH category. The IBI and ICI scores met the WWH category, but the low scoring IWB did not. Site 1009 met the WWH category in part. The low score for the IWB may be attributed to the lack of riffle habitat in combination with a dominance of hardpan. This unusual combination of substrate materials prevented site 1009 from supporting a greater proportion of sensitive species of fish. About half of the biomass in the Center Branch Rush Creek fish sample consisted of 1 carp and 55 white suckers, both being very tolerant of pollution. The criteria that suggest AMD impacts (table 4) were not exceeded by any sample at the site.
Contributions of AMD from the Rush Creek headwater and tributary sites were compared with respect to the loads computed from the August 2003 moderate-flow synoptic. The moderate-flow sampling was used for this comparison because streamflow was more likely near normal flow conditions than the August 2004 synoptic was.
For this comparison, two assumptions were made: (1) the majority of the AMD is delivered to Rush Creek from the tributaries and headwaters (site 1006) and (2) because there are no long-term streamflow records, the August 2003 streamflows are assumed to be near normal conditions.
In table 6, the sites are ordered by the combined amount of iron, manganese, and aluminum load (combined metal load) the tributary contributes to Rush Creek. The total metal load can then be compared across rows to the sulfate, acidity, alkalinity, and biological data for each site. Site 1003, the stream that drains the watershed containing the Rehoboth reclamation area, has the largest combined metal load, contributing almost 50 percent of the total load in Rush Creek. Site 1003 contributes the largest sulfate and the most acidic load to Rush Creek.
[kg/d, kilograms per day; <, less than; combined metal load includes iron, manganese, and aluminum]
| Site | Combined metals | Sulfate | Net alkalinity | Biological indices | |||||||
|---|---|---|---|---|---|---|---|---|---|---|---|
| Load (kg/d) | Percent of total load (kg/d) | Load (kg/d) | Percent of total load (kg/d) | Load (kg/d) | Percent acidity | Percent alkalinity | IBI | QHEI | ICI | Combined scores | |
| 1003 | 332 | 49.7 | 6,410 | 39.4 | -1,670 | 67.4 | - | 12 | 49 | 10 | 71 |
| 1006 | 117 | 17.5 | 4,040 | 24.8 | -171 | 6.9 | - | 12 | 51 | 2 | 65 |
| 1012 | 102 | 15.2 | 1,440 | 8.9 | -335 | 13.6 | - | 12 | 42 | 2 | 56 |
| 1050 a | 78 | 11.6 | 1,130 | 6.9 | -246 | 9.9 | - | NA | NA | NA | NA |
| 1011 | 34 | 5.1 | 1,390 | 8.5 | -54 | 2.2 | - | 32 | 54 | 4 | 90 |
| 1017 | 1.5 | .2 | 363 | 2.2 | 170 | - | 9.1 | 26 | 48 | 32 | 106 |
| 1009 | 1.5 | .2 | 704 | 4.3 | 1,300 | - | 69.3 | 42 | 73 | 40 | 155 |
| 1027 | 1.4 | .2 | 388 | 2.4 | 141 | - | 7.5 | 26 | 61 | 40 | 127 |
| 1023 | 1.3 | .2 | 277 | 1.7 | 175 | - | 9.3 | 28 | 51 | 30 | 109 |
| 1002 | .32 | <0.1 | 97 | 0.6 | 27 | - | 1.4 | 28 | 57 | 30 | 115 |
| 1025 | .14 | <0.1 | 42 | 0.3 | 63 | - | 3.4 | 32 | 59 | 50 | 141 |
a Site 1050 was sampled 3/10/2004 during similar flow conditions.
Although site 1003 is the largest contributor of combined metals, sulfate, and acidic loads, the scores for the biological community are surprisingly high. The macroinvertebrate community at site 1003 was unusual in that a large number of very few taxa (one of which has many members that are sensitive to pollution) were found, creating what is possibly an artificially high ICI score. The site with the lowest combined biological score (site 1012) drains an area that may have some unidentified deep mines and is in an urban area that is also detrimental to habitat and macroinvertebrate populations. In hindsight, this subwatershed would have been an excellent candidate for a more detailed study such as that conducted for Turkey Run and the watershed near Rehoboth.
In table 7, the sites sampled during the detailed study of the reclamation area are ordered by the combined amount of iron, manganese, and aluminum load (combined metal load) the tributary contributes to Rush Creek. The total metal load can then be compared across rows to the sulfate, acidity, alkalinity for each site. Unlike the Rush Creek main-stem and tributary sites, there are no biological data for comparison.
[ft 3 /s, cubic feet per second; kg/d, kilograms per day; BOLD type indicates seeps within the Rehoboth reclamation area; NA, not applicable]
| Site | Flow (ft 3 /s) | Metal load (kg/d) | Percent dissolved metal load | Sulfate load (kg/d) | Percent sulfate load (kg/d) | Net alkalinity load | Percent acidity |
|---|---|---|---|---|---|---|---|
| 3004 | 0.07 | 365 | 51.4 | 1,161 | 20.6 | -781 | 47.2 |
| 3010 | 1.1 | 136 | 19.1 | 2,427 | 43.1 | -393 | 23.7 |
| 3000 | .04 | 94 | 13.2 | 456 | 8.1 | -181 | 10.9 |
| 3009 | .61 | 31 | 4.4 | 949 | 16.9 | -69 | 4.2 |
| 3002 | .004 | 30 | 4.3 | 99 | 1.8 | -68 | 4.1 |
| 3003 | .002 | 22 | 3.1 | 65 | 1.2 | -48 | 2.9 |
| 3001 | .02 | 15 | 2.1 | 116 | 2.1 | -30 | 1.8 |
| 3006 | .07 | 9.0 | 1.3 | 197 | 3.5 | -48 | 2.9 |
| 3008 | .04 | 4.6 | .6 | 114 | 2.0 | -24 | 1.5 |
| 3005 | .004 | 1.7 | .2 | 27 | 0.5 | -10 | .6 |
| 3007 | .003 | 1.5 | .2 | 21 | 0.4 | -3.6 | .2 |
| 3011 | .72 | 210 | NA | 2,167 | NA | -791 | NA |
| 3012 | 1.5 | 280 | NA | 4,037 | NA | -1,094 | NA |
| 1003 | 2.2 | 332 | NA | 6,410 | NA | -1,670 | NA |
The primary metal loading comes from site 3004, the outfall of the drainage tiles under pond 5 in the Rehoboth reclamation area (fig 2). Site 3005 drains the surface water from the same pond but is much lower on table 7. Sites 3011 and 3012 are not ordered because these sites are on the main stem of the creek within the reclamation area (fig. 2), between ponds 2 and 3; they are not representative of separate sources but are a composite of the drainage above each site. The sample from site 1003 is also included on the table but not ordered because it is the most downstream sample before the confluence with Rush Creek.
Because of the low flow of the seeps and the observed head differences between surface water and ground water at the ponds, the contribution of the seeps to the overall AMD load is probably minimal compared to the ground-water flow into the creek. To help understand the process, a more detailed study of the quantity and quality of the ground-water flow in and around the reclamation site would be required. That study would need to include investigation of recharge to the gob pile and inflow into the ponds from ground water.
Rush Creek is a tributary to the Hocking River in southeastern Ohio. Mining and coal processing in the headwaters of Rush Creek have produced acid mine drainage problems in a 12-mi reach. Of particular interest is an Ohio Department of Natural Resources, Division of Mineral Resources Management (ODNR-MRM) reclamation project of approximately 450 acres of abandoned mine land near the town of Rehoboth. To determine the extent of impairment, the USGS, in cooperation with the ODNR-MRM, collected water-quality data at 40 sites in the watershed over a 2-year period. This investigation builds on a large body of prior cooperative efforts between USGS and ODNR-MRM to characterize the hydrogeology and water quality in the coal-producing areas of southeaster Ohio.
Eighteen sites were sampled in August 2003, nine on the main stem and nine on tributaries. The streamflows during this sampling were just above median flows. During the 2003 synoptic, the combined metal load at the mouth of the tributary draining the Rehoboth reclamation area was 332 kg/d, which accounts for nearly 50 percent of the total load.
Boron concentrations were determined because boron can be toxic to tolerant vegetation at concentrations over 10 mg/L, and it is contained in the flue-gas desulfurization (FGD) by-product used during the reclamation in the Rehoboth area. Site 1003 had the highest boron concentration of the tributaries to Rush Creek (0.103 mg/L in Aug. 2003), and a site within the Rehoboth reclamation area showed boron concentrations as high as 1.160 mg/L, with a median concentration of 0.178 mg/L. A small spike in the boron concentration along the main stem was attributed to wastewater-treatment-plant discharge to Rush Creek during the low-flow sampling in 2004.
During summer 2003, a biodiversity study involving fish, macroinvertebrates, and habitat was conducted at 18 sites. Fish and macroinvertebrate communities and stream habitat failed to attain Warmwater habitat criteria at all of the water-quality sites on Rush Creek, which explains why the upper reaches of Rush Creek and its tributaries are designated Limited resource water-Acid mine drainage by the Ohio EPA. Although the biodiversity study determined that most of the main stem of Rush Creek within this study area is currently uninhabitable by most intolerant species of macroinvertebrates and fish, the quality and quantity of biota collected by the USGS in 2003 showed improvement when compared to similar studies conducted by the Ohio EPA in 1982 and 1990.
The streamflow and water-quality data for the samples collected in 2003 were used to compare the combined metal loads of iron, aluminum, and manganese (total metal load) to the sulfate and net alkalinity loads and biological indices where available. This assessment showed that the tributary at site 1003 accounted for nearly half the dissolved metal load in the watershed and that the top three tributaries combined with the headwater site contributed 94 percent of the dissolved metal load to Rush Creek.
The low-flow conditions observed during the 2004 synoptic were targeted to determine maximum constituent concentrations, which generally occur during low flow. For the 18 sampling sites that were sampled in 2003 and 2004, the median pH dropped from 4.2 to 3.5, and the net alkalinity load became more acidic (median net alkalinity in 2003 of -500 kg/d and -1,000 kg/d in 2004).
The tributary watershed above site 1003 and Turkey Run subwatershed (site 1011) were studied in more detail because of their contribution to the AMD problem within the Rush Creek watershed.
The area near Rehoboth is the site of an abandoned mine reclamation project; this detailed study was designed to determine the quality of water entering the reclamation site and sources of AMD from within the site. Similar to the Rush Creek tributaries, the streamflow and water-quality data from sites sampled during the detailed study were used to compare the total metal load to the sulfate and net alkalinity loads. The outfall of the drainage tiles under pond 5 in the Rehoboth reclamation area accounted for more than 50 percent of the combined metal load in the creek. Because of the low flow of the seeps and the large head difference between the surface water and the ground water at the ponds, the contribution of the seeps to the overall AMD load is probably minimal compared to the ground-water flow into the creek. To help understand the process, a more detailed study of the quantity and quality of the ground-water flow in and around the reclamation site would be required. That study would need to include recharge to the gob pile and inflow into the ponds from ground water.
Because of frozen ground and snowmelt during sampling in the Turkey Run subwatershed, the results of the water-quality analyses were questionable, and resampling at those sites during better weather conditions may produce substantially different results.
The authors would like to thank Bill Jonard, Ohio Department of Natural Resources Division of Mineral Resources Management, for his technical expertise and extensive knowledge of the entire watershed and taking the time to share that knowledge. We would also like to thank all the landowners who granted access to sites on their land.
Ayers, R.S., and Westcot, D.W., 1994, Water quality for agriculture: Rome, Food and Agriculture Organization of the United Nations Irrigation and Drainage Paper 29, Rev. 1, section 4.2, accessed December 6, 2004, at http://www.fao.org/DOCREP/003/T0234E/T0234E00.htm
Barbour, M.T., Gerritsen, J., Snyder, B.D., and Stribling, J.B., 1999, Rapid bioassessment protocols for use in streams and wadable rivers—Periphyton, benthic macroinvertebrates, and fish (2d ed.): Washington, D.C., U.S. Environmental Protection Agency, Office of Water, EPA 841–B–99–002 [variously paginated].
Bennett & Williams Environmental Consultants Inc., 1995, Preliminary design report for the Rehoboth Reclamation Project: Draft report, 76 p.
Botoman, George, and Stith, D.A., 1978, Analyses of Ohio coals: Ohio Department of Natural Resources Information Circular 47, 148 p.
Childress, C.J., 1985, Classification of stream basins in southeastern Ohio according to extent of surface coal mining: U.S. Geological Survey Water-Resources Investigations Report 84–4212, 83 p.
Cunningham, W.L., and Jones, R.L., 1990, Long-term effects of surface coal mining on ground-water levels and quality in two small watersheds in Eastern Ohio: U.S. Geological Survey Water-Resources Investigations Report 90–4136, 74 p.
DeShon, J.E., 1995, Development and application of the Invertebrate Community Index (ICI), in Davis, W.S., and Simon, T., Biological assessment and criteria—Tools for water resource planning and decision making: Boca Raton, Fla., Lewis Publishers, p. 217–243.
Fausch, K.D., Karr, J.R., and Yant, P.R., 1984, Regional application of an index of biotic integrity based on stream fish communities: Transactions of the American Fisheries Society, v. 113, p. 39-55.
Fenneman, N.M., and Johnson, D.W., 1946, Map of physical divisions of the United States: U.S. Geological Survey, Physiographic Committee, scale 1:7,000,000.
Flint, N.K., 1951, Geology of Perry County: Columbus, Ohio Department of Natural Resources, Division of Geological Survey, Bulletin 48, fourth series, 234 p.
Gammon, J.R., 1976, The fish populations of the middle 340 km of the Wabash River: Purdue University Water Resources Center Technical Report 86, 73 p.
Gammon, J.R., Spacie, A., Hamelink, J.L., and Kaeser, R.L., 1981, Role of electrofishing in assessing environmental quality of the Wabash River in Bates, J.M., and Weber, C.I., Effluent impacts on communities of indigenous aquatic organisms—ASTM STP 730: Philadelphia, American Society for Testing and Materials, p. 307–324.
Haefner, R.J., and Rowe, G.L., 1997, Water quality at an abandoned Ohio coal mine reclaimed with dry flue-gas desulfurization byproducts: U.S. Department of Energy, National Energy Technology Laboratory, accessed April 5, 2005, at http://www.netl.doe.gov/publications/proceedings/97/97ps/ps_pdf/PS3B-5.PDF
Harstine, L.J., 1991, Hydrologic atlas for Ohio—Average annual precipitation, temperature, streamflow, and water loss for 50 year period, 1931–1980: Ohio Department of Natural Resources, Division of Water, Water Inventory Report 28, accessed August 4, 2004, at http://www.dnr.state.oh.us/water/pubs/hydatlas/atlaspl1.htm
Hester, F.E., and Dendy, J.S., 1962, A multiple-plate sampler for aquatic macroinvertebrates: Transactions of the American Fisheries Society, v. 91, p. 420–421.
Hupe, D.W., and Dziubek, J.A., 1984, Monitoring the fixed FGD sludge landfill—Conesville, Ohio: CS-3702 Research Project 1406-2, prepared for Electric Power Research Institute, Palo Alto, Calif. [variously paginated].
Jones, A.L., 1988, Geologic setting and water quality of selected basins in the active coal-mining areas of Ohio, June 1985 through December 1986: U.S. Geological Survey Water-Resources Investigations Report 88–4084, 85 p.
Karr, J.R., 1981, Assessment of biotic integrity using fish communities: Fisheries, v. 6, p. 21–27.
Karr, J.R., Fausch, K.D., Angermeier, P.L., Yant, P.R., and Schlosser, I.J., 1986, Assessing biological integrity in running waters—A method and its rationale: Illinois Natural History Survey Special Publication 5, 28 p.
Lenat, D.R., 1988, Water quality assessment of streams using a qualitative collection method for benthic macroinvertebrates: Journal of the North American Benthological Society, v. 7, p. 222–233.
McCament, B., Bowman, J., Tremper, K., Riley, T., 2003, Acid mine drainage abatement and treatment (AMDAT) plan for the Sunday Creek watershed: Accessed on December 27, 2004, at http://www.sundaycreek.org/documents/SundayCreekAMDAT2003.pdf
Nichols, V.E., 1985, Evaluation of the effects of coal-mine reclamation on water quality in Big Four Hollow near Lake Hope, southeastern Ohio: U.S. Geological Survey Water-Resources Investigations Report 85–4197, 215 p.
Ohio Environmental Protection Agency, 1987a, Biological criteria for the protection of aquatic life; Volume I—The role of biological data in water quality assessment: Division of Surface Water Quality Monitoring and Assessment, Surface Water Section, 44 p.
Ohio Environmental Protection Agency, 1987b, Biological criteria for the protection of aquatic life; Volume II—Users manual for biological field assessment of Ohio surface waters: Division of Surface Water Quality Monitoring and Assessment, Surface Water Section [variously paginated].
Ohio Environmental Protection Agency, 1989a, Addendum to biological criteria for the protection of aquatic life; Volume II—Users manual for biological field assessment of Ohio surface waters: Division of Surface Water Quality Monitoring and Assessment, Surface Water, 21 p.
Ohio Environmental Protection Agency, 1989b, Biological criteria for the protection of aquatic life; Volume III—Standardized biological field sampling and laboratory methods for assessing fish and macroinvertebrate communities: Division of Surface Water Quality Monitoring and Assessment, Surface Water Section [variously paginated].
Ohio Environmental Protection Agency, 1997, Biological and water quality study of the Raccoon Creek Basin (1995) —Athens, Gallia, Hocking, Jackson, Meigs, and Vinton Counties: Division of Surface Water Quality Monitoring and Assessment, Surface Water Section, 156 p.
Ohio Environmental Protection Agency, 2002a, Water use designations and statewide criteria—Ohio Administrative Code 3745-1-07, Water Quality Standards: Division of Surface Water Quality Monitoring and Assessment, Surface Water Section on accessed July 7, 2004, at http://www.epa.gov/waterscience/standards/wqslibrary/oh/oh.html
Ohio Environmental Protection Agency, 2002b, Water body use designations; Hocking River Drainage Basin—Ohio Administrative Code 3745-1-08, Water Quality Standards: Division of Surface Water Quality Monitoring and Assessment, Surface Water Section, accessed October 29, 2003, at http://www.epa.gov/waterscience/standards/wqslibrary/oh/oh.html, p. 8-9.
Ohio Environmental Protection Agency, 2002c, Ohio Environmental Protection Agency data accessed March 14, 2005, at http://www.epa.state.oh.us/ddagw/Documents/StandardsList.pdf
Pavey, R.R., Goldthwait, R.P., Brockman, C.S., Hull, D.N., Swinford, E.M., and Van Horn, R.G., 1999, Quaternary geology of Ohio: Ohio Division of Geological Survey Map M-2, 1:500,000-scale map and 1:250,000-scale GIS files.
Rankin, E.T., 1989, The qualitative habitat evaluation index (QHEI)—Rationale, methods, and application: Ohio Environmental Protection Agency, Division of Surface Water Quality Monitoring and Assessment, Surface Water Section, 54 p., 2 app.
Rankin, E.T., 1995, Habitat indices in water resource quality assessments in Davis, W.S., and Simon, T., Biological assessment and criteria—Tools for water resource planning and decision making: Boca Raton, Fla., Lewis Publishers, p. 181–208.
Rantz, S.E., and others, 1982, Measurement and computation of streamflow—Volume 1, Measurement of stage and streamflow: U.S. Geological Survey Water-Supply Paper 2175, 284 p.
Razem, A.C., and Sedam, A.C., 1985, Ground-water quality and geochemistry of aquifers associated with coal in the Allegheny and Monongahela Formations, southeastern Ohio: U.S. Geological Survey Water-Resources Investigations Report 85–4034, 39 p.
Rounds, S.A., and Wilde, F.D., eds., September 2001, Alkalinity and acid neutralizing capacity (2d ed.): U.S. Geological Survey Techniques of Water-Resources Investigations, book 9, chap. A6., section 6.6, accessed December 29, 2004, at https://pubs.water.usgs.gov/twri9A6/
Rubel, Neil, and Jenny, P.C., 1988: Soil survey of Perry County, Ohio: U.S. Department of Agriculture, Soil Conservation Service, 187 p.
Sedam, A.C., 1991, Geologic setting and water quality of selected basins in the active coal-mining areas of Ohio, 1987–88: U.S. Geological Survey Water-Resources Investigations Report 90–4109, 97 p.
Shindel, H.S., Mangus, J.P., and Frum, S.R., 2004, Water resources data, Ohio, water year 2003: U.S. Geological Survey Water-Data Report OH–03–2, p. 272–277.
Shindel, H.S., Mangus, J.P., and Frum, S.R., 2005, Water resources data, Ohio, water year 2004: U.S. Geological Survey Water-Data Report OH–04–2, p. 296–301.
Straub, D.E., 2001, Low-flow characteristics of streams in Ohio through water year 1997: U.S. Geological Survey Water-Resources Investigations Report 01–4140, p. 180 and 184.
U.S. Geological Survey, 2000, Ohio land cover data set; U.S. Geological Survey, Sioux Falls, S.D., accessed July 7, 2004, at http://edcwww.cr.usgs.gov/
Westover, Susan, and Eberle, Michael, 1987, Overview of surface-water quality in Ohio's coal region: U.S. Geological Survey Water-Resources Investigations Report 84–4061, 32 p.
Wilde, F.D., and Radtke, D.B., eds., chapter sections variously dated, Field measurements: U.S. Geological Survey Techniques of Water-Resources Investigations, book 9, chap. A6, accessed December 29, 2004, at https://pubs.water.usgs.gov/twri9A6/
Wilde, F.D., Radtke, D.B., Gibs, Jacob, and Iwatsubo, R.T., eds., 1999, Collection of water samples: U.S. Geological Survey Techniques of Water-Resources Investigations, book 9, chap. A4, accessed December 29, 2004, at https://pubs.water.usgs.gov/twri9A4/
Wilson, K.S., 1985, Surface-water quality of coal-mine lands in Raccoon Creek Basin, Ohio: U.S. Geological Survey Water-Resources Investigations Report 85–4060, 80 p.
Wilson, K.S., 1988, Chemical quality, benthic organisms, and sedimentation in stream draining coal-mined lands in Raccoon Creek basin, Ohio, July 1984 through September 1986: U.S. Geological Survey Water-Resources Investigations Report 88–4022, 80 p.
[ft 3 /s, cubic feet per second; mi 2 , square miles; mg/L, milligrams per liter; --, not determined; deg. C, degrees Celsius]
| Site | Station number | Date | Time | Flow (ft 3 /s) | Drainage area (mi 2 ) | Dissolved oxygen (mg/L) | Water Temperature (deg. C) | Calcium, dissolved (mg/L) | Magnesium, dissolved (mg/L) |
|---|---|---|---|---|---|---|---|---|---|
| 1000 | 394307082175400 | 08/06/03 | 1000 | 10 | 35.3 | 8.0 | 19.1 | 88.5 | 52.5 |
| 1000 | 394307082175400 | 08/17/04 | 1145 | 5.5 | 35.3 | 8.5 | 16.9 | 120 | 73.3 |
| 1001 | 394317082164300 | 08/06/03 | 0910 | 8.3 | 28.1 | 10.2 | 19.2 | 97.6 | 54.1 |
| 1001 | 394317082164300 | 09/24/03 | 1045 | 37 | 28.1 | 9.5 | 14.4 | 55.0 | 28.6 |
| 1001 | 394317082164300 | 10/21/03 | 1050 | 11 | 28.1 | 8.9 | 13.3 | 81.2 | 48.1 |
| 1001 | 394317082164300 | 12/16/03 | 1000 | 29 | 28.1 | 12.9 | 1.9 | 53.2 | 30.2 |
| 1001 | 394317082164300 | 03/10/04 | 1100 | 29 | 28.1 | 12.1 | 3.7 | 59.0 | 37.8 |
| 1001 | 394317082164300 | 08/17/04 | 1250 | 4.1 | 28.1 | 8.4 | 17.9 | 128 | 78.8 |
| 1002 | 394344082152200 | 08/05/03 | 1530 | .23 | 1.7 | 7.5 | 19.4 | 49.8 | 23.3 |
| 1002 | 394344082152200 | 08/17/04 | 1355 | .07 | 1.7 | 8.6 | 18.7 | 78.1 | 37.3 |
| 1003 | 394339082111500 | 07/15/03 | 1330 | 2.0 | 3.9 | 7.9 | 28.4 | 127 | 79.8 |
| 1003 | 394339082111500 | 08/05/03 | 0945 | 2.2 | 3.9 | 7.1 | 23.3 | 137 | 85.7 |
| 1003 | 394339082111500 | 09/10/03 | 0900 | 2.2 | 3.9 | 8.0 | 23.7 | 124 | 73.6 |
| 1003 | 394339082111500 | 08/18/04 | 1250 | 1.2 | 3.9 | 7.6 | 25.0 | 182 | 127 |
| 1006 | 394324082102900 | 08/05/03 | 1015 | 1.4 | 2.6 | 8.6 | 20.0 | 179 | 101 |
| 1006 | 394324082102900 | 08/18/04 | 1130 | .49 | 2.6 | 8.4 | 17.8 | 279 | 217 |
| 1007 | 394323082200000 | 08/06/03 | 1210 | 10 | 39.5 | 9.3 | 20.1 | 95.8 | 51.1 |
| 1007 | 394323082200000 | 09/24/03 | 0850 | 52 | 39.5 | 9.0 | 14.4 | 52.2 | 25.6 |
| 1007 | 394323082200000 | 10/21/03 | 0850 | 16 | 39.5 | 9.0 | 12.7 | 71.9 | 41.0 |
| 1007 | 394323082200000 | 03/10/04 | 1140 | 40 | 39.5 | 12 | 3.8 | 53.3 | 32.3 |
| 1007 | 394323082200000 | 08/17/04 | 1100 | 6.0 | 39.5 | 8.8 | 16.4 | 118 | 69.2 |
| 1009 | 03156549 | 08/06/03 | 1240 | 6.2 | 24.9 | 7.7 | 21.1 | 35.7 | 13.7 |
| 1009 | 03156549 | 08/17/04 | 0905 | 2.0 | 24.9 | 7.3 | 15.8 | 38.1 | 13.3 |
| 1011 | 394214082160900 | 08/06/03 | 0900 | 1.4 | 4.7 | 8.1 | 18.9 | 77.8 | 41.3 |
| 1011 | 394214082160900 | 12/16/03 | 1055 | 5.3 | 4.7 | 12.4 | 2.2 | 48.5 | 26.0 |
| 1011 | 394214082160900 | 08/17/04 | 1235 | .93 | 4.7 | 8.8 | 18.4 | 94.5 | 52.9 |
| 1012 | 394302082125500 | 08/05/03 | 1115 | 1.2 | 2.4 | 8.8 | 19.1 | 64.5 | 38.7 |
| 1012 | 394302082125500 | 08/18/04 | 1210 | .77 | 2.4 | 11.2 | 17.7 | 91.5 | 67.4 |
| 1014 | 394305082130000 | 08/05/03 | 1300 | 5.5 | 12.2 | 8.6 | 20.8 | 122 | 70.1 |
| 1014 | 394305082130000 | 08/18/04 | 0910 | 2.7 | 12.2 | 8.3 | 17.6 | 177 | 131 |
| 1015 | 394312082132800 | 08/05/03 | 1245 | 7.1 | 16.8 | 9.1 | 20.7 | 108 | 60.6 |
| 1015 | 394312082132800 | 08/17/04 | 1515 | 3.4 | 16.8 | 8.8 | 19.0 | 157 | 112 |
| 1017 | 394313082130600 | 08/05/03 | 1400 | .94 | 4.7 | 9.5 | 19.8 | 54.6 | 24.7 |
| 1017 | 394313082130600 | 08/18/04 | 1031 | .65 | 4.7 | 9.5 | 17.4 | 49.5 | 24.9 |
| 1018 | 394306082121900 | 08/05/03 | 1130 | 4.0 | 9.4 | 7.7 | 21.4 | 148 | 87.7 |
| 1018 | 394306082121900 | 09/24/03 | 1235 | 10 | 9.4 | 9.0 | 15.8 | 89.9 | 53.1 |
| 1018 | 394306082121900 | 10/21/03 | 1330 | 4.4 | 9.4 | 8.5 | 14.6 | 123 | 78.6 |
| 1018 | 394306082121900 | 12/16/03 | 0850 | 8.2 | 9.4 | 12.5 | 1.4 | 93.7 | 60.7 |
| 1018 | 394306082121900 | 03/10/04 | 1000 | 9.0 | 9.4 | 12.3 | 2.8 | 107 | 73.5 |
| 1018 | 394306082121900 | 08/18/04 | 1015 | 2.4 | 9.4 | 7.8 | 18.6 | 199 | 144 |
| 1023 | 394316082200000 | 08/06/03 | 1200 | 1.1 | 5.2 | 7.4 | 21.4 | 38.7 | 19.6 |
| 1023 | 394316082200000 | 08/17/04 | 1015 | .13 | 5.2 | 8.2 | 15.8 | 42.7 | 22.3 |
| 1024 | 394324082202400 | 08/06/03 | 1250 | 12 | 45.3 | 9.2 | 20.4 | 79.2 | 46.0 |
| 1024 | 394324082202400 | 08/17/04 | 0915 | 6.5 | 45.3 | 8.3 | 15.8 | 114 | 67.0 |
| 1025 | 394341082184300 | 08/06/03 | 1010 | .36 | 2.1 | 9.8 | 19.4 | 37.9 | 13.0 |
| 1025 | 394341082184300 | 08/17/04 | 1055 | .10 | 2.1 | 7.2 | 16.9 | 42.4 | 14.9 |
| 1026 | 394327082143800 | 08/05/03 | 1500 | 9.1 | 23.0 | 9.3 | 20.8 | 87.3 | 48.0 |
| 1026 | 394327082143800 | 08/17/04 | 1410 | 4.9 | 23.0 | 8.7 | 18.6 | 127 | 80.2 |
| 1027 | 394314082140900 | 08/05/03 | 1415 | 1.2 | 3.8 | 8.2 | 20.0 | 38.4 | 21.1 |
| 1027 | 394314082140900 | 08/18/04 | 0905 | .34 | 3.8 | 6.8 | 16.4 | 51.8 | 32.0 |
| 1050 | 394304082114600 | 03/10/04 | 1040 | .43 | -- | 10.5 | 3.0 | 107 | 80.6 |
| 1050 | 394304082114600 | 08/18/04 | 1310 | .22 | -- | 8.9 | 19.3 | 203 | 155 |
| 1051 | 394322082141100 | 08/18/04 | 1400 | .67 | -- | 4.1 | 20.3 | 31.8 | 12.2 |
| 3000 | 394404082111400 | 08/26/03 | 1000 | .04 | -- | 5.5 | 26.0 | 473 | 235 |
| 3001 | 394359082111200 | 08/26/03 | 1102 | .02 | -- | 5.6 | 25.9 | 329 | 180 |
| 3002 | 394416082112600 | 08/27/03 | 0930 | .004a | -- | 1.2 | 20.1 | 472 | 228 |
| 3003 | 394418082112700 | 08/27/03 | 1035 | .002a | -- | 8.2 | 27.8 | 443 | 235 |
| 3004 | 394425082112300 | 08/27/03 | 1130 | .07 | -- | 2.2 | 15.5 | 443 | 167 |
| 3005 | 394426082112200 | 08/27/03 | 1205 | .004a | -- | 3.9 | 25.9 | 414 | 49.3 |
| 3006 | 394441082111800 | 08/27/03 | 1240 | .07 | -- | 7.1 | 24.0 | 132 | 82.0 |
| 3007 | 394409082112500 | 08/29/03 | 0930 | .003a | -- | 6.0 | 22.3 | 493 | 239 |
| 3008 | 394351082110800 | 08/29/03 | 1020 | .04 | -- | 6.4 | 22.1 | 160 | 97.0 |
| 3009 | 394440082112300 | 09/09/03 | 1030 | .61 | -- | -- | 20.6 | 103 | 61.9 |
| 3010 | 394426082113600 | 09/09/03 | 1115 | 1.1 | 1.6 | -- | 19.7 | 105 | 75.3 |
| 3011 | 394412082112800 | 09/09/03 | 1210 | .72 | -- | -- | 24.1 | 141 | 65.5 |
| 3012 | 394407082112000 | 09/10/03 | 1040 | 1.5 | -- | 8.1 | 23.3 | 128 | 75.4 |
| 5000 | 394115082154700 | 12/17/03 | 1250 | .8 | -- | 14.4 | 2.1 | 68.7 | 46.0 |
| 5001 | 394207082155100 | 12/16/03 | 1245 | .32 | -- | 11.7 | 3.8 | 50.4 | 43.8 |
| 5002 | 394211082152600 | 12/17/03 | 1200 | 1.2 | -- | 12.5 | 3.7 | 16.6 | 6.94 |
| 5003 | 394030082135900 | 12/17/03 | 0830 | 1.7 | -- | 12.3 | 3.9 | 73.5 | 31.0 |
| 5004 | 394051082142800 | 12/17/03 | 0920 | 4.5 | -- | 13.6 | 3.3 | 57.9 | 25.8 |
| 5005 | 394205082152600 | 12/17/03 | 1125 | 19 | -- | 13.1 | 2.4 | 39.1 | 19.2 |
| 5006 | 394209082154200 | 12/16/03 | 1150 | 4.7 | -- | 12.7 | 2.2 | 49.9 | 25.5 |
| 5007 | 394121082145400 | 12/17/03 | 1030 | 6.5 | -- | 13.3 | 2.9 | 49.1 | 22.1 |
Table 1–1. Chemical characteristics of water-quality samples collected in the Rush Creek watershed, Perry County, Ohio, 2003 and 2004.—Continued
[mg/L, milligrams per liter; CaCO 3 , calcium carbonate; --, not determined; E, estimated; <, less than]
| Site | Potassium, dissolved (mg/L) | Sodium, dissolved (mg/L) | Acidity (mg/L as CaCO 3 ) | Alkalinity (mg/L as CaCO 3 ) | Bicarbonate mg/L as CaCO 3 ) | Bromide, dissolved (mg/L) | Chloride, dissolved (mg/L) | Fluoride, dissolved (mg/L) | Silica, dissolved (mg/L) | Sulfate, dissolved (mg/L) |
|---|---|---|---|---|---|---|---|---|---|---|
| 1000 | 4.69 | 32.1 | 52 | -- | -- | 0.18 | 43.5 | 0.6 | 18.4 | 526 |
| 1000 | 6.01 | 36.2 | 123 | -- | -- | .17 | 44.7 | .9 | 23.1 | 725 |
| 1001 | 5.11 | 33.5 | 81 | -- | -- | .14 | 41.4 | .6 | 20.9 | 577 |
| 1001 | 3.77 | 17.5 | 4 | 3 | 4 | .13 | 29.4 | .3 | 14.4 | 268 |
| 1001 | 4.81 | 23.5 | 55 | -- | -- | .14 | 37.1 | .5 | 18.0 | 522 |
| 1001 | 2.63 | 18.1 | 14 | 3 | 4 | .17 | 31.7 | .3 | 13.9 | 283 |
| 1001 | 2.58 | 16.1 | 52 | -- | -- | .15 | 27.6 | .4 | 15.3 | 469 |
| 1001 | 5.70 | 35.3 | 167 | -- | -- | .14 | 42.1 | .9 | 24.6 | 821 |
| 1002 | 2.52 | 11.6 | -- | 48 | 59 | .06 | 20.3 | .2 | 11.5 | 173 |
| 1002 | 3.21 | 14.7 | -- | 53 | 64 | .09 | 21.1 | .2 | 8.59 | 284 |
| 1003 | 1.72 | 12.6 | 276 | -- | -- | .27 | 26.9 | .8 | 21.2 | 1,060 |
| 1003 | 5.88 | 14.2 | 311 | -- | -- | .40 | 28.8 | .8 | 24.2 | 1,190 |
| 1003 | 5.68 | 12.0 | 272 | -- | -- | .30 | 22.8 | .9 | 21.5 | 1,340 |
| 1003 | 7.27 | 14.9 | 504 | -- | -- | .46 | 22.8 | 1.3 | 32.1 | 1,490 |
| 1006 | 6.43 | 68.5 | 50 | -- | -- | .13 | 20.5 | .5 | 13.9 | 1,180 |
| 1006 | 7.73 | 42.9 | 302 | -- | -- | .19 | 21.2 | 1.0 | 28.6 | 1,880 |
| 1007 | 5.12 | 33.9 | 38 | -- | -- | .16 | 43.8 | .6 | 20.6 | 494 |
| 1007 | 3.91 | 16.6 | -- | E8 | E10 | .11 | 30.0 | .2 | 13.9 | 215 |
| 1007 | 4.67 | 23.8 | 14 | 3 | 4 | .17 | 38.8 | .5 | 16.1 | 367 |
| 1007 | 2.48 | 15.2 | 31 | 2 | 3 | .14 | 26.5 | .4 | 14.3 | 409 |
| 1007 | 6.23 | 34.2 | 104 | -- | -- | .17 | 46.8 | .9 | 22.2 | 686 |
| 1009 | 3.13 | 15.5 | -- | 86 | 104 | .07 | 34.2 | .2 | 5.00 | 46.4 |
| 1009 | 3.62 | 16.7 | -- | 103 | 126 | .09 | 31.8 | .2 | 4.56 | 39.8 |
| 1011 | 3.46 | 15.2 | 16 | 1 | 2 | .27 | 32.9 | .5 | 15.9 | 405 |
| 1011 | 2.18 | 9.7 | 2 | 5 | 6 | .17 | 19.2 | .2 | 14.3 | 226 |
| 1011 | 2.44 | 14.5 | 33 | 2 | 4 | .18 | 27.1 | .6 | 18.8 | 478 |
| 1012 | 3.25 | 22.4 | 114 | -- | -- | .21 | 49.6 | .8 | 26.4 | 492 |
| 1012 | 4.33 | 20.3 | 250 | -- | -- | .19 | 37.2 | 1.4 | 38.7 | 765 |
| 1014 | 5.22 | 30.5 | 183 | -- | -- | .22 | 35.7 | .7 | 23.4 | 949 |
| 1014 | 6.63 | 25.0 | 360 | -- | -- | .26 | 30.1 | 1.2 | 34.8 | 1,360 |
| 1015 | 4.80 | 28.9 | 153 | -- | -- | .16 | 35.3 | .6 | 21.3 | 834 |
| 1015 | 4.76 | 22.3 | 276 | -- | -- | .17 | 31.7 | 1.1 | 29.6 | 1,080 |
| 1017 | 2.91 | 25.6 | -- | 74 | 90 | .13 | 46.5 | .3 | 10.8 | 158 |
| 1017 | 3.36 | 16.5 | -- | 68 | 82 | .07 | 22.9 | .3 | 8.80 | 130 |
| 1018 | 6.27 | 30.2 | 226 | -- | -- | .24 | 26.1 | .7 | 25.3 | 1,050 |
| 1018 | 4.84 | 13.4 | 69 | -- | -- | .11 | 20.8 | .6 | 17.4 | 737 |
| 1018 | 5.80 | 18.0 | 207 | -- | -- | .20 | 25.9 | .7 | 20.3 | 1,030 |
| 1018 | 3.55 | 13.0 | 141 | -- | -- | .17 | 22.8 | .6 | 18.2 | 749 |
| 1018 | 3.53 | 13.7 | 208 | -- | -- | .17 | 18.0 | .7 | 19.9 | 1,040 |
| 1018 | 6.85 | 22.5 | 390 | -- | -- | .41 | 24.9 | 1.1 | 31.8 | 1,530 |
| 1023 | 2.96 | 13.5 | -- | 65 | 79 | 0.05 | 26.6 | 0.2 | 6.78 | 103 |
| 1023 | 2.73 | 12.5 | -- | 70 | 86 | .08 | 26.1 | .2 | 3.54 | 108 |
| 1024 | 4.49 | 30.0 | 23 | -- | -- | .16 | 43.1 | .6 | 16.1 | 437 |
| 1024 | 5.15 | 33.2 | 111 | -- | -- | .20 | 45.6 | .8 | 21.4 | 671 |
| 1025 | 2.75 | 14.9 | -- | 72 | 88 | .10 | 32.4 | <.2 | 9.26 | 48 |
| 1025 | 2.91 | 16.8 | -- | 99 | 120 | .09 | 34.3 | <.2 | 7.64 | 61 |
| 1026 | 4.82 | 34.9 | 73 | -- | -- | .14 | 42.8 | .6 | 18.2 | 584 |
| 1026 | 5.77 | 38.9 | 183 | -- | -- | .13 | 43.3 | 1.0 | 24.9 | 837 |
| 1027 | 2.55 | 10.8 | -- | 48 | 58 | .04 | 20.2 | .3 | 11.8 | 132 |
| 1027 | 2.76 | 11.2 | -- | E29 | E35 | .07 | 16.0 | .3 | 12.1 | 194 |
| 1050 | 3.08 | 15.8 | 234 | -- | -- | .23 | 27.5 | .8 | 25.4 | 1,070 |
| 1050 | 5.30 | 17.8 | 528 | -- | -- | 2.68 | 30.8 | 1.4 | 42.7 | 2,000 |
| 1051 | 12.1 | 116 | -- | 118 | 143 | .04 | 102 | .8 | 10.6 | 114 |
| 3000 | 14.1 | 21.1 | 1,850 | -- | 10.7 | 27.9 | 1.9 | 45.6 | 4,660 | |
| 3001 | 10.0 | 21.8 | 610 | -- | -- | 3.02 | 31.8 | .8 | 31.0 | 2,380 |
| 3002 | 34.0 | 17.5 | 6,910 | -- | -- | 35.6 | 24.1 | 1.4 | 57.7 | 10,100 |
| 3003 | 62.2 | 20.5 | 9,830 | -- | -- | 110 | 34.8 | 2.9 | 43.8 | 13,200 |
| 3004 | 66.5 | 37.8 | 4,560 | -- | -- | 11.4 | 71.9 | <.8 | 84.1 | 6,780 |
| 3005 | 3.35 | 2.75 | 1,070 | -- | -- | 1.05 | 12.8 | 1.2 | 28.0 | 2,710 |
| 3006 | 5.72 | 7.60 | 282 | -- | -- | .31 | 9.40 | .9 | 38.8 | 1,150 |
| 3007 | 11.7 | 25.9 | 490 | -- | -- | 3.14 | 21.9 | .4 | 39.1 | 2,840 |
| 3008 | 10.2 | 9.69 | 246 | -- | -- | .38 | 13.9 | .6 | 24.8 | 1,170 |
| 3009 | 4.50 | 13.1 | 46 | -- | -- | .07 | 21.0 | .6 | 19.5 | 636 |
| 3010 | 3.98 | 10.2 | 146 | -- | -- | .13 | 16.7 | 1.2 | 23.4 | 902 |
| 3011 | 6.88 | 12.4 | 449 | -- | -- | .57 | 23.6 | .6 | 21.8 | 1,230 |
| 3012 | 5.51 | 12.6 | 298 | -- | -- | .26 | 22.9 | .9 | 23.1 | 1,100 |
| 5000 | 3.70 | 9.56 | 86 | -- | -- | .27 | 29.4 | .8 | 16.4 | 572 |
| 5001 | 1.43 | 8.94 | 262 | -- | -- | .23 | 27.8 | .9 | 18.9 | 805 |
| 5002 | 1.64 | 6.32 | -- | 28 | 35 | .06 | 11.0 | <.2 | 13.3 | 36.9 |
| 5003 | 3.13 | 13.6 | -- | 90 | 110 | .04 | 20.7 | .2 | 9.95 | 199 |
| 5004 | 2.70 | 9.87 | -- | 34 | 41 | .36 | 13.1 | .2 | 14.4 | 213 |
| 5005 | 2.67 | 7.81 | -- | 21 | 25 | .09 | 15.0 | .2 | 11.0 | 147 |
| 5006 | 2.36 | 9.93 | -- | 15 | 18 | .19 | 18.8 | .2 | 13.9 | 207 |
| 5007 | 2.51 | 8.64 | -- | 30 | 36 | .19 | 13.3 | .2 | 12.9 | 179 |
Table 1–1. Chemical characteristics of water-quality samples collected in the Rush Creek watershed, Perry County, Ohio, 2003 and 2004.—Continued
[mg/L, milligrams per liter; µg/L, micrograms per liter; --, not determined; E, estimated; <, less than]
| Site | Aluminum, dissolved (mg/L) | Aluminum, total (mg/L) | Arsenic, dissolved (µg/L) | Boron, dissolved (mg/L) | Cadmium, dissolved (µg/L) | Chromium, dissolved (µg/L) | Cobalt, dissolved (µg/L) | Copper, dissolved (µg/L) | Iron, dissolved (mg/L) | Iron, total (mg/L) |
|---|---|---|---|---|---|---|---|---|---|---|
| 1000 | 5.80 | -- | -- | 0.101 | -- | -- | -- | -- | 0.974 | -- |
| 1000 | 11.0 | -- | -- | .147 | -- | -- | -- | -- | 5.16 | -- |
| 1001 | 8.19 | 7.40 | <2 | .122 | <2 | E4 | 85 | <7 | 1.70 | 3.11 |
| 1001 | .380 | -- | -- | .070 | -- | -- | -- | -- | .466 | -- |
| 1001 | 6.52 | -- | -- | .079 | -- | -- | -- | -- | .957 | -- |
| 1001 | .720 | 3.26 | <2 | .047 | <3 | 6 | 43 | <5 | 4.35 | 7.15 |
| 1001 | 5.77 | -- | -- | .044 | -- | -- | -- | -- | 5.04 | -- |
| 1001 | 13.1 | -- | -- | .112 | -- | -- | -- | -- | 10.1 | -- |
| 1002 | .003 | -- | -- | .043 | -- | -- | -- | -- | .012 | -- |
| 1002 | .002 | -- | -- | .045 | -- | -- | -- | -- | <.006 | -- |
| 1003 | 13.2 | -- | -- | .088 | -- | -- | -- | -- | 20.7 | -- |
| 1003 | 15.6 | -- | -- | .103 | -- | -- | -- | -- | 31.7 | -- |
| 1003 | 14.4 | 13.0 | E2 | .094 | <2 | 6 | 128 | <7 | 27.1 | 25.7 |
| 1003 | 24.8 | -- | -- | .135 | -- | -- | -- | -- | 47.3 | -- |
| 1006 | 2.55 | -- | -- | .152 | -- | -- | -- | -- | 7.68 | -- |
| 1006 | 7.04 | -- | -- | .082 | -- | -- | -- | -- | 90.8 | -- |
| 1007 | 6.09 | 5.28 | <2 | .115 | <2 | E4 | 75 | <7 | .240 | .510 |
| 1007 | .060 | -- | -- | .067 | -- | -- | -- | -- | .300 | -- |
| 1007 | 2.13 | -- | -- | .075 | -- | -- | -- | -- | .421 | -- |
| 1007 | 3.14 | -- | -- | .042 | -- | -- | -- | -- | 3.11 | -- |
| 1007 | 10.7 | -- | -- | .104 | -- | -- | -- | -- | 2.79 | -- |
| 1009 | .006 | -- | -- | .038 | -- | -- | -- | -- | .011 | -- |
| 1009 | .003 | -- | -- | .050 | -- | -- | -- | -- | .013 | -- |
| 1011 | 1.81 | -- | -- | .063 | -- | -- | -- | -- | .333 | -- |
| 1011 | .380 | 2.22 | <2 | .035 | <3 | 5 | 48 | <5 | .793 | 1.75 |
| 1011 | 3.77 | -- | -- | .070 | -- | -- | -- | -- | .467 | -- |
| 1012 | 23.6 | -- | -- | .074 | -- | -- | -- | -- | 1.92 | -- |
| 1012 | 30.5 | -- | -- | .075 | -- | -- | -- | -- | 2.83 | -- |
| 1014 | 17.8 | -- | -- | .096 | -- | -- | -- | -- | 19.2 | -- |
| 1014 | 21.9 | -- | -- | .102 | -- | -- | -- | -- | 30.0 | -- |
| 1015 | 16.2 | -- | -- | .086 | -- | -- | -- | -- | 16.8 | -- |
| 1015 | 17.5 | -- | -- | .097 | -- | -- | -- | -- | 24.2 | -- |
| 1017 | .026 | -- | -- | .053 | -- | -- | -- | -- | .016 | -- |
| 1017 | .010 | -- | -- | .048 | -- | -- | -- | -- | .008 | -- |
| 1018 | 13.1 | 11.4 | <2 | .107 | <2 | 6 | 155 | <7 | 18.6 | 20.0 |
| 1018 | 8.19 | -- | -- | .076 | -- | -- | -- | -- | 13.5 | -- |
| 1018 | 11.1 | -- | -- | .084 | -- | -- | -- | -- | 23.5 | -- |
| 1018 | 7.76 | 8.27 | 2 | .056 | <3 | 8 | 110 | <5 | 26.7 | 27.1 |
| 1018 | 12.3 | -- | -- | .052 | -- | -- | -- | -- | 35.3 | -- |
| 1018 | 18.1 | -- | -- | .104 | -- | -- | -- | -- | 38.8 | -- |
| 1023 | 0.004 | -- | -- | 0.038 | -- | -- | -- | -- | E.008 | -- |
| 1023 | .004 | -- | -- | .040 | -- | -- | -- | -- | E.006 | -- |
| 1024 | 3.26 | -- | -- | .090 | -- | -- | -- | -- | .196 | -- |
| 1024 | 10.2 | -- | -- | .101 | -- | -- | -- | -- | 2.31 | -- |
| 1025 | .004 | -- | -- | .041 | -- | -- | -- | -- | .009 | -- |
| 1025 | 0.003 | -- | -- | .052 | -- | -- | -- | -- | 0.009 | -- |
| 1026 | 6.80 | -- | -- | .112 | -- | -- | -- | -- | 3.94 | -- |
| 1026 | 13.5 | -- | -- | .124 | -- | -- | -- | -- | 15.2 | -- |
| 1027 | .003 | -- | -- | .036 | -- | -- | -- | -- | .018 | -- |
| 1027 | .002 | -- | -- | .039 | -- | -- | -- | -- | .010 | -- |
| 1050 | 14.9 | -- | -- | .028 | -- | -- | -- | -- | 37.0 | -- |
| 1050 | 24.1 | -- | -- | E.037 | -- | -- | -- | -- | 56.2 | -- |
| 1051 | .011 | -- | -- | .249 | -- | -- | -- | -- | .068 | -- |
| 3000 | 33.9 | 29.3 | 3 | .153 | <6 | <15 | 531 | <21 | 887 | 840 |
| 3001 | 5.76 | 6.98 | E2 | .130 | <6 | E13 | 447 | <21 | 271 | 273 |
| 3002 | 394 | 401 | 29 | .178 | <10 | <25 | 794 | <35 | 2,650 | 2,500 |
| 3003 | 520 | 489 | 39 | <2.80 | <10 | <25 | 692 | <35 | 3,970 | 4,010 |
| 3004 | 299 | 256 | 27 | .844 | <6 | <15 | 89 | <21 | 1,810 | 1,760 |
| 3005 | 72.5 | 91.5 | 12 | 1.160 | <6 | 61 | 102 | 78 | 96.0 | 120 |
| 3006 | 10.5 | 11.9 | E2 | .200 | <2 | E13 | 123 | <7 | 29.7 | 30.0 |
| 3007 | 11.1 | 11.2 | E2 | .215 | <6 | 25 | 91 | <21 | 168 | 155 |
| 3008 | 2.31 | 2.26 | <2 | .130 | <6 | E8 | 149 | <21 | 26.7 | 30.9 |
| 3009 | 7.58 | 2.40 | 2 | .086 | <2 | E4 | 39 | <7 | 7.68 | 7.22 |
| 3010 | 27.5 | 10.8 | E1 | .046 | E2 | 9 | 175 | <21 | 6.41 | 6.22 |
| 3011 | 23.3 | 19.7 | 3 | .218 | <6 | E8 | 58 | <21 | 88.7 | 79.9 |
| 3012 | 16.8 | 18.5 | <2 | .123 | 2 | 9 | 127 | <21 | 45.7 | 57.6 |
| 5000 | 9.01 | 10.6 | 3 | .025 | <3 | 5 | 169 | <5 | 5.61 | 8.28 |
| 5001 | 29.9 | 29.7 | 6 | .014 | <3 | E4 | 292 | <5 | 8.22 | 11.9 |
| 5002 | .010 | .170 | <2 | .024 | <3 | <4 | E1 | <5 | .106 | .460 |
| 5003 | .016 | .180 | <2 | .041 | <3 | 7 | E2 | <5 | .044 | .450 |
| 5004 | .050 | .880 | <2 | .059 | <3 | 5 | 9 | <5 | 2.91 | 5.54 |
| 5005 | .013 | .260 | <2 | .031 | <3 | 4 | 16 | <5 | .243 | .580 |
| 5006 | .018 | .470 | <2 | .038 | <3 | 5 | 26 | <5 | .843 | 1.21 |
| 5007 | .015 | .670 | <2 | .047 | <3 | 5 | 8 | <5 | 1.71 | 3.82 |
Table 1–1. Chemical characteristics of water-quality samples collected in the Rush Creek watershed, Perry County, Ohio, 2003 and 2004.—Continued
[mg/L, milligrams per liter; µg/L, micrograms per liter; --, not determined; E, estimated; <, less than; M, presence verified but not quantified]
| Site | Lead, dissolved (µg/L) | Lithium, dissolved (µg/L) | Manganese, dissolved (mg/L) | Manganese, total (mg/L) | Nickel, dissolved (µg/L) | Selenium, dissolved (µg/L) | Silver, dissolved (µg/L) | Strontium, dissolved (µg/L) | Vanadium, dissolved (µg/L) | Zinc, dissolved (µg/L) |
|---|---|---|---|---|---|---|---|---|---|---|
| 1000 | -- | -- | 8.80 | -- | -- | -- | -- | -- | -- | -- |
| 1000 | -- | -- | 11.8 | -- | -- | -- | -- | -- | -- | -- |
| 1001 | 3 | 72 | 8.61 | 7.80 | 100 | <3 | <5 | 389 | <6 | 184 |
| 1001 | -- | -- | 3.70 | -- | -- | -- | -- | -- | -- | -- |
| 1001 | -- | -- | 7.63 | -- | -- | -- | -- | -- | -- | -- |
| 1001 | <1 | 32 | 3.79 | 3.78 | 50 | <3 | <3 | 181 | <5 | 100 |
| 1001 | -- | -- | 5.50 | -- | -- | -- | -- | -- | -- | -- |
| 1001 | -- | -- | 13.5 | -- | -- | -- | -- | -- | -- | -- |
| 1002 | -- | -- | .546 | -- | -- | -- | -- | -- | -- | -- |
| 1002 | -- | -- | .148 | -- | -- | -- | -- | -- | -- | -- |
| 1003 | -- | -- | 13.9 | -- | -- | -- | -- | -- | -- | -- |
| 1003 | -- | -- | 14.4 | -- | -- | -- | -- | -- | -- | -- |
| 1003 | 2 | 114 | 13.8 | 15.3 | 700 | 3 | <5 | 371 | <6 | 283 |
| 1003 | -- | -- | 18.8 | -- | -- | -- | -- | -- | -- | -- |
| 1006 | -- | -- | 23.9 | -- | -- | -- | -- | -- | -- | -- |
| 1006 | -- | -- | 42.3 | -- | -- | -- | -- | -- | -- | -- |
| 1007 | 2 | 62 | 6.78 | 6.51 | 90 | <3 | <5 | 384 | <6 | 164 |
| 1007 | -- | -- | 2.87 | -- | -- | -- | -- | -- | -- | -- |
| 1007 | -- | -- | 5.51 | -- | -- | -- | -- | -- | -- | -- |
| 1007 | -- | -- | 4.35 | -- | -- | -- | -- | -- | -- | -- |
| 1007 | -- | -- | 11.3 | -- | -- | -- | -- | -- | -- | -- |
| 1009 | -- | -- | .0769 | -- | -- | -- | -- | -- | -- | -- |
| 1009 | -- | -- | .103 | -- | -- | -- | -- | -- | -- | -- |
| 1011 | -- | -- | 7.75 | -- | -- | -- | -- | -- | -- | -- |
| 1011 | <1 | 28 | 3.44 | 3.39 | 60 | <3 | <3 | 188 | <5 | 96 |
| 1011 | -- | -- | 8.02 | -- | -- | -- | -- | -- | -- | -- |
| 1012 | -- | -- | 9.05 | -- | -- | -- | -- | -- | -- | -- |
| 1012 | -- | -- | 11.0 | -- | -- | -- | -- | -- | -- | -- |
| 1014 | -- | -- | 14.8 | -- | -- | -- | -- | -- | -- | -- |
| 1014 | -- | -- | 22.3 | -- | -- | -- | -- | -- | -- | -- |
| 1015 | -- | -- | 14.0 | -- | -- | -- | -- | -- | -- | -- |
| 1015 | -- | -- | 18.7 | -- | -- | -- | -- | -- | -- | -- |
| 1017 | -- | -- | .614 | -- | -- | -- | -- | -- | -- | -- |
| 1017 | -- | -- | .803 | -- | -- | -- | -- | -- | -- | -- |
| 1018 | 3 | 113 | 15.7 | 15.0 | 160 | <3 | <5 | 592 | <6 | 293 |
| 1018 | -- | -- | 10.5 | -- | -- | -- | -- | -- | -- | -- |
| 1018 | -- | -- | 14.8 | -- | -- | -- | -- | -- | -- | -- |
| 1018 | M | 67 | 11.2 | 10.9 | 130 | E2 | <3 | 282 | <5 | 218 |
| 1018 | -- | -- | 12.9 | -- | -- | -- | -- | -- | -- | -- |
| 1018 | -- | -- | 25.8 | -- | -- | -- | -- | -- | -- | -- |
| 1023 | -- | -- | 0.428 | -- | -- | -- | -- | -- | -- | -- |
| 1023 | -- | -- | .167 | -- | -- | -- | -- | -- | -- | -- |
| 1024 | -- | -- | 8.00 | -- | -- | -- | -- | -- | -- | -- |
| 1024 | -- | -- | 11.0 | -- | -- | -- | -- | -- | -- | -- |
| 1025 | -- | -- | .152 | -- | -- | -- | -- | -- | -- | -- |
| 1025 | -- | -- | .0123 | -- | -- | -- | -- | -- | -- | -- |
| 1026 | -- | -- | 9.41 | -- | -- | -- | -- | -- | -- | -- |
| 1026 | -- | -- | 13.6 | -- | -- | -- | -- | -- | -- | -- |
| 1027 | -- | -- | .463 | -- | -- | -- | -- | -- | -- | -- |
| 1027 | -- | -- | .352 | -- | -- | -- | -- | -- | -- | -- |
| 1050 | -- | -- | 21.5 | -- | -- | -- | -- | -- | -- | -- |
| 1050 | -- | -- | 41.0 | -- | -- | -- | -- | -- | -- | -- |
| 1051 | -- | -- | .0022 | -- | -- | -- | -- | -- | -- | -- |
| 3000 | 2 | 245 | 37.7 | 36.3 | 560 | 6 | <15 | 1,090 | <18 | 1,430 |
| 3001 | 3 | 152 | 33.3 | 35.1 | 460 | 4 | <15 | 822 | <18 | 840 |
| 3002 | 2 | 1,010 | 51.6 | 55.4 | 1,150 | 14 | <25 | 1,070 | <30 | 3,910 |
| 3003 | 6 | 1,350 | 51.3 | 51.6 | 1,220 | 18 | <25 | 999 | <30 | 4,670 |
| 3004 | 4 | 1,360 | 22.5 | 19.2 | 250 | 11 | <15 | 1,230 | <18 | 1,470 |
| 3005 | M | 279 | 3.63 | 3.74 | 240 | 5 | <15 | 562 | <18 | 640 |
| 3006 | 2 | 146 | 12.6 | 14.3 | 180 | <3 | <5 | 342 | <6 | 276 |
| 3007 | M | 96 | 29.9 | 29.8 | 100 | 4 | <15 | 1,530 | <18 | 157 |
| 3008 | 2 | 81 | 17.8 | 20.3 | 160 | E2 | <15 | 412 | <18 | 205 |
| 3009 | 1 | 63 | 5.52 | 5.03 | 190 | 3 | <5 | 280 | <6 | 90 |
| 3010 | 1 | 112 | 16.6 | 15.6 | 540 | <3 | <5 | 360 | <6 | 348 |
| 3011 | 1 | 126 | 7.46 | 7.60 | 870 | 4 | <15 | 353 | <18 | 227 |
| 3012 | 2 | 126 | 13.7 | 13.8 | 420 | <3 | <5 | 376 | <6 | 291 |
| 5000 | <1 | 74 | 11.8 | 11.9 | 190 | E2 | <3 | 206 | <5 | 334 |
| 5001 | 1 | 94 | 20.1 | 20.5 | 300 | <3 | <3 | 199 | <5 | 505 |
| 5002 | <1 | 5 | .138 | .137 | M | <3 | <3 | 90.1 | <5 | 8 |
| 5003 | <1 | 7 | .783 | .763 | M | <3 | <3 | 214 | <5 | 5 |
| 5004 | <1 | 21 | 1.16 | 1.12 | 20 | E1 | <3 | 208 | <5 | 32 |
| 5005 | <1 | 16 | 1.66 | 1.58 | 30 | <3 | <3 | 147 | <5 | 35 |
| 5006 | <1 | 23 | 2.53 | 2.43 | 40 | <3 | <3 | 193 | <5 | 59 |
| 5007 | M | 17 | 1.01 | .995 | 20 | <3 | <3 | 175 | <5 | 28 |
[Sites are presented in downstream order; —, no fish]
| Species | Site | ||||||||
|---|---|---|---|---|---|---|---|---|---|
| 1006 | 1018 | 1014 | 1015 | 1026 | 1001 | 1000 | 1007 | 1024 | |
| Least brook lamprey | — | — | — | — | — | — | — | — | — |
| Northern hog sucker | — | — | — | — | — | — | — | — | — |
| White sucker | — | — | — | — | — | — | — | — | — |
| Common carp | — | — | — | — | — | — | — | — | — |
| Creek chub | — | — | — | — | — | 1 | 2 | 10 | 10 |
| Southern redbelly dace | — | — | — | — | — | — | — | — | — |
| Spotfin shiner | — | — | — | — | — | — | — | — | 4 |
| Sand shiner | — | — | — | — | — | — | — | 1 | 3 |
| Silverjaw minnow | — | — | — | — | — | — | — | — | — |
| Bluntnose minnow | — | — | — | — | — | — | — | — | — |
| Central stoneroller | — | — | — | — | — | — | — | — | — |
| Yellow bullhead | — | — | — | — | — | — | — | 2 | — |
| Brindled madtom | — | — | — | — | — | — | — | — | — |
| Blackstripe topminnow | — | — | — | — | — | — | — | — | — |
| Largemouth bass | — | — | — | — | — | — | — | 1 | — |
| Green sunfish | 1 | — | — | — | 4 | — | 2 | 3 | 3 |
| Bluegill sunfish | — | — | — | — | 8 | 3 | 3 | 23 | 5 |
| Blackside darter | — | — | — | — | — | — | — | — | — |
| Logperch darter | — | — | — | — | — | — | — | — | — |
| Johnny darter | — | — | — | — | — | — | — | — | 1 |
| Greenside darter | — | — | — | — | — | — | — | — | — |
| Banded darter | — | — | — | — | — | — | — | — | — |
| Fantail darter | — | — | — | — | — | — | — | — | — |
[Sites are presented in downstream order of confluence with Rush Creek; —, no fish]
| Species | Site | ||||||||
|---|---|---|---|---|---|---|---|---|---|
| 1003 | 1012 | 1017 | 1027 | 1002 | 1011 | 1025 | 1023 | 1009 | |
| Least brook lamprey | — | — | — | — | — | — | — | — | 7 |
| Northern hog sucker | — | — | — | — | — | — | — | — | 4 |
| White sucker | — | — | — | — | — | — | — | 4 | 51 |
| Common carp | — | — | — | — | — | — | — | — | 2* |
| Creek chub | — | — | 65 | 51 | 59 | — | 38 | 11 | 19 |
| Southern redbelly dace | — | — | — | 2 | — | — | — | — | — |
| Spotfin shiner | — | — | — | — | — | — | — | — | 17 |
| Sand shiner | — | — | — | — | — | — | — | — | — |
| Silverjaw minnow | — | — | 1 | — | — | — | — | — | — |
| Bluntnose minnow | — | — | — | — | — | — | — | — | 57 |
| Central stoneroller | — | — | 2 | — | — | — | — | — | 4 |
| Yellow bullhead | — | — | — | — | — | — | — | 1 | 5 |
| Brindled madtom | — | — | — | — | — | — | — | — | 8 |
| Blackstripe topminnow | — | — | — | — | — | — | — | — | 4 |
| Largemouth bass | — | — | 2 | 4 | 10 | — | 11 | 6 | 4 |
| Green sunfish | — | — | — | 4 | 90 | — | 10 | 2 | 24 |
| Bluegill sunfish | — | — | 21 | 18 | 66 | — | 56 | 18 | 116 |
| Blackside darter | — | — | — | — | — | — | — | — | 7 |
| Logperch darter | — | — | — | — | — | — | — | — | 2 |
| Johnny darter | — | — | 11 | 17 | — | — | 5 | — | 9 |
| Greenside darter | — | — | — | — | — | — | — | — | 8 |
| Banded darter | — | — | — | — | — | — | — | — | 4 |
| Fantail darter | — | — | — | — | — | — | — | — | 14 |
* Only 1 fish was processed; the other escaped.
[Sites are presented in downstream order; —, no specimens; +, specimen(s) identified in qualitative sample]
| Taxon | Site | ||||||||
|---|---|---|---|---|---|---|---|---|---|
| 1006 | 1018 | 1014 | 1015 | 1026 | 1001 | 1000 | 1007 | 1024 | |
| HYDROIDA | |||||||||
| Hydra sp. | — | — | — | — | — | — | — | — | — |
| Turbellaria (flatworms) |
— | — | — | — | — | — | — | — | — |
| Oligochaeta (aquatic worms) |
— | — | — | — | 27 + | 27 + | 3 + | 4 + | 7 + |
| ISOPODA | |||||||||
| Caecidotea sp. |
— | — | — | — | — | — | — | — | 2 + |
| AMPHIPODA | |||||||||
| Hyalella azteca |
— | — | — | — | — | — | — | — | — |
| DECAPODA | |||||||||
| Cambaridae |
— | — | — | — | — | — | — | — | — |
| Cambarus (C.) sp. |
— | — | — | — | — | — | — | — | — |
| Cambarus (Cambarus) sp. A |
— | — | — | — | — | — | — | — | + |
| Cambarus (Tubericambarus) thomai |
— | — | — | — | — | — | — | — | — |
| Orconectes (Crokerinus) sanbornii sanbornii |
— | — | — | — | — | — | — | — | — |
| ARACHNOIDEA | |||||||||
| Hydracarina |
— | — | — | — | — | — | — | — | — |
| EPHEMEROPTERA | |||||||||
| Acerpenna macdunnoughi |
— | — | — | — | — | — | — | — | — |
| Plauditus dubius or P. virilis |
— | — | — | — | — | — | — | — | — |
| Baetis flavistriga |
— | — | — | — | — | + | + | — | — |
| Baetis intercalaris |
— | — | — | — | — | — | — | — | 3 |
| Callibaetis sp. |
— | — | — | — | — | — | — | + | — |
| Centroptilum sp. (w/o hindwing pads) |
— | — | — | — | — | — | — | + | — |
| Procloeon sp. (w/ hindwing pads) |
— | — | — | — | — | — | — | — | — |
| Procloeon sp. (w/o hindwing pads) |
— | — | — | — | — | — | — | — | — |
| Isonychia sp. |
— | — | — | — | — | — | — | — | — |
| Stenacron sp. |
— | — | — | — | — | — | — | — | 1 |
| Stenonema femoratum |
— | — | — | — | — | — | — | — | — |
| Leptophlebia sp. or Paraleptophlebia sp. |
— | — | — | — | — | — | — | — | — |
| Eurylophella sp. |
— | — | — | — | — | — | — | — | — |
| Caenis sp. |
1 + | — | — | — | — | 1 + | — | — | 1 |
| ODONATA | |||||||||
| Calopteryx sp. |
— | — | — | — | — | — | — | — | — |
| Coenagrionidae |
— | + | — | — | + | — | + | + | — |
| Argia sp. |
— | — | — | — | — | — | — | — | — |
| Anisoptera |
— | — | — | — | — | — | — | — | — |
| Anax sp. |
— | — | — | — | — | — | — | — | — |
| Boyeria vinosa |
— | — | — | — | — | — | — | — | — |
| Leucorrhinia sp. |
— | + | — | — | — | — | — | — | — |
| Sympetrum sp. |
— | — | — | — | — | — | + | — | — |
| PLECOPTERA | — | — | — | — | — | — | — | — | — |
| Isoperla similis |
— | — | — | — | — | — | — | — | — |
| HEMIPTERA | |||||||||
| Palmacorixa sp. |
— | — | — | — | — | — | — | + | — |
| Sigara sp. |
— | — | — | — | — | — | — | + | — |
| MEGALOPTERA | |||||||||
| Sialis sp. |
2 + | + | 2 + | 16 + | 2 + | 3 + | 9 + | 3 + | 4 + |
| Nigronia serricornis |
— | — | — | — | — | — | — | 1 | + |
| TRICHOPTERA | |||||||||
| Chimarra obscura |
— | — | — | — | — | — | — | — | — |
| TRICHOPTERA—Continued | |||||||||
| Nyctiophylax sp. |
— | — | — | — | — | — | — | — | — |
| Polycentropus sp. |
— | — | — | — | — | — | — | — | — |
| Cheumatopsyche sp. |
— | — | — | — | + | + | — | 1 | 6 |
| Diplectrona modesta |
— | — | — | — | — | — | + | 2 | 10 |
| Ceratopsyche morosa group |
— | — | — | — | — | — | — | — | — |
| Hydropsyche depravata group |
— | — | — | — | — | — | — | — | — |
| Hydropsyche dicantha |
— | — | — | — | — | — | — | — | — |
| Hydroptila sp. |
— | — | — | — | — | — | — | — | — |
| Phryganeidae |
— | — | — | — | — | — | — | + | — |
| Ptilostomis sp. |
— | — | — | — | + | + | + | — | + |
| Triaenodes sp. |
— | — | — | — | — | — | — | — | — |
| COLEOPTERA | |||||||||
| Haliplus sp. |
— | — | — | — | — | — | — | — | — |
| Peltodytes sp. |
— | — | — | — | — | — | — | — | — |
| Agabus sp. |
+ | — | — | — | — | — | — | — | — |
| Hydroporus sp. |
— | — | — | — | — | — | — | — | — |
| Laccophilus sp. |
— | — | — | — | — | — | — | — | — |
| Tropisternus sp. |
— | — | — | — | — | — | — | — | — |
| Helichus sp. |
— | — | — | — | — | — | — | — | — |
| Elmidae |
— | — | — | — | — | — | — | — | — |
| Ancyronyx variegata |
— | — | — | — | — | — | — | — | — |
| Dubiraphia sp. |
— | — | — | — | — | — | — | — | 2 + |
| Dubiraphia vittata group |
— | — | — | — | — | — | — | — | — |
| Macronychus glabratus |
— | — | — | — | — | — | — | — | — |
| Stenelmis sp. |
— | — | — | — | 2 | 1 + | — | 2 | — |
| DIPTERA | |||||||||
| Hexatoma sp. |
— | — | — | — | — | — | + | — | — |
| Tipula sp. |
— | — | — | — | — | — | + | + | — |
| Tipula abdominalis |
— | — | — | — | — | — | — | — | — |
| Dixella sp. |
— | — | — | — | — | — | — | — | — |
| Aedes sp. |
— | — | — | — | — | — | — | + | — |
| Anopheles sp. |
— | — | — | — | — | — | — | — | — |
| Simulium sp. |
— | — | — | — | — | + | — | — | 1 |
| Ceratopogonidae |
4 | + | 3 | 4 | 1 | 1 | 1 | — | 2 |
| Tanypodinae |
— | — | — | — | — | — | — | — | — |
| Ablabesmyia mallochi |
— | — | — | — | — | — | — | — | + |
| Clinotanypus pinguis |
— | — | — | — | — | — | — | — | — |
| Conchapelopia sp. |
3 | — | — | — | — | — | — | 6 | 17 + |
| Hayesomyia senata or Thienemannimyia norena |
— | — | — | 1 | — | — | — | 1 | — |
| Helopelopia sp. |
— | — | — | — | + | 1 + | — | — | — |
| Labrundinia pilosella |
— | — | — | — | — | — | + | — | — |
| Meropelopia sp. |
— | — | — | — | + | — | — | — | — |
| Nilotanypus fimbriatus |
— | — | — | — | — | — | — | — | — |
| Procladius (Holotanypus) sp. |
— | — | — | — | — | — | — | — | — |
| Thienemannimyia group |
— | — | — | — | 2 | — | 1 | — | — |
| Zavrelimyia sp. |
— | — | — | — | + | — | + | 3 | + |
| Brillia flavifrons group |
— | — | — | — | — | — | — | — | — |
| Corynoneura sp. 9 |
— | — | 1 | — | — | — | — | — | — |
| Corynoneura lobata |
— | — | — | — | + | — | — | — | 1 |
| Cricotopus (C.) sp. |
— | — | — | — | — | — | — | — | — |
| DIPTERA—Continued | |||||||||
| Cricotopus (C.) bicinctus |
— | — | — | — | — | — | — | — | 1 |
| Limnophyes sp. |
1 | — | 5 | 4 | + | — | — | — | + |
| Nanocladius (N.) spiniplenus |
— | — | — | — | — | — | — | — | — |
| Orthocladius (O.) sp. |
— | — | — | — | — | — | — | — | — |
| Orthocladius (Symposiocladius) lignicola |
— | — | — | — | — | — | — | — | — |
| Parakiefferiella sp. |
— | — | — | — | — | — | — | — | — |
| Parametriocnemus sp. |
— | — | — | — | — | — | 1 + | 6 + | 9 |
| Psectrocladius (P.) psilopterus group |
— | — | — | — | — | — | — | — | — |
| Psilometriocnemus triannulatus |
— | — | — | — | — | + | — | — | — |
| Rheocricotopus (Psilocricotopus) robacki |
— | — | — | — | — | + | — | — | 3 |
| Thienemanniella lobapodema |
— | — | — | — | — | — | — | — | — |
| Thienemanniella xena |
— | — | — | — | — | — | — | — | — |
| Tvetenia bavarica group |
— | — | — | — | — | — | — | — | — |
| Chironomus (C.) sp. |
— | — | — | — | — | — | 3 + | — | — |
| Chironomus (C.) decorus group |
36 + | + | 46 + | 10 + | — | 7 + | — | 24 + | 8 |
| Chironomus (C.) riparius group |
— | — | — | — | 31 + | — | — | — | — |
| Cryptochironomus sp. |
— | — | — | — | — | — | — | — | — |
| Cryptotendipes pseudotener |
— | — | — | — | — | — | — | — | — |
| Dicrotendipes neomodestus |
— | — | — | — | — | — | — | 3 | 2 |
| Microtendipes "caelum" (sensu Simpson & Bode, 1980) |
— | — | — | — | — | — | — | — | — |
| Microtendipes pedellus group |
— | — | 1 | — | — | — | — | 1 | — |
| Nilothauma sp. |
— | — | — | — | — | — | — | — | — |
| Paralauterborniella nigrohalteralis |
— | — | — | — | — | — | — | — | — |
| Paratendipes albimanus or P. duplicatus |
— | — | — | — | — | — | — | — | — |
| Phaenopsectra obediens group |
2 | — | — | — | — | — | — | — | — |
| Phaenopsectra punctipes |
— | — | — | — | — | — | — | — | — |
| Phaenopsectra flavipes |
— | — | — | — | — | — | — | 2 | 1 |
| Polypedilum (Pentapedilum) tritum var. I |
— | — | 3 | — | — | — | 5 + | 17 | 4 |
| Polypedilum (P.) sp. 2 |
— | — | 76 | — | — | 1 | — | — | — |
| Polypedilum (P.) albicorne |
— | — | — | — | — | — | — | — | — |
| Polypedilum (Uresipedilum) aviceps |
— | — | — | — | — | — | — | — | — |
| Polypedilum (Uresipedilum) flavum |
— | — | — | — | — | — | — | — | — |
| Polypedilum (P.) fallax group |
— | — | — | 1 | — | — | — | 7 | 1 |
| Polypedilum (P.) illinoense |
— | + | — | 35 | + | — | + | + | 10 |
| Polypedilum (P.) ophioides |
— | — | — | — | — | — | — | — | — |
| Polypedilum (P.) trigonus |
6 | — | — | — | 2 | — | — | 3 + | — |
| Polypedilum (Tripodura) halterale group |
— | — | — | — | — | — | — | 1 | 1 |
| Polypedilum (Tripodura) scalaenum group |
— | — | — | — | — | — | — | — | — |
| Saetheria tylus |
— | — | — | — | — | — | — | + | — |
| Stictochironomus sp. |
— | — | — | — | — | — | — | — | — |
| Tribelos jucundum |
— | — | — | — | — | — | — | — | 2 |
| Paratanytarsus sp. |
— | — | — | — | — | — | — | 1 | + |
| Paratanytarsus n. sp 1 |
— | — | — | — | — | — | — | — | — |
| Rheotanytarsus pellucidus |
— | — | — | — | — | — | — | — | 2 |
| Rheotanytarsus sp. |
— | — | — | — | — | — | — | — | 2 |
| Stempellinella n. sp. nr. flavidula |
— | — | — | — | — | — | — | — | — |
| Tanytarsus sp. |
— | + | 3 + | 32 + | 2 + | — | + | 20 | 11 |
| Tanytarsus curticornis group |
— | — | — | — | — | — | — | — | 2 |
| Tanytarsus glabrescens group sp. 4 |
— | — | — | — | — | — | — | 1 | — |
| Tanytarsus glabrescens group sp. 7 |
— | — | — | — | — | — | — | + | 4 |
| DIPTERA—Continued | |||||||||
| Tanytarsus sepp |
— | — | — | — | — | — | — | 1 | 4 |
| Chrysops sp. |
— | — | — | — | — | — | — | + | — |
| Hemerodromia sp. |
— | — | — | — | — | — | — | 1 | — |
| Dolichopodidae |
— | — | — | — | — | — | — | — | + |
| BASOMMATOPHORA | |||||||||
| Physella sp. |
— | — | — | — | — | — | — | — | + |
| Helisoma anceps anceps |
— | — | — | — | — | — | — | — | — |
| Planorbella (Pierosoma) trivolvis |
— | — | — | — | — | — | — | — | — |
| Ferrissia sp. |
— | — | — | — | — | — | — | — | — |
| VENEROIDA | |||||||||
| Sphaerium sp. |
— | — | — | — | — | — | — | — | — |
[Sites are presented in downstream order of confluence with Rush Creek; —, no specimen; +, specimen identified in qualitative sample]
| Taxon | Site | ||||||||
|---|---|---|---|---|---|---|---|---|---|
| 1003 | 1012 | 1017 | 1027 | 1002 | 1011 | 1025 | 1023 | 1009 | |
| HYDROIDA | |||||||||
| Hydra sp. |
— | — | — | — | — | — | — | — | 16 |
| Turbellaria |
— | — | — | — | — | — | — | — | 7 + |
| Oligochaeta |
— | — | 8 + | + | 12 | — | + | + | 12 + |
| ISOPODA | |||||||||
| Caecidotea sp. |
— | — | — | — | — | — | — | 1 + | 5 |
| AMPHIPODA | |||||||||
| Hyalella azteca |
— | — | — | — | — | — | 45 + | — | — |
| DECAPODA | |||||||||
| Cambaridae |
— | — | + | — | — | + | — | — | + |
| Cambarus (C.) sp. |
— | — | — | 1 | — | — | — | — | — |
| Cambarus (Cambarus) sp. A |
— | — | — | — | — | — | — | — | — |
| Cambarus (Tubericambarus) thomai |
— | — | — | — | + | — | — | + | — |
| Orconectes (Crokerinus) sanbornii sanbornii |
— | — | 1 | — | — | — | + | — | — |
| ARACHNOIDEA | |||||||||
| Hydracarina |
— | — | — | 1 | — | — | — | — | — |
| EPHEMEROPTERA | |||||||||
| Acerpenna macdunnoughi |
— | — | — | + | — | — | — | — | — |
| Plauditus dubius or P. virilis |
— | — | — | + | — | — | — | — | — |
| Baetis flavistriga |
— | — | — | — | 2 + | — | + | + | + |
| Baetis intercalaris |
— | — | + | — | + | — | + | + | 1 + |
| Callibaetis sp. |
— | — | — | — | — | — | — | — | — |
| Centroptilum sp. (w/o hindwing pads) |
— | — | + | 1 + | — | — | 22 + | — | — |
| Procloeon sp. (w/ hindwing pads) |
— | — | — | — | + | — | — | — | — |
| Procloeon sp. (w/o hindwing pads) |
— | — | — | + | — | — | 24 + | — | — |
| Isonychia sp. |
— | — | — | — | — | — | — | — | — |
| Stenacron sp. |
— | — | + | 4 + | — | — | 7 + | 8 | 45 + |
| Stenonema femoratum |
— | — | + | 1 | — | — | 39 + | 3 | 6 |
| Leptophlebia sp. or Paraleptophlebia sp. |
— | — | 6 | 2 + | 319 + | — | 376 + | 7 | + |
| Eurylophella sp. |
— | — | — | — | 12 | — | 8 | — | — |
| Caenis sp. |
— | — | — | — | 8 | — | 19 + | — | 25 |
| ODONATA | |||||||||
| Calopteryx sp. |
— | — | 4 + | + | — | + | — | + | — |
| Coenagrionidae |
— | — | — | — | — | — | + | — | + |
| Argia sp. |
— | — | — | — | — | — | 3 | — | 9 + |
| Anisoptera |
+ | — | — | — | — | — | — | — | — |
| Anax sp. |
1 + | — | — | — | — | — | — | — | — |
| Boyeria vinosa |
— | — | 1 + | — | — | — | — | — | 1 + |
| Leucorrhinia sp. |
— | — | — | — | — | — | — | — | — |
| Sympetrum sp. |
— | — | — | — | — | — | — | — | — |
| PLECOPTERA | — | — | — | — | — | — | — | — | + |
| Isoperla similis |
— | — | — | + | — | — | — | — | — |
| HEMIPTERA | |||||||||
| Palmacorixa sp. |
— | — | — | — | — | — | — | — | — |
| Sigara sp. |
— | — | — | — | — | — | — | — | — |
| MEGALOPTERA | |||||||||
| Sialis sp. |
— | 3 + | 6 + | 6 + | 1 | 5 + | — | + | + |
| Nigronia serricornis |
— | — | — | — | — | — | — | — | — |
| TRICHOPTERA | |||||||||
| Chimarra obscura |
— | — | — | — | — | — | — | — | 8 + |
| Nyctiophylax sp. |
— | — | — | 9 | — | 2 | 5 | — | — |
| Polycentropus sp. |
— | — | 2 | 1 | — | — | 19 + | ||
| TRICHOPTERA—Continued | |||||||||
| Cheumatopsyche sp. |
— | — | 27 + | + | + | — | + | 2 + | 97 + |
| Diplectrona modesta |
— | — | — | — | — | + | — | — | — |
| Ceratopsyche morosa group |
— | — | — | — | — | — | + | — | — |
| Hydropsyche depravata group |
— | — | 7 + | + | — | + | — | + | + |
| Hydropsyche dicantha |
— | — | — | — | — | — | — | + | — |
| Hydroptila sp. |
— | — | — | — | — | — | 8 + | — | — |
| Phryganeidae |
— | — | — | — | — | — | — | — | — |
| Ptilostomis sp. |
— | — | — | — | — | + | — | — | — |
| Triaenodes sp. |
— | — | — | 1 | — | — | — | — | — |
| COLEOPTERA | |||||||||
| Haliplus sp. |
— | — | — | + | — | — | — | — | — |
| Peltodytes sp. |
— | — | — | + | + | — | + | — | + |
| Agabus sp. |
— | 1 + | — | — | — | — | — | — | — |
| Hydroporus sp. |
— | — | — | + | — | — | — | — | — |
| Laccophilus sp. |
— | — | — | — | + | — | — | — | — |
| Tropisternus sp. |
— | — | — | — | + | — | — | — | — |
| Helichus sp. |
— | — | + | + | 4 + | — | + | + | 2 |
| Elmidae |
— | — | — | — | — | 1 | — | — | — |
| Ancyronyx variegata |
— | — | — | — | — | — | — | — | 6 + |
| Dubiraphia sp. |
— | — | — | — | — | — | — | — | — |
| Dubiraphia vittata group |
— | — | — | 13 + | 20 + | + | 17 + | 1 + | 10 |
| Macronychus glabratus |
— | — | 1 | + | — | — | — | 7 | 39 |
| Stenelmis sp. |
— | — | 2 | + | 2 + | + | — | 1 + | 13 + |
| DIPTERA | |||||||||
| Hexatoma sp. |
— | — | — | — | — | — | — | — | + |
| Tipula sp. |
— | — | — | + | + | — | — | — | 2 + |
| Tipula abdominalis |
— | — | — | — | + | — | — | — | — |
| Dixella sp. |
— | — | — | — | + | — | — | — | — |
| Aedes sp. |
— | — | — | — | — | — | — | — | — |
| Anopheles sp. |
— | — | — | — | + | — | — | — | — |
| Simulium sp. |
— | — | + | + | + | — | + | + | + |
| Ceratopogonidae |
60 + | 1 + | — | — | — | — | 4 | — | 4 |
| Tanypodinae |
— | 1 | — | — | — | — | — | — | — |
| Ablabesmyia mallochi |
— | — | + | 89 + | 8 | — | 115 + | 31 + | — |
| Clinotanypus pinguis |
— | — | + | — | — | — | — | — | — |
| Conchapelopia sp. |
— | 4 | 43 + | 12 + | 15 | 12 | + | 35 + | 32 |
| Hayesomyia senata or Thienemannimyia norena |
— | — | — | — | + | — | — | — | — |
| Helopelopia sp. |
— | — | 115 | — | — | — | 50 + | 26 + | 180 |
| Labrundinia pilosella |
— | — | — | 3 + | 16 | — | — | 27 | — |
| Meropelopia sp. |
— | — | — | — | — | — | — | — | — |
| Nilotanypus fimbriatus |
— | — | — | — | — | — | — | + | — |
| Procladius (Holotanypus) sp. |
— | — | + | — | — | — | — | — | — |
| Thienemannimyia group |
— | — | — | — | — | — | — | — | — |
| Zavrelimyia sp. |
— | + | 14 + | 4 | 84 | — | + | — | — |
| Brillia flavifrons group |
— | — | 14 + | — | + | — | — | — | — |
| Corynoneura sp. 9 |
— | — | — | — | — | — | — | — | — |
| Corynoneura lobata |
— | — | 4 | — | 20 | — | 40 | 44 | 168 |
| Cricotopus (C.) sp. |
— | — | 14 | 4 + | — | 4 | — | — | + |
| Cricotopus (C.) bicinctus |
— | — | — | — | — | — | — | — | — |
| DIPTERA—Continued | |||||||||
| Limnophyes sp. |
— | 2 + | — | — | — | — | — | — | — |
| Nanocladius (N.) spiniplenus |
— | — | — | — | — | — | — | — | 11 |
| Orthocladius (O.) sp. |
— | — | — | — | — | — | — | — | + |
| Orthocladius (Symposiocladius) lignicola |
— | — | — | — | + | — | — | — | — |
| Parakiefferiella sp. |
— | — | — | 4 | — | — | — | — | 11 |
| Parametriocnemus sp. |
— | — | 14 + | — | + | — | — | — | 42 + |
| Psectrocladius (P.) psilopterus group |
— | — | — | — | — | — | 7 + | — | — |
| Psilometriocnemus triannulatus |
— | — | — | — | — | — | — | — | — |
| Rheocricotopus (Psilocricotopus) robacki |
— | — | 43 + | + | — | — | — | 9 + | 74 + |
| Thienemanniella lobapodema |
— | — | — | — | — | — | — | — | 24 |
| Thienemanniella xena |
— | — | + | — | 8 | — | — | — | — |
| Tvetenia bavarica group |
— | — | — | — | — | — | — | — | 11 |
| Chironomus (C.) sp. |
— | — | — | — | — | — | — | + | — |
| Chironomus (C.) decorus group |
726 + | 4 + | — | — | — | — | 7 | — | — |
| Chironomus (C.) riparius group |
— | — | — | — | — | — | — | — | — |
| Cryptochironomus sp. |
— | — | — | — | + | — | — | + | — |
| Cryptotendipes pseudotener |
— | — | — | — | — | — | + | — | — |
| Dicrotendipes neomodestus |
— | — | — | 4 | — | — | 136 + | — | 11 |
| Microtendipes "caelum" (sensu Simpson & Bode, 1980) |
— | 1 | — | — | — | — | — | — | — |
| Microtendipes pedellus group |
— | + | 244 | 16 | 175 | — | 36 | 207 + | 422 |
| Nilothauma sp. |
— | — | — | 12 | — | — | 29 | — | — |
| Paralauterborniella nigrohalteralis |
— | — | + | — | — | — | — | — | — |
| Paratendipes albimanus or P. duplicatus |
— | — | — | 4 | 8 | — | 79 | 13 | — |
| Phaenopsectra obediens group |
— | — | 14 | — | — | — | 29 | — | — |
| Phaenopsectra punctipes |
— | — | — | — | — | — | — | — | 11 |
| Phaenopsectra flavipes |
— | — | — | — | — | — | — | — | — |
| Polypedilum (Pentapedilum) tritum var. I |
— | 3 + | — | — | — | — | — | — | — |
| Polypedilum (P.) sp. 2 |
— | — | — | — | — | — | — | — | — |
| Polypedilum (P.) albicorne |
— | — | — | — | — | 1 | — | — | — |
| Polypedilum (Uresipedilum) aviceps |
— | — | + | — | — | — | — | — | — |
| Polypedilum (Uresipedilum) flavum |
— | + | 14 + | — | — | + | — | 9 | — |
| Polypedilum (P.) fallax group |
— | — | 244 | 54 | 84 | 2 | 14 | 35 | 127 |
| Polypedilum (P.) illinoense |
+ | 20 + | + | + | + | — | — | — | 11 |
| Polypedilum (P.) ophioides |
— | — | — | — | — | — | + | — | — |
| Polypedilum (P.) trigonus |
— | — | — | — | — | — | — | — | — |
| Polypedilum (Tripodura) halterale group |
— | — | — | — | — | — | — | — | — |
| Polypedilum (Tripodura) scalaenum group |
— | — | 43 | 19 | — | — | — | 9 | 21 |
| Saetheria tylus |
— | — | — | + | — | — | — | + | — |
| Stictochironomus sp. |
— | — | + | — | — | — | — | — | — |
| Tribelos jucundum |
— | — | 14 | 8 | — | — | — | — | — |
| Paratanytarsus sp. |
— | — | 86 | 16 + | 167 + | — | 65 + | 13 | 42 |
| Paratanytarsus n. sp. 1 |
— | — | — | — | 15 + | — | — | — | — |
| Rheotanytarsus pellucidus |
— | — | 29 | + | 8 + | — | 7 | 4 + | 63 + |
| Rheotanytarsus sp. |
— | — | 29 | — | + | — | + | + | 42 |
| Stempellinella n. sp. nr. flavidula |
— | — | — | 4 | + | — | — | — | — |
| Tanytarsus sp. |
1,756 + | — | 14 + | 43 + | 8 | 2 | 29 | + | 63 + |
| Tanytarsus curticornis group |
— | — | 43 | — | 30 | — | — | 35 | — |
| Tanytarsus glabrescens group sp. 4 |
— | — | — | — | — | — | — | — | — |
| Tanytarsus glabrescens group sp. 7 |
— | — | 43 | 43 + | 38 | — | 186 + | 84 + | 127 |
| Tanytarsus sepp |
— | — | 43 | 62 | 30 | — | 43 | 22 + | 42 + |
| DIPTERA—Continued | |||||||||
| Chrysops sp. |
— | — | — | + | + | — | — | + | — |
| Hemerodromia sp. |
— | — | 4 | 6 + | 69 + | + | 8 | 44 + | 21 |
| Dolichopodidae |
— | — | — | — | — | — | — | — | — |
| BASOMMATOPHORA | |||||||||
| Physella sp. |
— | — | 29 + | 2 + | 63 + | — | 28 + | 63 | — |
| Helisoma anceps anceps |
— | — | — | + | 3 | — | + | — | — |
| Planorbella (Pierosoma) trivolvis |
— | — | — | — | — | — | 10 + | — | — |
| Ferrissia sp. |
— | — | — | 1 | — | — | 14 + | 1 | 1 + |
| VENEROIDA | |||||||||
| Sphaerium sp. |
— | — | 2 + | + | 1 + | — | + | + | + |
| AccessibilityFOIAPrivacyPolicies and Notices | |
 |
|