 |
|
|
||||
| PUBLICATION—Scientific Investigations Report |
U.S. Department of the Interior
U.S. Geological Survey
The full report is in Adobe Acrobat® Portable Document Format (PDF). You will need Adobe Acrobat Reader®, version 6 or higher, to view or print the PDF. If you don't already have this free viewing software or need to upgrade your version, download Adobe Acrobat Reader®. Users with visual disabilities can visit http://access.adobe.com/ for conversion tools and information to help make PDF files accessible. The report is also available from USGS Maps and Publications.
View or download the PDF (1.87 mb)
The upper Yellowstone River in Montana is an important State and national water resource, providing recreational, agricultural, and commercial benefits. Floods in 1996 and 1997, with recorded peak discharges having recurrence intervals close to 100 years, caused substantial streambank erosion and hill- slope mass wasting. Large quantities of sand-, gravel-, and cobble-sized material entrained by the flood flows became flood-bar deposits, creating a source of sediment available for transport during future floods. The flood damage and resulting sedimentation raised concerns about potential streambank-stabilization projects and how the river and riparian corridor might be managed in the future. The U.S. Geological Survey, in cooperation with the Park Conservation District, the Montana Department of Transportation, and the U.S. Army Corps of Engineers, investigated sediment transport in the upper Yellowstone River near Livingston from 1999 through 2001 as part of a cumulative effects study to provide a scientific basis for future river management decisions. The purpose of this report is to present the results of data collection, analysis, and simulation of sediment transport for the upper Yellowstone River. The study area included a 13.5-mile study reach of the upper Yellowstone River where substantial sediment transport occurred in 1996 and 1997. In this study area, the upper Yellowstone River is a high gradient, coarse-bed stream having a slope of about 0.0028 foot per foot or more than 14 feet per mile. The study area drains about 3,551 square miles, and runoff results primarily from snowmelt during the spring and summer months. As part of sediment-transport investigations, the U.S. Geological Survey surveyed river cross sections, characterized streambed-material particle size using particle counts and sieve analyses, and collected bedload- and suspended-sediment data during three runoff seasons (1999-2001). Data were collected for stream discharges that ranged from 2,220 cubic feet per second (typical of pre- and post-runoff discharge) to 25,100 cubic feet per second (about 125 percent of bankfull discharge). The distribution of streambed-material particle size was determined, and sediment-transport curves for bedload discharge, suspended-sediment discharge, and total-sediment discharge were developed. The threshold values of streamflow and average stream velocity needed for initiation of bedload transport for selected sediment-size classes showed that little to no bedload was transported for an average stream velocity below about 3 feet per second, and the only particle size transported as bedload at that velocity was sand. Over the range of stream discharges sampled and with silt- and finer-sized particles excluded, bedload discharge averaged about 18 percent of the total-sediment discharge, equal to bedload discharge plus suspended-sediment discharge. At the lowest and highest stream discharges sampled, bedload was, respectively, less than about 2 percent and about 30 percent of the total-sediment discharge. Over the range of stream discharges sampled, the sand-sized part of the total suspended-sediment discharge averaged about 48 percent, where the total suspended-sediment discharge included sand-, silt- and finer-sized particles. At the lowest and highest stream discharges sampled, the sand-sized part of the total suspended-sediment discharge was, respectively, less than about 16 percent and about 50 percent of the total suspended-sediment discharge. The sediment-transport curves were compared to curves for selected sites in the western United States having drainage areas ranging from 21 square miles to over 20,000 square miles. Daily sediment loads transported at bankfull discharge were calculated for each site and results were plotted in relation to drainage area. Results based on the 1999-2001 data-collection period indicate that the estimated daily bedload transported at bankfull discharge in the upper Yellowstone River exceeded the envelope line that bounds the upper end of the data for other selected sites in the Northern Rocky Mountains and is similar in magnitude to that for selected sites in Alaska having braided channels and glacial and snowmelt runoff. Similar comparisons for suspended sediment indicate that daily suspended-sediment load at bankfull discharge is relatively high in the upper Yellowstone River, plotting slightly above the envelope line that bounds the upper end of the data for other selected sites in the Northern Rocky Mountains. Sediment data were used to develop individual transport equations for seven size classes of sediment ranging from small cobbles to very fine sand. A step-wise regression procedure relating sediment discharge to important hydraulic variables showed that average stream velocity was the only significant variable at the 95-percent confidence level. Bedload and suspended-sediment data and equations indicate that more sand is transported for a given velocity than any other particle size, and very little sand-size sediment load is transported below an average stream velocity of about 2.5 feet per second. Transport of coarser-sized sediment (limited to bedload) becomes very little for an average velocity less than about 3.5 feet per second. Results for the 1999-2001 data-collection period indicate that sediment transport in the upper Yellowstone River tends to be limited more by the transport capacity of the stream (capacity or transport limited), than to the availability of sediment in the watershed (supply limited). Sediment data collected and analyzed were used to simulate sediment transport in the study reach using the BRIdge Stream Tube model for Alluvial River Simulation, or BRI-STARS computer model. The model was calibrated and verified using selected data from historical runoff periods. Simulated total-sediment loads, on a reach-averaged basis, were in good agreement with the total-sediment loads determined from the transport curve for the 2-year flood hydrograph but were considerably smaller for the total-sediment loads determined from the transport curve for the 50-, 100-, and 500-year flood hydrographs. The differences probably were largely due to the inability of the model to simulate streambank erosion, hillslope mass-wasting, and other channel-widening processes, which had supplied substantial quantities of sediment to the channel during the 1996 and 1997 floods, and probably continued to contribute to the sediment load in the subsequent years (1999-2001) when the data were collected. Furthermore, the transport curve was applied beyond the measured data for the highest discharges, and may thus be unreliable. Also, the transport curve derived from only limited data may not apply over the full duration of the hydrograph and sediment might be transported over only a portion of the hydrograph, especially for rivers like the upper Yellowstone where snowmelt runoff predominates. The true sediment discharge is, therefore, unknown and might be closer to the simulated values than to the values calculated from the transport curve. |
Report Cover
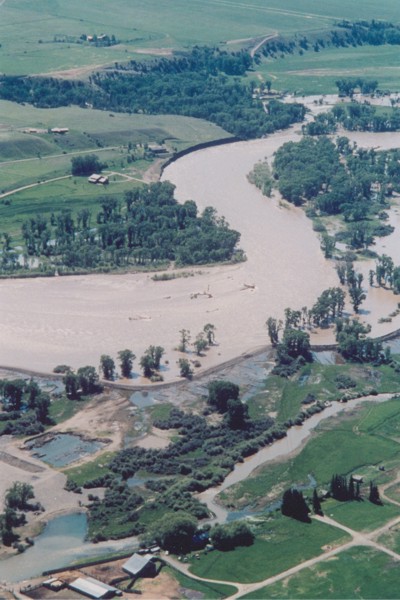
Flooding on the upper Yellowstone River, Montana, June 1997. View is looking southeast (upstream) about 5 miles upstream from Carter Bridge near Livingston, Montana. Aerial photograph by John Bailey, Livingston, Montana. Published with permission. |
After calibration and verification, the model was used to simulate baseline conditions for sediment transport during 2-, 50-, 100-, and 500-year floods assuming that there were no changes to conditions (1999-2001) involving channel-geometry, sediment-transport curves and equations, and existing highway bridge structures. The baseline simulations showed that the sediment load leaving the study reach is less than the sediment load entering the study reach for all synthetic-flood hydrographs, indicating a slight overall trend toward aggradation. The baseline simulations were then used to make relative comparisons with simulations for hypothetical river-management conditions. Several sets of hypothetical river-management conditions were analyzed to determine possible changes in sediment transport resulting from changes in river management in the study area including: structural changes at Carter and Pine Creek Bridges, a hypothetical levee placed upstream from Carter Bridge, and hypothetical channel-geometry changes involving river widening and narrowing. Simulations generally indicated that existing structures and hypothetical changes mainly affect sediment transport locally, with the effects diminishing to varying extents, upstream and downstream from where the changes were made.
Abstract
Introduction
Purpose and Scope
Background
Description of Study Area
Data Collection and Analysis
Cross Sections
Particle Counts and Sieve Analysis
Bedload
Suspended Sediment
Sediment-Transport Curves
Bedload-Transport Curve
Suspended-Sediment Transport Curve
Total-Sediment Transport Curve
Sediment-Transport Equations
Simulation of Sediment Transport
Description of the Sediment-Transport Model
Model Requirements
Cross-Section Data and Manning’s Roughness and Energy-Loss Coefficients
Synthetic-Flood Hydrographs
Bridge-Hydraulics Data
Sediment-Transport Information
Sediment-Transport Equations
Streambed-Material-Size Distribution
Active-Layer Thickness, Sediment-Routing Time Step, and Number of Stream Tubes
Sediment-Discharge Hydrograph at Upstream Boundary
Stage-Discharge Relation at Downstream Boundary
Model Calibration and Verification
Calibration and Verification for Hydraulic Conditions
Calibration and Verification for Sediment-Transport Conditions
Data Set for Model Calibration
Data Sets for Model Verification
Results of Simulations
Baseline Conditions for Simulated Sediment Transport
Hypothetical River-Management Conditions
Structural Changes to Carter and Pine Creek Bridges
Addition of a Levee near Carter Bridge
Channel Widening
Channel Narrowing
Study Limitations
Summary and Conclusions
References Cited
Figures
1. Map showing location of the study area, study reach, and cross sections on the upper Yellowstone River, Montana
2.-13. Graphs showing:
2. Recorded annual peak discharges compared to 100-year flood discharge for the Yellowstone River near Livingston, Montana
3. Flood-frequency curve for the Yellowstone River near Livingston, Montana
4. Statistical summary of particle-size distribution curves for streambed material at 40 cross sections on the upper Yellowstone River, Montana
5. Sediment-transport curve for bedload discharge for the Yellowstone River at Pine Creek Bridge, Montana, based on spring and summer runoff during 1999-2001 water years
6. Comparison of sediment-transport curves for bedload discharge at selected sites in the western United States to that for the Yellowstone River at Pine Creek Bridge, Montana
7. Comparison of bedload transport at bankfull discharge for selected sites in the western United States to that for the Yellowstone River at Pine Creek Bridge, Montana
8. Sediment-transport curve for suspended-sediment discharge for the Yellowstone River at Pine Creek Bridge, Montana, based on spring and summer runoff during 1999-2001 water years and data from a nearby station
9. Comparison of sediment-transport curves for suspended-sediment discharge at selected sites in the western United States to that for the Yellowstone River at Pine Creek Bridge, Montana
10. Comparison of suspended-sediment transport at bankfull discharge for selected sites in the western United States to that for the Yellowstone River at Pine Creek Bridge, Montana
11. Sediment-transport curve for total-sediment discharge for the Yellowstone River at Pine Creek Bridge, Montana, based on spring and summer runoff during 1999-2001 water years and data from a nearby station
12. Relation between average stream velocity and bedload discharge for sediment-size classes 1-4, upper Yellowstone River, Montana
13. Relation between average stream velocity and bedload discharge for sediment-size classes 5-6, and between average stream velocity and the combined bedload and suspended-sediment discharge for sediment-size class 7, upper Yellowstone River, Montana
14. Schematic diagram showing oblique view of channel cross sections and determination of subreach length for calculation of sediment transport in a subreach
15-19. Graphs showing:
15. Observed and synthetic hydrographs of daily mean discharge for conditions approximating the 100-year flood, Yellowstone River near Livingston, Montana
16. Comparison of simulated and measured streambed elevations at the cableway section for the Yellowstone River near Livingston, Montana
17. Comparison of simulated and measured streambed elevations at the cableway section for the Yellowstone River near Livingston, Montana
18. Comparison of simulated and measured streambed elevations at XS-52 in the upper Yellowstone River, Montana
19. Comparison of simulated and calculated sediment load transported through the upper Yellowstone River study reach, Montana
20. Schematic diagram showing oblique view of channel subreach and sediment-mass balance in the subreach
21-23. Graphs showing:
21. Simulated total-sediment load transported through the study reach for the 2-, 100-, and 500-year synthetic-flood hydrographs, upper Yellowstone River, Montana
22. Simulated unit degradation and aggradation through the study reach accumulated over the duration of the 2- and 100-year synthetic-flood hydrographs, upper Yellowstone River, Montana
23. Degradation and aggradation indicated by channel-geometry measurements at the cableway section before, during, and after the 1997 flood, upper Yellowstone River, Montana
24. Boxplots showing variation of average simulated channel degradation at simulated peak discharge and average simulated channel aggradation at end of simulation period at 40 cross sections for the 2-, 50-, 100-, and 500-year synthetic-flood hydrographs, upper Yellowstone River, Montana
25. Boxplots showing variation of the differences in simulated water-surface elevation between fixed-bed mode and mobile-bed mode for 2-, 50-, 100-, and 500-year synthetic-flood hydrographs at 40 cross sections, upper Yellowstone River, Montana
26-29. Graphs showing:
26. Simulated total-sediment load transported near Carter Bridge accumulated over the duration of the 2-, 50-, 100-, and 500-year synthetic-flood hydrographs, upper Yellowstone River, Montana
27. Simulated unit degradation and aggradation near Carter Bridge accumulated over the duration of the 2-, 100-, and 500-year synthetic-flood hydrographs, upper Yellowstone River, Montana
28. Simulated net unit sedimentation equal to net unit degradation or aggradation near Carter Bridge accumulated over the duration of 2-, 100-, and 500-year synthetic-flood hydrographs, upper Yellowstone River, Montana
29. Simulated net unit sedimentation equal to net unit degradation or aggradation near Carter Bridge accumulated over the duration of 100-year synthetic-flood hydrograph, upper Yellowstone River, Montana
30. Aerial photograph showing natural flow constriction and selected cross sections near Pine Creek Bridge, upper Yellowstone River, Montana
31-33. Graphs showing:
31. Simulated unit degradation and aggradation near Pine Creek Bridge accumulated over the duration of the 2- and 100-year synthetic-flood hydrographs, upper Yellowstone River, Montana
32. Simulated-streambed elevations at Pine Creek Bridge for the peak discharge during the 100-year synthetic-flood hydrograph with different bridge openings
33. Maximum water-surface and simulated streambed profiles for the 100-year synthetic flood at Pine Creek Bridge for different bridge openings, upper Yellowstone River, Montana
34. Aerial photograph showing the location of hypothetical levee on right bank and selected cross sections near Carter Bridge, upper Yellowstone River, Montana
35-37. Graphs showing:
35. Simulated unit degradation and aggradation near Carter Bridge accumulated over the duration of the 100-year synthetic-flood hydrograph with and without a levee, upper Yellowstone River, Montana
36. Simulated net unit sedimentation equal to net unit degradation or aggradation near Carter Bridge accumulated over the duration of the 100-year synthetic-flood hydrograph, upper Yellowstone River, Montana
37. Simulated change in thalweg elevation at XS-58 for the 50-, 100-, and 500-year synthetic-flood hydrographs with and without a levee, upper Yellowstone River, Montana
38. Photographs showing streambank erosion and mass wasting from the 1996 and 1997 floods, upper Yellowstone River, Montana
39. Photograph showing location of XS-60 and XS-61 used to simulate channel widening and narrowing in a long reach, upper Yellowstone River, Montana
40-42. Graphs showing:
40. Simulated unit degradation and aggradation from XS-61.8 to XS-59 accumulated over the duration of the 100-year synthetic-flood hydrograph with and without channel widening at XS-60 and XS-61, upper Yellowstone River, Montana
41. Simulated channel geometry at XS-60 for the peak of the 100-year synthetic-flood hydrograph for existing channel width and channel widening of 25, 50, and 100 feet, upper Yellowstone River, Montana
42. Simulated channel geometry at XS-61 for the peak of the 100-year synthetic-flood hydrograph for existing channel width and channel widening of 25, 50 and 100 feet, upper Yellowstone River, Montana
43. Photograph showing location of XS-65.5, XS-65.5A, and XS-65.5B used to simulate channel narrowing in a short reach, upper Yellowstone River, Montana
44-48. Graphs showing:
44. Simulated channel geometry at XS-60 for the peak of the 100-year synthetic-flood hydrograph for existing channel width and channel narrowing of 25 and 50 feet, upper Yellowstone River, Montana
45. Simulated channel geometry at XS-61 for the peak of the 100-year synthetic-flood hydrograph for existing channel width and channel narrowing of 25 and 50 feet, upper Yellowstone River, Montana
46. Simulated unit degradation and aggradation from XS-61.8 to XS-58.5 accumulated over the duration of the 100-year synthetic-flood hydrograph with and without channel narrowing at XS-60 and XS-61, upper Yellowstone River, Montana
47. Simulated channel geometry at XS-65.5 for the peak of the 100-year synthetic-flood hydrograph for existing channel width and channel narrowing of 25, 50, and 100 feet, upper Yellowstone River, Montana
48. Simulated channel geometry for the peak of the 100-year synthetic-flood hydrograph for existing channel width at XS-65.5 and channel narrowing of 25, 50, and 100 feet at XS-65.5, upper Yellowstone River, Montana
Tables
1. Sediment-size classification used for upper Yellowstone River, Montana
2. Particle-size distribution for suspended sediment, Yellowstone River at Pine Creek Bridge, Montana
3. Threshold values of streamflow and average channel velocity for initiation of bedload transport for selected sediment-size classes, Yellowstone River at Pine Creek Bridge, Montana
4. Sediment-transport equations for upper Yellowstone River based on sediment and hydraulic data, Yellowstone River at Pine Creek Bridge, Montana
5. Instantaneous-peak and maximum daily mean discharges used to develop synthetic-flood hydrographs, Yellowstone River near Livingston, Montana
6. Comparison of simulated water-surface elevations to water-surface elevations based on stage-discharge relations for selected peak discharges at Yellowstone River near Livingston, Montana
7. Physical data for cross sections in the study reach
| AccessibilityFOIAPrivacyPolicies and Notices | |
 |
|