Use of Sediment Rating Curves and Optical Backscatter Data to Characterize Sediment Transport in the Upper Yuba River Watershed, California, 2001–03
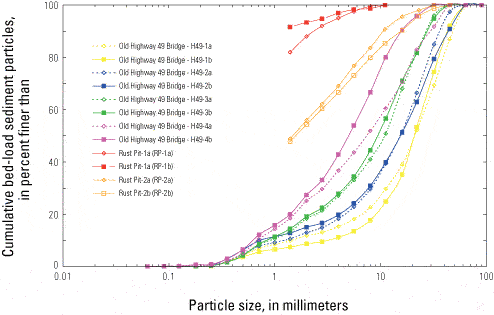
Figure 15
Cumulative grain-size distributions for bed-load samples collected on Shady Creek, a tributary to the South Yuba River in the upper Yuba River watershed, California.
The fraction of the bed-load sample from Rust Pit consisting of grains less than 1.4 millimeter was not sieved. Paired samples are indicated by matching colors. The order of collection of the pairs is indicated by “a” and “b” labels. See
figure 6 for site locations and
table 5 for information about paired samples.