
Figure 3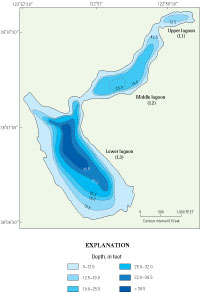
Bathymetry of upper, middle, and lower lagoons in Abbotts Lagoon at water surface elevation of 15.0 feet mean sea level (MSL).
Revised from Anima, 1991.
Figure 4
Volume versus stage relationships for the upper, middle, and lower lagoons in Abbotts Lagoon.
Figure 5
Hourly stage and volume for the upper, middle, and lower lagoons in Abbotts Lagoon from March 29 to July 27, 2000.
Figure 6
Mean daily streamflow in tributary T1 in Abbotts Lagoon watershed, and daily precipitation and evaporation, for water years 1999 and 2000.
Figure 7
Hourly streamflow in tributary T1 in Abbotts Lagoon watershed and instantaneous streamflows at time of sampling for other tributary sites, and sample collection times and hourly precipitation for February 5–16, 1999, and April 6–15, 1999.
The vertical gray bar in the center of the graph represents a break in the graph.
HydrologyInflow – Outflow = Change in Storage (1)
The hydrology of Abbotts Lagoon watershed has a big effect on the water quality in the three lagoons. To improve our understanding of water quality in the lagoons, we first present an estimated water budget. As part of this exercise, we instrumented the two lower lagoons (L2 and L3) with water-level recorders and the perennial tributary (T1) with a streamflow gage (fig. 1). We also obtained precipitation and evaporation data for nearby sites operated by the National Weather Service and the Marin Municipal Water District, respectively (fig. 1).
Abbotts Lagoon is normally a freshwater lagoon, separated from the Pacific Ocean by a narrow strip of beach. However, this sand berm is occasionally breached during winter or early spring following several precipitation-runoff events in the watershed or during times of high tides and waves in the ocean. Since 1982, breaches occurred in February 1986, January and March of 1995, and twice in 1998 (Michael Lighthiser, 1998, unpub. term paper, University of California, Berkeley). During this study, a breach was reported to the lead author by a frequent visitor to the Abbotts Lagoon foot trail. The visitor reported that a breach occurred at the end of March 1999 during a period of high waves. The visitor observed a wave of seawater moving through the breach into L3 and past the footbridge separating L3 and L2. The visitor noted that the wave eroded some of the sand dunes along L2 that are directly north of the footbridge. The visitor estimated that the breach closed within about a week. The breach probably occurred early in a storm on March 24 that had sustained northwest winds of over 30 mi/h for 10 h and peak gusts up to 53 mi/h at the National Weather Service weather station just south of Abbotts Lagoon (see precipitation site on figure 1; data from the California Data Exchange Center website at http://cdec.water.ca.gov for the site coded as “PTR” accessed on February 3, 2004). The breach closed before April 1, when the lead author visited Abbotts Lagoon. We know that water levels were high in the lagoons during this period, and the strong northwest winds probably created big ocean waves that could erode the sand berm at the ocean end of L3.
Although our information is incomplete to adequately define a water budget for Abbotts Lagoon for the entire study period, some components were measured for parts of the study period. An attempt will be made here to estimate what is known about the water budget for specific periods of time. The most basic expression of a water budget is:
A completely unknown component of either inflow or outflow is ground water. To avoid the unknown of surface flows between the three lagoons (that is, from L1 to L2 and from L2 to L3), the water budget was performed on all three lagoons as if they were one lagoon. An essential part of the water budget is the development of suitable stage versus volume relations for the lagoons to directly measure change in storage in equation 1. This task required revising the bathymetric map produced by Anima (1991).
Change in Storage
Because the Anima (1991) bathymetric map does not have a water-surface elevation (mean sea level, MSL) reference point, we used observations and a survey to estimate a MSL for the map. This MSL is relative to the North American Vertical Datum of 1988 (NAVD 88). The lead author was at Abbotts Lagoon on April 1, 1999, after the breach had closed and observed a high-water line near the footbridge that was 5 in. above the water surface level on April 1. The water level in L2 (and L3 since they were at the same level) on April 1 was 6 in. below the bottom of the footbridge that was surveyed by transit on February 13, 2004, by the USGS as 14.94 ft MSL. Thus, the breach on March 24, 1999, occurred at a water surface elevation of close to 15.0 ft MSL. This was considered to be the full condition for L1, L2, and L3 for development of a bathymetric map and stage versus volume relations.
Water depths at the time of sampling are included in Saiki (2000). On February 27, 1999, maximum depths in L1 of 10.1 ft and in L2 of 24.0 ft were reported (Saiki, 2000). No maximum depths were reported for L3 because of high winds. The transects used to develop the bathymetric map are shown in Anima (1991). The maximum depths shown in the transects are 6.0 ft in L1, 19.0 ft in L2, and 31.5 ft in L3. However, in the bathymetric map, Anima (1991) shows a maximum depth in L1 of 2 m (6.5 ft) and in L3 of 10 m (32.5 ft). We assumed that Anima (1991) used some additional information (for example, scuba diving observations for L3) to revise the maximum depths for L1 and L3. Thus, at the elevation of his bathymetric map, Anima (1991) had the following maximum depths: L1 (6.5 ft), L2 (19.0 ft), and L3 (32.5 ft).
Although Saiki (2000) noted that water levels in the lagoons were very high on February 27, 1999, there was no indication of how high relative to the MSL. Also, it is not clear if the three lagoons were at the same elevation at the time. With reference to a breach early in the March 24, 1999, storm, a water budget for February 28 to March 23, 1999, indicates that the lagoons (in total) increased in storage by at least 363 acre-ft. This is based on an average flow of 6.9 ft3/s in T1, a total evaporation of 0.82 in., and precipitation of 2.88 in. (not including the March 24–25, 1999, storm) for the 24 days. This increase in storage of 363 acre-ft would raise the elevation of Abbotts Lagoon by 1.73 ft overall. Assuming that L3 was still slightly lower than L1 and L2 at the beginning of the February 28, 1999, to March 23, 1999, period, L1 and L2 would be raised by 1.5 ft and L3 by about 1.8 ft. The depth readings by Saiki (2000) on February 27, 1999, indicate the relationship to Anima depths for L1 and L2, although they are not very exact because they only represent one point on the lagoon, whereas Anima (1991) used transects across the lagoons. Also, Saiki (2000) was not able to measure a depth for L3 on February 27, 1999. So, assuming that L1 and L2 rose by 1.5 ft from February 27 to March 24, 1999, the depths on March 24 at the time of the breach would be about 11.6 ft for L1 and about 25.5 ft for L2.
Because we assume that all three lagoons are at the same elevation in Anima (1991) and also on March 24, 1999, before the breach, we increased the depth data from Anima (1991) for all lagoons by 6.0 ft. This means maximum depths at a water elevation of 15.0 ft MSL of 12.5 ft in L1, 25.0 ft in L2, and 38.5 ft in L3. This means that the Anima (1991) bathymetric map represents depths for a water elevation of 9.0 ft MSL. Thus, we adjusted the Anima (1991) bathymetric map to show water depths at full (15.0 MSL) and these are 6.0 ft (1.85 m) deeper than shown on the original map. We added 6.0 ft to the original contours and added a 25.0-ft contour for L2 to account for a deeper spot in the lower portion of L2 that was identified in Anima (1991) transect K-K’ and in the February 26, 1999, sampling by Saiki (2000) (fig. 3). We then used the revised bathymetric map to define a complete stage versus volume relationship for L1, L2, and L3 (fig. 4). The new maximum depths (at 15.0 MSL) for the lagoons are as follows: L1 (3.85 m, 12.5 ft), L2 (7.69 m, 25.0 ft), and L3 (11.85 m, 38.5 ft). The range of stages for the lagoons are: L1 (2.5 to 15.0 ft MSL), L2 (–10.0 to 15.0 ft MSL), and L3 (–23.5 to 15.0 ft MSL).
On the Anima (1991) transect K-K’ at a MSL of 9.0 ft, it appears that the connections between L1 and L2 and between L2 and L3 are severed at any water-surface elevation below 9.0 ft (that is, the lowest point on the berms between the lagoons is about 9.0 ft MSL). This explains why the water depth in L1 was consistently around 6 ft during our sampling. When the water level in L2 drops below the water level of L1, water from L1 flows to L2, thus keeping the water level in L1 at around 9.0 ft MSL. The depth in L1 does not drop much below this because of the inflow from T1 into L1 offsetting some evaporation losses. When the water surface elevation of L2 drops below 9.0 ft MSL, it will stop spilling into L3 at the footbridge.
Continuous water-level recorders (Global Water WL-14 model) were initially installed in 2.5-in. polyvinyl chloride (PVC) pipe at sites A and B on March 2, 2000. With reference to results from a February 13, 2004, USGS survey of the PVC pipes (and tapedown measurements on the pipes and on a staff pipe at L2), the initial water levels at sites A and B were 11.87 and 11.40 ft MSL, respectively. However, the recorder at site A became buried in sediment by March 8 and started giving unreliable measurements. The recorder was raised out of the sediment on March 29 at 1300 and the data became reliable. At the start of a reliable record of stage at sites A and B (fig. 1) on March 29 at 1300, the water levels at the sites were 12.41 and 12.09 ft MSL, respectively. Using these starting water levels, continuous stage and volumes for L1, L2, and L3 for March 29 to July 27, 2000, were measured (fig. 5).
InflowsInflow – Outflow = Change in Storage (1) Surface Inflow = Change in Storage + Evaporation – Precipitation (2)
Inflows to Abbotts Lagoon include several small tributaries and drainages, precipitation on the surface of the lagoon, and possibly ground-water contributions. Total precipitation at the National Weather Service precipitation site just south of the Abbotts Lagoon drainage basin (fig. 1) during water years 1999 and 2000 was 47.17 in.; 27.31 in. in water year 1999, and 19.86 in. in water year 2000 (fig. 6; data from the California Data Exchange Center website at http://cdec.water.ca.gov for the site coded as “PTR” accessed on January 23, 2003). Missing precipitation data for October 1–29, 1998, at the National Weather Service site was filled in with precipitation data from the NPS Point Reyes National Seashore Headquarters about 2 mi south of Point Reyes Station (fig. 1), adjusted by the ratio of annual precipitation for water year 1999 of 0.64 (with the National Weather Service site having lower precipitation) (Brannon Ketcham, National Park Service, written commun., 2001). Streamflow in T1 is strongly controlled by precipitation and it is essentially zero during much of the summer and fall months (fig. 6). The storm runoff response of T1 is very quick (within a few hours) and streamflow generally returns to close to prestorm levels within a couple of days (fig. 7). Except for T7, streamflows at T1 during the two sampled storms were at least five times greater than at the other tributary sites (fig. 7). The streamflows at T7 during the February 1999 storm were about half to two-thirds the streamflows at T1. This is consistent with drainage basin size; T7 has the second largest drainage basin after T1.
The relationship of T1 flows to total surface inflows to Abbotts Lagoon can be estimated over the time period of a storm and the resulting change in storage if we assume that ground water inflow–outflow over this short time period is insignificant compared with surface flows. The best storm for this purpose was the 1.81 in. of rain that fell on April 16–17, 2000, and the resulting runoff in T1 with a peak instantaneous streamflow of 29 ft3/s on April 16 at 11 p.m. The total surface inflow can be solved for using equation (2), developed as follows:
Where,
Inflow≡ Surface inflow + Precipitation
Outflow ≡ Evaporation
Streamflows in T1 and storage in L2 and L3 increased on April 16 at 10 a.m. and stabilized by 3 a.m. on April 18. Thus, equation 2 will be solved for this 41-h period. The total inflow in T1 during this period was 40.8 acre-ft. The precipitation (1.81 in.) and evaporation (0.06 in.) from the 210-acre surface of Abbotts Lagoon amounts to 31.7 and 1.1 acre-ft, respectively. The change in storage over the time period was 2.4 acre-ft in L1, 19.7 acre-ft in L2, and 56.7 acre-ft in L3 (fig. 5). Using equation (2), this would mean a total surface inflow of 48.2 acre-ft. Thus, the T1 inflow during this storm was 85 percent of the total surface inflow to Abbotts Lagoon.
Although this method shows that T1 is the most significant surface inflow to Abbotts Lagoon, it is not the only significant source of surface inflows during winter storms. The flows in T7 during the February 1999 storm sampling were more than half the flows in T1 (fig. 7). Many of the flows during storms depend on the freeboard in upstream storage ponds and the stage of growth of vegetation upstream of the site. Flows in T2, T4, T6, and T7 are dependent upon the freeboard in stock watering ponds in the drainage upstream prior to the storm. The flows in T5 during the February 1999 storm sampling were much greater when the vegetative growth in the drainage was dormant, compared with the April 1999 storm sampling when vegetative growth was very active.
Outflows
Outflows from Abbotts Lagoon include evaporation from the lagoon surface and, possibly, ground-water seepage. Evaporation from the surface of Abbotts Lagoon was estimated from pan evaporation data from Marin Municipal Water District (Randy Arena, Marin Municipal Water District, written commun., 2001) for Nicasio Reservoir, about 10 mi to the southeast (fig. 1). The data at the pan evaporation site was assumed to represent Abbotts Lagoon. In reality, there are two offsetting effects on the conversion of evaporation rates from Nicasio Reservoir to Abbotts Lagoon: (1) more fog at Abbotts Lagoon that would decrease evaporation relative to Nicasio Reservoir and (2) higher winds at Abbotts Lagoon that would increase evaporation relative to Nicasio Reservoir. Annual evaporation rates at Nicasio Reservoir were 32.7 in. in water year 1999 and 32.4 in. in water year 2000. Summer evaporation rates at Nicasio Reservoir averaged about 0.17 in. per day (June through August) and winter rates about 0.02 in. per day (December through February; fig. 6). Missing and questionable data for 156 days at the Nicasio Reservoir site were filled in with interpolated data that accounted for the ratio of Nicasio Reservoir data to evapotranspiration data from a California Department of Water Resources weather station near Novato (about 20 mi east of Abbotts Lagoon, fig. 1; data from a Center for Irrigation Technology website accessed on November 22, 2003, at http://www.wateright.org/site2/reference/cimisdist.asp for Novato site).
Ground WaterInflow – Outflow = Change in Storage (1) Ground-water Inflow – Ground-water Outflow = Change in Storage + Evaporation (3)
Ground-water interactions with Abbotts Lagoon could be inflows, outflows, or both. The best opportunity to evaluate net ground-water flow would be when no surface inflows occur. At this time, the net ground-water flow is a function of only the change in storage and evaporation:
Where,
Inflow ≡ Ground-water inflow
Outflow ≡ Ground-water outflow + Evaporation
The best time period during our study to estimate net ground-water flow is from June 11 through July 27, 2000. We have data on change in storage in L1, L2, and L3, and there was no precipitation and no surface flows to Abbotts Lagoon according to recorded flows of T1. With this information we can estimate the net ground-water flow using equation (3).
Evaporation from Abbotts Lagoon (using the data for Nicasio Reservoir) during the June 11 through July 27, 2000, period was 7.16 in. For the 210-acre surface area of Abbotts Lagoon, this amounts to 125.2 acre-ft. Change in storage over this time period in L1 (–1.7 acre-ft), L2 (–13.3 acre-ft), and L3 (–135.9 acre-ft) was a decrease of 150.9 acre-ft. Thus, the net ground-water contribution to the water budget would be an outflow from Abbotts Lagoon to the ground water (seepage) of 25.7 acre-ft. This amounts to an average outflow (seepage) rate for the ground water of about 0.3 ft3/s.

