
Figure 5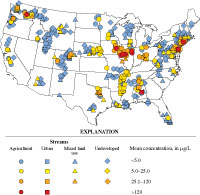
Measured dieldrin concentrations in fish at NAWQA sites, excluding sites with the highest and lowest 10 percent of lipid levels.
The 514 sites plotted have 2.3–10.4 percent lipid content. µg/L, microgram per liter.
Figure 6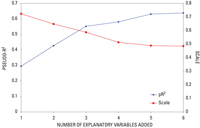
Effect of adding explanatory variables to the regression model for dieldrin in whole fish on the model’s pseudo-R2 and scale values.
Figure 7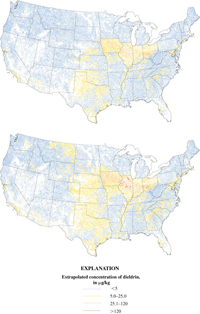
Predicted dieldrin concentrations in whole fish for U.S. streams at (A) 4.2 percent lipid content (largemouth bass) and (B) 6.2 percent lipid content (all fish taxa).
Figure 8A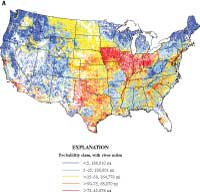
Probability of streams having whole-fish samples that exceed (A) 5 µg/kg (which is the reporting level for dieldrin in whole fish and also corresponds to an EPA screening value at a cancer risk of 1:50,000) and (B) 25 µg/kg (which corresponds to the EPA screening value at a cancer risk of 1:10,000)
In both maps, whole-fish samples are assumed to have 4.2 percent lipid content (the mean value for largemouth bass sampled by the NCBP and NAWQA programs combined). The EPA screening values apply to edible fish tissue. mi, mile; µg/kg, microgram per kilogram.
Figure 8B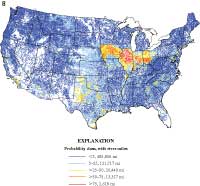
Continued.
Figure 9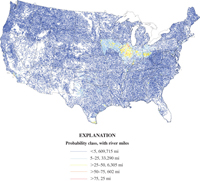
Probability of streams having whole-fish concentrations greater than 120 µg/kg, which is the New York criterion for protection of fish-eating wildlife (noncancer effects) from Newell and others (1987).
Whole-fish samples are assumed to have 6.2 percent lipid content (the mean value for all whole fish sampled by the NCBP and NAWQA programs combined). mi, mile; µg/kg, microgram per kilogram.
Results and Discussion
The model development data set contains data for 59 different fish taxa at 648 stream sites. Site locations and measured dieldrin concentrations in whole fish are shown in figure 5. However, sites with the highest and lowest 10 percent of lipid levels were excluded from figure 5 so that the range of lipid levels shown (2.3–10.4 percent, for n = 514 sites) more closely approximates the lipid levels used in the nationwide extrapolations.
Regression Model for Dieldrin in Whole Fish
The explanatory variables included in the dieldrin fish model, as well as their transformations and coefficients, are summarized in table 3.
Table 3
(View this table on a separate page.)
Explanatory variables and coefficients for the regression model for dieldrin in whole fish.
[—, none; lb/mi2, pound per square mile]
[—, none; lb/mi2, pound per square mile]
| Explanatory variable | Transformation | Coefficient | p-value |
|---|---|---|---|
| Fish lipid content (%) | Logarithmic | 1.0542 | 1.32E–21 |
| Aldrin–dieldrin use in agriculture, per basin area (lb/mi2) | — | 0.0733 | 7.91E–26 |
| Forest land (% of basin) | Square root | –0.0829 | 5.18E–16 |
| Urban-termite score | Logarithmic(x + 1) | 0.5406 | 2.91E–27 |
| Organic matter content of basin soils (average %) | Logarithmic | –0.4838 | 2.94E–10 |
| Southern Plains region | Binary group variable (1/0) | 0.2714 | 0.0146 |
| (Intercept) | — | –0.1674 | 0.132 |
Analysis of Significant Explanatory Variables
The first four and most important explanatory variables in the model have reasonable relations to dieldrin concentrations in fish, in terms of their relative importance and the direction of their influence. The measured lipid content is positively related to dieldrin concentration in fish, which is consistent with the tendency of organochlorine pesticides to accumulate in fat tissue. Coefficients are positive for agricultural use of aldrin and dieldrin and the urban-termite score (representing historical use in agriculture and termite control, respectively), and negative for the variable representing forested land in the basin (where use would have been minimal). Together these four variables explain 58 percent of the variability in dieldrin concentrations measured in fish (fig. 6).
The addition of two more variables, soil organic matter and the Southern Plains regional variable, made a modest improvement in model performance. The final model explains 64 percent of the variability in dieldrin concentrations in whole fish, and the scale parameter (standard deviation of the residual error) for the final regression is 0.485 (fig. 6). The last two variables are significantly, though weakly, correlated with the response variable. Because these variables explain relatively little of the variability, possible reasons for their influence on the response variable are speculative. The soil organic matter variable has a negative coefficient, and multiple explanations are possible. High values for soil organic matter may be associated with either or both (1) reduced transport of contaminated soil to streams and (or) (2) a higher organic carbon content in stream sediment, which would tend to have a higher fraction of dieldrin sorbed to sediment and a correspondingly lower fraction in water, which could in turn decrease uptake by fish. The first possible explanation is supported by the observation that, in data from the STATSGO database for NAWQA fish sampling sites, mean soil organic matter is positively correlated with mean soil permeability. In support of the second possible explanation, the logarithm of the dieldrin concentration measured in fish is also negatively correlated (p < 0.05) with the logarithm of the measured organic carbon content of streambed sediment collected at the same sites.
The Southern Plains regional variable has a positive coefficient, indicating that without this variable, the regression model would tend to underestimate dieldrin concentrations in fish in the Southern Plains region (Texas and Oklahoma). The reason for this underestimation is not known. However, in this region, aldrin and dieldrin were used in agriculture (especially on cotton), as well as in urban applications (the eastern parts of Texas and Oklahoma are in the zone of heaviest termite density). Of the NAWQA sites sampled in the Southern Plains region, the highest dieldrin residues in fish were from the Trinity River Basin study unit in eastern Texas—especially at sites in large basins with mixed (agricultural and urban) land use—whereas dieldrin was low or not detected at strictly agricultural sites in this study unit. Although not conclusive, this suggests that urban use (rather than agricultural use) of aldrin and dieldrin in this area may have been underestimated by the use terms in the regression model. In fact, most urban sites in the Trinity River Basin are located in the moderate-to-heavy zone of termite density, but very near (just outside) the boundary of the very-heavy termite zone (fig. 2); so, it is possible that the weighted termite-urban score may under-represent past termiticide use in these urban areas. Because this regional variable explains very little of the variability (about 1 percent), the apparent regional bias is slight and the explanation for it is speculative.
Extrapolation to Unmonitored Streams
The regression model developed here can be used for spatial extrapolation to streams that have not yet been assessed by direct measurements, because the model is based on certain characteristics of each hydrologic system, such as estimated historical pesticide use and soil characteristics within the basin, for which data or estimates are available for the entire nation. This approach to extrapolation is fundamental to extending the targeted local and regional studies of NAWQA to a comprehensive national assessment (Gilliom and others, 2006).
The results of spatial extrapolation to all United States streams are shown in figure 7, which maps the dieldrin concentration in composite whole fish predicted by the model, for whole fish with a lipid content of (A) 4.2 percent and (B) 6.2 percent. As noted previously, lipid content is not available from a nationwide data set, as are the other explanatory variables, and therefore default lipid values have been assumed that are appropriate to the objectives of the extrapolations. These maps show the spatial distribution of the best or most likely concentrations of dieldrin in composite whole-fish samples (for each of the specified lipid contents).
In figure 7, unmonitored streams are color coded to correspond to different concentration ranges for the predicted dieldrin concentration in whole fish (at the lipid content specified in the figure). A single set of color-coded dieldrin concentration ranges is used in both maps, and the boundary concentrations defining these ranges correspond to specific dieldrin guidelines for either human health or wildlife. The highest concentration category (>120 µg/kg) is defined by the New York guideline for protection of fish-eating wildlife (Newell and others, 1987). The lowest category consists of streams predicted to have dieldrin whole-fish residues below the reporting limit (<5 µg/kg), and the two middle categories are defined in relation to EPA screening values for consumption of edible fish or shellfish (U.S. Environmental Protection Agency, 2000). Specifically, the 5–25 µg/kg category is defined at the lower end by the reporting limit (5 µg/kg), which is associated with a cancer risk of 2 in 100,000 (or 1:50,000). (Note that the EPA recommended screening value at a 1:100,000 cancer risk is 2.5 µg/kg, which is lower than NAWQA was able to reliably quantitate in fish.) For the 25–120 µg/kg category, all sites have predicted values greater than the EPA screening value at a 1:10,000 cancer risk (25 µg/kg). These predictions are discussed further below in relation to potential significance to human health and wildlife.
Because the response variable is a logarithmic transformation, concentrations predicted by the model (after retransformation) are median concentrations expected for a given set of explanatory values. This means that, for sites with the identical predicted dieldrin concentration, the actual concentrations are expected to be greater than the predicted value (for a given lipid content) at half of the sites, and lower than predicted at half of the sites. In figure 7, therefore, actual concentrations (for composite whole-fish samples) at half the sites are expected to exceed the predicted values. Uncertainty in model predictions is discussed below in the context of human health and wildlife guidelines.
Because fish lipid content (a measured parameter) is a variable in the model and has a positive coefficient, predicted dieldrin concentrations will increase as fish lipid content increases. This is illustrated by comparing predictions for 6.2 percent lipid (fig. 7B) with predictions for 4.2 percent lipid (fig. 7A). The extrapolation at 6.2 percent lipid (fig. 7B) has fewer blue streams, and more yellow, orange, and red streams than the extrapolation at 4.2 percent lipid (fig. 7A). Whole fish with a lipid content greater than 6.2 percent would be predicted to have still higher dieldrin concentrations than those shown in figure 7B, and whole fish with a lipid content less than 4.2 percent would be expected to have lower concentrations than those shown in figure 7A. As a point of reference, the average whole-fish lipid content in NAWQA and NCBP fish samples for some additional species are lake trout, 15 percent; channel catfish, 7.5 percent; common carp, 6.5 percent; smallmouth buffalo, 6.5 percent; white sucker, 5.8 percent; yellow perch, 4.3 percent; sculpins, 3.8 percent; and bluegill, 3.1 percent.
Significance to Human Health
NAWQA fish data were not collected with the intention of assessing potential effects on human health from consumption of contaminated fish. Instead, NAWQA’s primary fish sampling objective was to assess the occurrence and geographic distribution of hydrophobic contaminants in streams, and the fish sampling methods were designed accordingly. Two aspects of the NAWQA study design detract from the usefulness of NAWQA fish data in the assessment of human exposure and health risk. First, NAWQA analyzed whole-body residues, whereas people generally consume only the edible portion (fillet or muscle tissue), and second, many of the fish taxa collected are bottom feeders that are not commonly consumed by people. Nonetheless, careful data analysis will allow some inference with respect to potential human health effects.
It is not necessarily straightforward to predict how residues of organochlorine pesticides will compare in a whole-body bottom feeder versus a game-fish fillet, because two factors (fish taxon and fish tissue type) have changed. In its National Study of Chemical Residues in Fish, EPA measured bioaccumulative chemicals in whole-body bottom-feeders and game-fish fillets, and found that the relative magnitude of residues in each depended on the specific chemical being measured (U.S. Environmental Protection Agency, 1992b). Of the organochlorine pesticide chemicals measured, some (including dieldrin, oxychlordane, and DDE) were present in roughly the same average concentrations in game-fish fillets as in whole-body bottom-feeders, whereas others (including chlordane, nonachlor, and heptachlor epoxide) had higher average concentrations in whole-body bottom feeders than in game-fish fillets.
These findings suggest that, with caveats, NAWQA whole-fish data can be compared with EPA screening values for edible fish consumption in a screening-level assessment—such as in deciding whether and where to conduct future dieldrin monitoring in game-fish fillets. For example, in streams where dieldrin residues in whole fish are found (or predicted) to be high, there exists some potential for concentrations in edible game fish to be high as well. Therefore, if such streams are frequented by sport or subsistence fishermen, this suggests that additional sampling and analysis of game-fish fillets from these streams may be warranted. Conversely, where dieldrin residues in whole fish are low or undetected, concentrations in edible fish tissue are also likely to be low—allowing for differences that are due to species and (or) lipid content.
To assess relevance to human health, the regression model was used to predict dieldrin concentrations in whole fish, assuming a 4.2 percent lipid content (to represent the average lipid content of whole-body largemouth bass), in unmonitored streams. As noted previously, the 4.2 percent lipid value pertains to whole-body largemouth bass, whereas the EPA screening values for fish consumption apply to the edible portion of the fish, which tends to have a lower lipid content. Data from EPA’s National Study for Chemical Residues in Fish indicate that lipid levels in bass fillets average 0.84 percent, or about one fifth the content of whole-body largemouth bass sampled by the NCBP and NAWQA programs (U.S. Environmental Protection Agency, 1992b). Therefore, the comparison shown in figure 7A represents a worst-case assessment at the 4.2 percent lipid level from the perspective of human health. For fish with a higher lipid level, such as lake trout (with an average whole-body lipid content of 15 percent), whole-body dieldrin concentrations would likely be much higher than the whole-body concentrations calculated at the 4.2 percent lipid level (and shown in fig. 7A). We cannot make specific predictions about dieldrin concentrations in edible fish tissues for largemouth bass, lake trout, or any other taxon because the data required to make such predictions were not collected.
In figure 7A, dieldrin concentrations in whole fish from the dark-blue streams are predicted to be less than the reporting limit (5 µg/kg) for the method NAWQA used to analyze for dieldrin in fish. In edible fish tissue, a concentration less than 5 µg/kg would correspond to a cancer risk level of less than 1 in 50,000. Because dieldrin concentrations in edible fish are expected to be even lower than those in whole fish, the dark blue streams are likely to have median dieldrin concentrations in edible fish tissue that are below the EPA screening value at 1:50,000 cancer risk.In figure 7A, streams with predicted dieldrin concentrations greater than 25 µg/kg (red and orange shaded streams) are mostly concentrated in the Corn Belt, with scattered patches in Texas, the southeast, urbanized parts of the northeast, and California. If measured in edible fish tissue, dieldrin concentrations greater than 25 µg/kg would exceed the EPA recommended screening value for 1 in 10,000 cancer risk, and concentrations in the range of 5–25 µg/kg (yellow shaded streams) would exceed the EPA screening value for 1 in 50,000 cancer risk. Exactly what constitutes an acceptable maximum level of cancer risk is not clearly defined by EPA. Many state and EPA programs use a cancer risk level of between 1 in 100,000 and 1 in 1,000,000. Certainly, cancer risks exceeding 1:10,000 are higher than the maximum acceptable cancer risk levels used by most state and EPA programs (Nowell and Resek, 1994). Again, this comparison must be qualified because predicted dieldrin concentrations in whole fish probably overestimate concentrations in edible fish. In streams where whole-fish dieldrin concentrations are predicted by the model to exceed EPA screening values at 1:10,000 (red and orange streams) or 1:50,000 (yellow streams), it is not clear that concentrations in edible fish also would exceed screening values. However, for such streams that are actively fished, the extrapolation results can be used to guide future monitoring and assessment priorities for measuring dieldrin in the edible tissues of game fish.
Significance to Fish-Eating Wildlife
The extrapolation shown in figure 7B assumes a fish lipid content of 6.2 percent lipid (to represent the average lipid content of all whole fish, regardless of species). Because wildlife consume many fish species and typically eat the entire fish, it is appropriate to directly compare model predictions at 6.2 percent lipid with whole-fish guidelines for protection of wildlife.
The New York wildlife guideline used in this analysis (120 µg/kg dieldrin) is intended to protect fish-eating birds and mammals from adverse effects other than cancer, as noted previously. Relatively few streams are predicted to have median concentrations that exceed this dieldrin guideline (mapped in red in fig. 7B) and these few are in the Corn Belt, where past use of aldrin and dieldrin in agriculture was highest.
Uncertainty in Model Predictions
In the preceding model predictions, it is important to consider uncertainty, especially when comparing predicted concentrations with human-health or aquatic-life guidelines. In figures 7A and B, measured fish samples (at the appropriate lipid content) will have a 50 percent probability of exceeding the predicted concentration. For example, even for dark blue streams in figure 7A, where the predicted median concentration is <5 µg/kg, this means that 50 percent of streams are expected to have whole-fish concentrations greater than this predicted concentration, and some may in fact be greater than EPA screening values of 2.5 or even 25 µg/kg, which are associated with cancer risk levels of 1:100,000 and 1:10,000, respectively.
The maps in figures 8A and 8B and 9 help put this uncertainty into perspective by showing the probability of streams having whole-fish concentrations that exceed a specific guideline concentration. The maps in figure 8A and 8B assume a lipid content of 4.2 percent and relate to human health guidelines, whereas the map in figure 9 assumes a lipid content of 6.2 percent and relates to potential effects on fish-eating wildlife.
The maps in figure 8 show the probability of streams having whole-fish concentrations (at 4.2 percent lipid content) that exceed 5 µg/kg (fig. 8A) and 25 µg/kg for dieldrin (fig. 8B). For dark blue streams in figure 8A, whole-fish samples (with 4.2 percent lipid) have less than a 5 percent probability of exceeding 5 µg/kg; in other words, fewer than 1 out of 20 dark blue streams are expected to have whole-fish dieldrin concentrations greater than 5 µg/kg. In edible fish, a 5-µg/kg concentration would correspond to a maximum acceptable cancer risk of 1 in 50,000. Dark blue streams account for only 29 percent of total stream miles in the United States. The remaining 71 percent of total stream miles have at least a 5 percent probability of whole-fish concentrations exceeding 5 µg/kg. Of these streams, whole-fish concentrations are expected to exceed 5 µg/kg in more than 1 out of 20 light blue streams (>5 percent probability), more than 1 out of 4 yellow streams (>25 percent probability), more than half of orange streams (>50 percent probability), and more than 3 out of 4 red streams (>75 percent probability). Orange and red streams, which have at least a 50 percent probability of whole-fish concentrations exceeding 5 µg/kg, make up 17 percent of total river miles and are located mostly in the Corn Belt, parts of Texas and California, and scattered urban areas.
Far fewer streams are likely to have whole-fish samples (at 4.2 percent lipid) with dieldrin concentrations exceeding 25 µg/kg, as shown in figure 8B. In edible fish tissue, a concentration of 25 µg/kg would correspond to the EPA screening value at a cancer risk of 1:10,000. Here, most streams (75 percent of stream miles) are shaded dark blue and have less than a 5 percent probability of whole-fish concentrations exceeding 25 µg/kg. Of the remaining streams, more than 1 out of 20 light blue streams (>5 percent probability), more than 1 out of 4 yellow streams (>25 percent probability), more than half of orange streams (>50 percent probability), and more than 3 out of 4 red streams (>75 percent probability) are expected to have whole-fish concentrations that exceed 25 µg/kg. Orange and red streams account for only about 2 percent of total stream miles, and they are located mostly in the Corn Belt. Again, these maps show the probability of whole-fish samples exceeding the predicted concentrations—edible fish tissue is likely to have lower lipid levels and lower dieldrin concentrations than in the whole fish.
Figure 9 relates to potential effects on fish-eating wildlife. This map shows the probability of streams that have whole-fish concentrations (at 6.2 percent lipid content) greater than the New York wildlife guideline of 120 µg/kg. Most streams (about 94 percent of total stream miles) are shaded dark blue and have less than a 5 percent probability of whole-fish samples (at 6.2 percent lipid) exceeding 120 µg/kg—in other words, fewer than 1 out of 20 dark blue streams are expected to exceed the wildlife guideline. More than 1 out of 20 light blue streams (> 5 percent probability), more than 1 out of 4 yellow streams (>25 percent probability), more than half of orange streams (>50 percent probability), and 3 out of 4 red streams (>75 percent probability) are expected to exceed the New York wildlife guideline. Orange and red streams—for the most part located in the Corn Belt—account for less than 1 percent of total stream miles. Fish with a lipid content greater than 6.2 percent would likely have higher dieldrin concentrations than those predicted by the model; conversely, fish with a lower lipid content would likely have lower dieldrin concentrations than predicted by the model.
Although dieldrin residues in fish have declined substantially since the 1960s (Schmitt and others, 1999; Nowell and others, 1999), the recent NAWQA data and results of these extrapolations suggest that detectable residues are present in some streams across the country at levels sufficient to be of potential human health or wildlife concern. A number of fish consumption advisories for dieldrin have been rescinded in recent years, consistent with the national declining trends. As of 2004, there were still 22 active fish consumption advisories for dieldrin affecting seven states within the United States (U.S. Environmental Protection Agency, 2005). Models such as the one described here for dieldrin may assist in planning future monitoring efforts to support the setting or rescinding of fish consumption advisories.

