Regression Model for Explaining and Predicting Concentrations of Dieldrin in Whole Fish from United States Streams
By
Lisa H. Nowell, Charles G. Crawford, Naomi Nakagaki, Gail P. Thelin and David M. Wolock
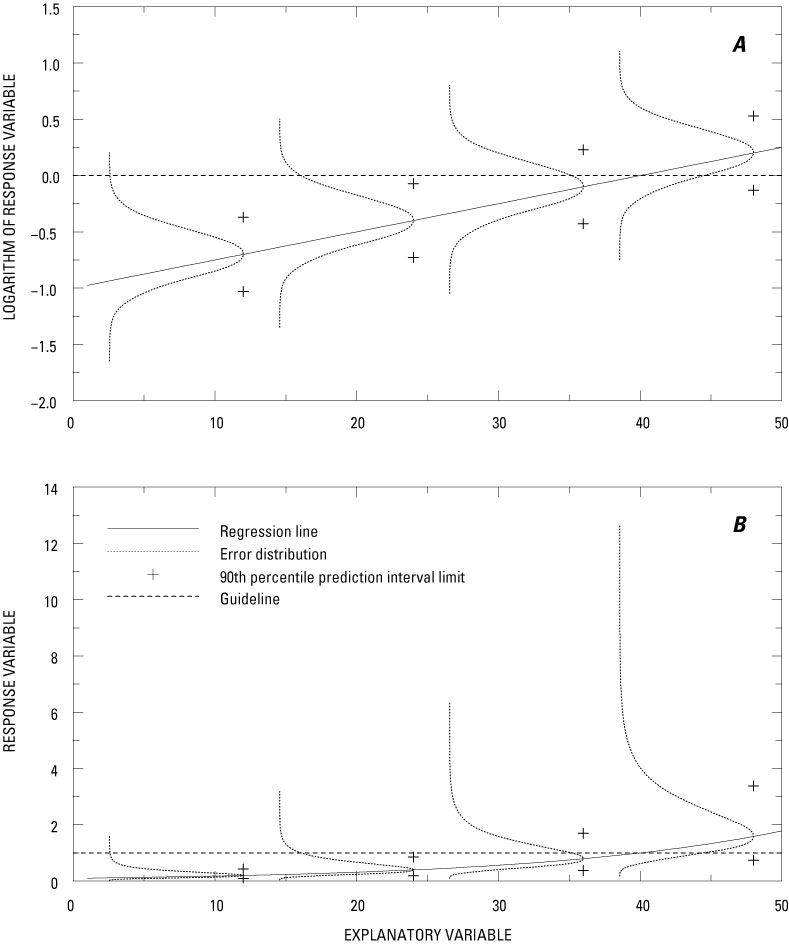
Figure 4
(A) A hypothetical regression for which the response variable is log-transformed, showing the regression line; the error distribution and the upper and lower 90th percentile prediction interval limits for four selected estimated values of the response variable; and a hypothetical guideline value. (B) Same as A, after taking the antilogarithm of the response variable.