Scientific Investigations Report 2006-5023
U.S. GEOLOGICAL SURVEY
Scientific Investigations Report 2006-5023
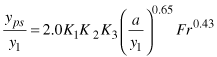
Table 5. Calculated depths of pier scour, contraction scour, and angles of attack at pier 3, and associated variables, Tanana River at Nenana, Alaska.
[Abbreviations: HEC-RAS, Hydrologic Engineering Center River Analysis System; RMA2, Resource Management Associates; ft, foot; ft/s, foot per second; ft/s2, foot per square second; ft3/s, cubic foot per second]
| Pier Scour calculated using output from one-dimensional HEC-RAS model |
Discharge scenario | |||||||
|---|---|---|---|---|---|---|---|---|
 |
Discharge, Aug. 17,1967 |
100-year flood | 500-year flood | |||||
| Low flow | High flow | Low flow | High flow | |||||
| Velocity at nose of pier (ft/s) | v1 | 10.51 | 10.81 | 8.90 | 12.21 | 10.23 | ||
| Depth at nose of pier (ft/s) | y1 | 21.3 | 19.6 | 22.9 | 21.3 | 24.5 | ||
| Gravity constant (ft/s2) | g | 32.17 | 32.17 | 32.17 | 32.17 | 2.2 | ||
| Froude number at nose of pier | Fr = v1/(gy1)1/2 | .40 | .43 | .33 | .47 | .36 | ||
| Pier shape | Sharp nose | Sharp nose | Sharp nose | Sharp nose | Sharp nose | |||
| Pier shape correction factor | K1 | 1.0 | 1.0 | 1.0 | 1.0 | 1.0 | ||
| Angle of attack (degree) | AA | 15 | 15 | 15 | 15 | 15 | ||
| Pier width (ft) | a | 14.0 | 14.0 | 14.0 | 14.0 | 14.0 | ||
| Pier length (ft) | L | 62 | 62 | 62 | 62 | 62 | ||
| Ratio | L/a | 4 | 4 | 4 | 4 | 4 | ||
| Angle of attack correction factor | K2 = f(AA, L/a) | 1.6 | 1.6 | 1.6 | 1.6 | 1.6 | ||
| Pier Scour (ft) | yps | 37.8 | 37.9 | 35.6 | 40.3 | 38.1 | ||
| Pier Scour calculated using output from two-dimensional RMA2 model |
Discharge scenario | |||||||
|---|---|---|---|---|---|---|---|---|
|
Discharge, Aug. 17,1967 |
100-year flood | 500-year flood | |||||
| Low flow | High flow | Low flow | High flow | |||||
| Velocity in the X direction at nose of pier (ft/s) | vx | -10.93 | -11.13 | -8.82 | -12.68 | -10.20 | ||
| Velocity in the Y direction at nose of pier (ft/s) | vy | -1.42 | -1.72 | -0.84 | -1.83 | -0.98 | ||
| Resultant velocity at nose of pier (ft/s) | v1 | 11.02 | 11.36 | 8.86 | 12.81 | 10.25 | ||
| Depth at nose of pier (ft/s) | y1 | 23.9 | 22.4 | 26.5 | 24.1 | 28.0 | ||
| Gravity constant (ft/s2) | g | 32.17 | 32.17 | 32.17 | 32.17 | 32.2 | ||
| Froude number at nose of pier | Fr = v1/(gy1)1/2 | .40 | .42 | .30 | .46 | .34 | ||
| Pier shape | Sharp nose | Sharp nose | Sharp nose | Sharp nose | Sharp nose | |||
| Pier shape correction factor | K1 | 1.0 | 1.0 | 1.0 | 1.0 | 1.0 | ||
| Angle of flow (degree) | 263 | 261 | 265 | 262 | 265 | |||
| Angle of pier (degree) | 248 | 248 | 248 | 248 | 248 | |||
| Angle of attack (degree) | AA | 15 | 13 | 17 | 14 | 17 | ||
| Pier width (ft) | a | 14.0 | 14.0 | 14.0 | 14.0 | 14.0 | ||
| Pier length (ft) | L | 62 | 62 | 62 | 62 | 62 | ||
| Ratio | L/a | 4 | 4 | 4 | 4 | 4 | ||
| Angle of attack correction factor | K2 = f(AA, L/a) | 1.6 | 1.5 | 1.6 | 1.5 | 1.6 | ||
| Bed condition (dunes) correction factor | K3 | 1.1 | 1.1 | 1.1 | 1.1 | 1.1 | ||
| Pier Scour (ft) | yps | 38.9 | 38.0 | 37.3 | 40.8 | 40.0 | ||
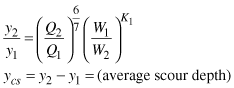
| Live-bed contraction scour simulated using output from one-dimensional HEC-RAS model |
Discharge scenario | |||||||
|---|---|---|---|---|---|---|---|---|
 |
Discharge, Aug. 17,1967 |
100-year flood | 500-year flood | |||||
| Low flow | High flow | Low flow | High flow | |||||
| Total discharge in Tanana River main channel (ft3/s) | Q | 158,000 | 150,000 | 149,000 | 187,000 | 185,000 | ||
| Exponent determined from mode of bed material transport | K1 | .69 | .69 | .69 | .69 | .69 | ||
| Discharge in main channel of approach section (ft3/s) | Q1 | 156,700 | 148,000 | 142,000 | 180,600 | 173,700 | ||
| Discharge in main channel of contracted (bridge) section (ft3/s) | Q2 | 155,800 | 148,100 | 143,400 | 182,200 | 176,600 | ||
| Width of main channel of approach section (ft) | W1 | 796 | 796 | 796 | 796 | 796 | ||
| Width of main channel of contracted (bridge) section (ft) | W2 | 706 | 706 | 710 | 706 | 710 | ||
| Average depth of main channel of approach section (ft) | y1 | 20.7 | 19.1 | 22.2 | 20.9 | 23.8 | ||
| Average depth in contracted (bridge) section (ft) | y2 | 22.3 | 20.7 | 24.2 | 22.9 | 26.2 | ||
| Contraction Scour (ft) | ycs | 1.7 | 1.7 | 2.0 | 2.0 | 2.3 | ||
For more information about USGS activities in Alaska, visit the USGS Alaska Water Science Center home page.

![]() U.S.
Department of the Interior | U.S. Geological
Survey
U.S.
Department of the Interior | U.S. Geological
Survey
Persistent URL: https://pubs.water.usgs.gov/sir200695023
Page Contact Information: Publications Team
Page Last Modified: Thursday, 01-Dec-2016 18:59:28 EST
