 |
|
|
||||
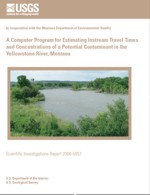
| PUBLICATION—Scientific Investigations Report |
U.S. Department of the Interior
U.S. Geological Survey
 |
The full report is in Adobe Acrobat® Portable Document Format (PDF). You will need Adobe Acrobat Reader®, version 6 or higher, to view or print the PDF. If you don't already have this free viewing software or need to upgrade your version, download Adobe Acrobat Reader®. Users with visual disabilities can visit http://access.adobe.com/ for conversion tools and information to help make PDF files accessible. The report is also available from USGS Maps and Publications.
|
The Yellowstone River is very important in a variety of ways to the residents of southeastern Montana; however, it is especially vulnerable to spilled contaminants. In 2004, the U.S. Geological Survey, in cooperation with Montana Department of Environmental Quality, initiated a study to develop a computer program to rapidly estimate instream travel times and concentrations of a potential contaminant in the Yellowstone River using regression equations developed in 1999 by the U.S. Geological Survey. The purpose of this report is to describe these equations and their limitations, describe the development of a computer program to apply the equations to the Yellowstone River, and provide detailed instructions on how to use the program. This program is available online at https://pubs.water.usgs.gov/sir2006-5057/includes/ytot.xls.
The regression equations provide estimates of instream travel times and concentrations in rivers where little or no contaminant-transport data are available. Equations were developed and presented for the most probable flow velocity and the maximum probable flow velocity. These velocity estimates can then be used to calculate instream travel times and concentrations of a potential contaminant.
The computer program was developed so estimation equations for instream travel times and concentrations can be solved quickly for sites along the Yellowstone River between Corwin Springs and Sidney, Montana. The basic types of data needed to run the program are spill data, streamflow data, and data for locations of interest along the Yellowstone River. Data output from the program includes spill location, river mileage at specified locations, instantaneous discharge, mean-annual discharge, drainage area, and channel slope. Travel times and concentrations are provided for estimates of the most probable velocity of the peak concentration and the maximum probable velocity of the peak concentration.
Verification of estimates of instream travel times and concentrations for the Yellowstone River requires information about the flow velocity throughout the 520 mi of river in the study area. Dye-tracer studies would provide the best data about flow velocities and would provide the best verification of instream travel times and concentrations estimated from this computer program; however, data from such studies does not currently (2006) exist and new studies would be expensive and time-consuming. An alternative approach used in this study for verification of instream travel times is based on the use of flood-wave velocities determined from recorded streamflow hydrographs at selected mainstem streamflow-gaging stations along the Yellowstone River. The ratios of flood-wave velocity to the most probable velocity for the base flow estimated from the computer program are within the accepted range of 2.5 to 4.0 and indicate that flow velocities estimated from the computer program are reasonable for the Yellowstone River. The ratios of flood-wave velocity to the maximum probable velocity are within a range of 1.9 to 2.8 and indicate that the maximum probable flow velocities estimated from the computer program, which corresponds to the shortest travel times and maximum probable concentrations, are conservative and reasonable for the Yellowstone River.
Abstract
Introduction
Description of Equations Used for Estimating Instream Travel Times and Concentrations
Travel Time of Peak Concentration
Travel Time of Leading Edge
Determination of Unit-Peak Concentration
Determination of Peak Concentration
Travel Time of Trailing Edge
Non-Conservative Contaminants
Limitations of the Equations
Computer Program for Estimating Instream Travel Times and Concentrations of a Potential Contaminant in the Yellowstone River
Guidelines for General Use
Data Input
Spill Data
Streamflow Data
Locations of Interest Data
Data Output
Validation of the Computer Program
Example Application of the Computer Program
Summary
Selected References
Figures
1. Map showing streamflow-gaging stations, river reaches, nodes, and major tributaries along the Yellowstone River from Corwin Springs to Sidney, Montana.
2. Diagram showing a typical graph of travel times and concentrations for the movement of a contaminant plume past a fixed point downstream from a spill.
3–4. Schematic diagrams showing:
3. Interpolation of mean-annual discharge and instantaneous discharge for nodes located at confluences of major tributaries.
4. Discharge adjustment by drainage-area method.
5–10. Computer-screen shots showing parts of pop-up windows for:
5. Input form for contaminant-spill location, recovery ratio, and mass.
6. Input form for contaminant list and for adding or deleting contaminants.
7. Input form for discharge data.
8. Data-management buttons for loading, saving, and deleting streamflow data.
9. Input form for selecting locations of interest.
10. Function for graphing instream travel times and concentrations.
Tables
1. Bankfull and low-flow discharge values for selected sites along the Yellowstone River, Montana.
2. Real-time streamflow-gaging stations along the Yellowstone River and major tributaries, Montana, 2006.
3. River mileages for selected locations along the Yellowstone River, Montana.
4. Stream-velocity data for selected storm hydrographs at selected streamflow-gaging stations, Yellowstone River, Montana.
| AccessibilityFOIAPrivacyPolicies and Notices | |
 |
|