Scientific Investigations Report 2006–5209
U.S. GEOLOGICAL SURVEY
Scientific Investigations Report 2006–5209
Table A1. Blank sample results for the water-quality sample collection program.
[Abbreviations: mg/L, milligram per liter; NA, not applicable]
| Analyte | Number of samples | Percentage of blank samples | Minimum reporting level (mg/L) | Number of blank samples greater or less than minimum reporting level | Value of blank samples greater than minimum reporting level (mg/L) | ||
|---|---|---|---|---|---|---|---|
| Blank | Total | Maximum | Median | ||||
| 2002 | |||||||
| Orthophosphate-P | 18 | 218 | 8 | 0.01 | 10 | 0.03 | 0.02 |
| Ammonia-N | 18 | 218 | 8 | .02 | 18 | NA | NA |
| Nitrate/nitrite-N | 18 | 218 | 8 | .03 | 18 | NA | NA |
| Total phosphorus | 19 | 114 | 17 | .004 | 18 | .007 | NA |
| Chlorophyll a | 1 | 101 | 1 | NA | NA | 2.4 | NA |
| 2003 | |||||||
| Orthophosphate-P | 24 | 130 | 18 | 0.007 | 20 | NA | NA |
| Ammonia-N | 24 | 130 | 18 | .015 | 9 | 0.202 | 0.032 |
| Nitrate/nitrite-N | 24 | 130 | 18 | .022 | 17 | .038 | .032 |
| Total phosphorus | 16 | 81 | 2 | .004 | 11 | .005 | NA |
| Chlorophyll a | 2 | 62 | 3 | NA | NA | 0 | NA |
| 2004 | |||||||
| Orthophosphate-P | 21 | 191 | 11 | 0.006 | 0 | NA | NA |
| Ammonia-N | 29 | 199 | 15 | .01 | 7 | 0.188 | 0.034 |
| Nitrate/nitrite-N | 21 | 191 | 11 | .016 | 17 | .037 | .022 |
| Total phosphorus | 22 | 133 | 17 | .004 | 17 | NA | NA |
| Chlorophyll a | 0 | 106 | 0 | NA | NA | NA | NA |
Table A2. Split sample results for the water-quality sample collection program, 2002–04.
[Abbreviations: mg/L, milligram per liter]
| Analyte | Number of samples |
Percentage of split samples |
Difference between split samples |
||
|---|---|---|---|---|---|
| Split | Total | Median (mg/L) |
Median (percent) |
||
| 2002 | |||||
| Orthophosphate-P | 19 | 218 | 9 | 0.01 | 7.4 |
| Ammonia-N | 19 | 218 | 9 | .02 | 22.2 |
| Nitrate/nitrite-N | 19 | 218 | 9 | 0 | 0 |
| Total phosphorus | 8 | 114 | 7 | .014 | 5.2 |
| Chlorophyll a | 14 | 101 | 14 | 1.6 | 3.4 |
| 2003 | |||||
| Orthophosphate-P | 11 | 130 | 8 | 0.004 | 10 |
| Ammonia-N | 11 | 130 | 8 | .02 | 16.9 |
| Nitrate/nitrite-N | 11 | 130 | 8 | 0 | 0 |
| Total phosphorus | 7 | 81 | 9 | .011 | 7.7 |
| Chlorophyll a | 5 | 62 | 8 | 5 | 6.6 |
| 2004 | |||||
| Orthophosphate-P | 17 | 191 | 9 | 0.001 | 6.2 |
| Ammonia-N | 17 | 199 | 9 | .002 | 2.9 |
| Nitrate/nitrite-N | 17 | 191 | 9 | .004 | 10.5 |
| Total phosphorus | 7 | 133 | 5 | .006 | 4.6 |
| Chlorophyll a | 7 | 106 | 7 | 11 | 10.3 |
Table A3. Replicate sample results for the water-quality sample collection program, 2002–04.
[Abbreviations: mg/L, milligram per liter]
| Analyte | Number of samples | Percentage of replicate samples |
Difference between replicate samples |
||
|---|---|---|---|---|---|
| Replicate | Total | Median (mg/L) |
Median (percent) |
||
| 2002 | |||||
| Orthophosphate-P | 12 | 218 | 6 | 0.009 | 10.5 |
| Ammonia-N | 12 | 218 | 6 | .011 | 3.8 |
| Nitrate/nitrite-N | 12 | 218 | 6 | 0 | 0 |
| Total phosphorus | 6 | 114 | 5 | .004 | 2.7 |
| Chlorophyll a | 6 | 101 | 6 | 4.5 | 4.3 |
| 2003 | |||||
| Orthophosphate-P | 8 | 130 | 6 | 0.014 | 34.2 |
| Ammonia-N | 8 | 130 | 6 | .046 | 19.4 |
| Nitrate/nitrite-N | 8 | 130 | 6 | .005 | 7.2 |
| Total phosphorus | 5 | 81 | 6 | .014 | 5.6 |
| Chlorophyll a | 4 | 62 | 6 | 4.5 | 11.2 |
| 2004 | |||||
| Orthophosphate-P | 15 | 191 | 8 | 0.001 | 13.3 |
| Ammonia-N | 15 | 199 | 8 | .016 | 38.6 |
| Nitrate/nitrite-N | 15 | 191 | 8 | .004 | 12.2 |
| Total phosphorus | 10 | 133 | 8 | .01 | 9.8 |
| Chlorophyll a | 10 | 106 | 9 | 11 | 10.5 |
Table A4. Spiked sample results for the water-quality sample collection program, 2002–04.
[Abbreviations: NA, not applicable (no analysis)]
| Analyte | Average percentage recovery of spiked samples |
||
|---|---|---|---|
| 2002 | 2003 | 2004 | |
| Orthophosphate-P | 112 | 106 | 92 |
| Ammonia-N | 114 | 94 | 98 |
| Nitrate/nitrite-N | 100 | 90 | 97 |
| Total phosphorus | NA | 100 | 104 |
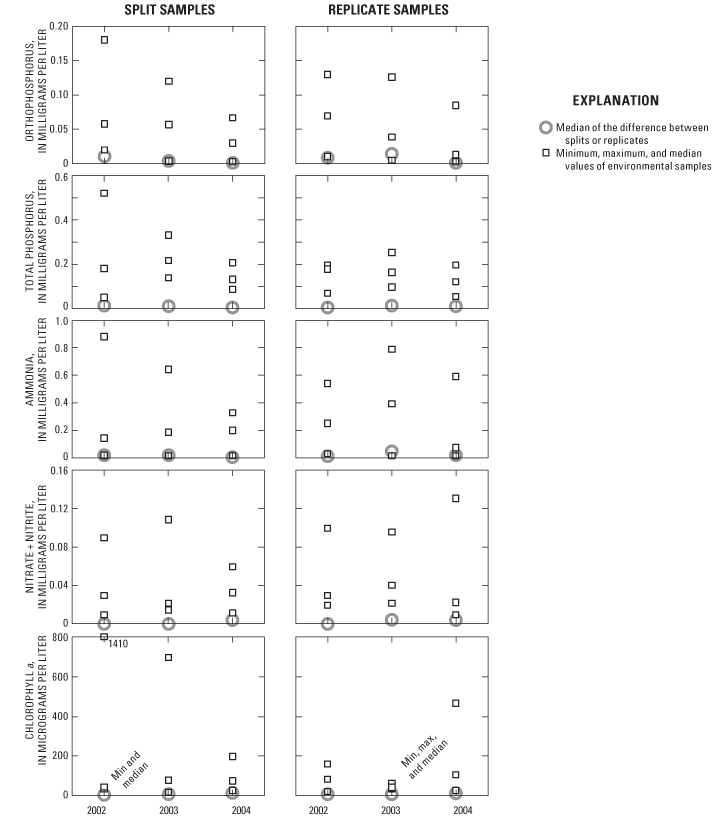
Figure A1. Median of the difference between replicate and split samples, compared to the distribution of the environmental samples.

![]() U.S.
Department of the Interior | U.S. Geological
Survey
U.S.
Department of the Interior | U.S. Geological
Survey
Persistent URL: https://pubs.water.usgs.gov/sir20065209
Page Contact Information: Publications Team
Page Last Modified: Thursday, 01-Dec-2016 19:12:56 EST
