 |
|
Office of Surface Water
|
||||
|
Office of Surface Water |
by Glenn E. Moglen and Dorianne E. Shivers
U.S. Geological Survey Scientific Investigations Report 2006-5270
The report is available as a pdf.
A study was conducted of 78 U.S. Geological Survey gaged streams that have been subjected to varying degrees of urbanization over the last three decades. Flood-frequency analysis coupled with nonlinear regression techniques were used to generate a set of equations for converting peak discharge estimates determined from rural regression equations to a set of peak discharge estimates that represent known urbanization. Specifically, urban regression equations for the 2-, 5-, 10-, 25-, 50-, 100-, and 500-year return periods were calibrated as a function of the corresponding rural peak discharge and the percentage of impervious area in a watershed. The results of this study indicate that two sets of equations, one set based on imperviousness and one set based on population density, performed well. Both sets of equations are dependent on rural peak discharges, a measure of development (average percentage of imperviousness or average population density), and a measure of homogeneity of development within a watershed. Average imperviousness was readily determined by using geographic information system methods and commonly available land-cover data. Similarly, average population density was easily determined from census data. Thus, a key advantage to the equations developed in this study is that they do not require field measurements of watershed characteristics as did the U.S. Geological Survey urban equations developed in an earlier investigation.
During this study, the U.S. Geological Survey PeakFQ program was used as an integral tool in the calibration of all equations. The scarcity of historical land-use data, however, made exclusive use of flow records necessary for the 30-year period from 1970 to 2000. Such relatively short-duration streamflow time series required a nonstandard treatment of the historical data function of the PeakFQ program in comparison to published guidelines. Thus, the approach used during this investigation does not fully comply with the guidelines set forth in U.S. Geological Survey Bulletin 17B, and modifications may be needed before it can be applied in practice.
The U.S. Geological Survey (USGS) maintains and publishes a set of rural regression equations for use in estimating peak discharges of varying return periods for each State in the United States (U.S.; Jennings and others, 1994; Ries and Crouse, 2002). Sauer and others (1983) developed a method for transforming these rural discharge estimates to estimates for urban watersheds based on several watershed characteristics, most notably two different indices of urbanizationthe basin development factor (BDF) and the percentage of impervious area. A study was conducted to reassess the method of Sauer and others (1983) by taking advantage of 20 additional years of streamflow data, using geographic information system (GIS) data and techniques, and considering new approaches in the development of a set of urban regression equations. As in the earlier study, the goal of this study was to develop flood-frequency equations for urbanized sites by applying urban adjustments to the T-year flood values obtained from the regional equations for rural ungaged sites. The T-year flood is the flood that, on average, is equaled or exceeded once in any given number (T) of years.
The USGS typically conducts flood-frequency analyses consistent with Bulletin 17B (Interagency Advisory Committee on Water Data, 1982). For the study, the USGS flood-frequency analysis program, PeakFQ, was incorporated into an optimization program to calibrate several sets of urban regression equations. Because of limited-duration streamflow time series used in the analysis, however, the approach used in this study for the historical period input to the PeakFQ program does not comply with Bulletin 17B guidelines.
The effects of land-use changes on stream discharge are well documented (for example Carter, 1961; James, 1965; Viessman, 1966; Leopold, 1968; Andersen, 1970). The effects of urbanization, in particular, typically are related to characteristic changes in watersheds. Urbanization generally is associated with increased areas of impervious surfaces, such as pavement and rooftops. These surfaces usually have drainage features that quickly convey water away from structures or road surfaces and into nearby streams. In addition, urbanization generally reduces temporary stormwater storage, such as depression storage and tree-leaf interception. These urbanization processes create large volumes of stormwater that generally travel swiftly to the surface-drainage network and result in high flood peaks, which are the focus of this study.
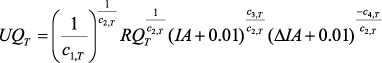
Sauer and others (1983) presented a regression-equation approach of using rural flood-frequency estimates, such as those resulting from the equations summarized by Jennings and others (1994), and scaling these estimates upwards based on several measures of urbanization. Such rural flood-frequency estimates are currently (2006) calculated using the USGS National Flood-Frequency Program (version 3; Ries and Crouse, 2002).
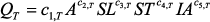
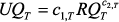
Although Sauer and others (1983) calibrated several different sets of adjustment equations, their best model included seven parameters as presented in the following form:
 , , | (1) |
| where UQT | is the T-year urban peak discharge, in cubic feet per second; | |
| A | is the drainage area, in square miles; | |
| SL | is the main channel slope, in foot per mile; | |
| RI2 | is the 2-hour, 2-year rainfall, in inches; | |
| ST | is the basin storage in percent; | |
| BFD | is the basin development factor (an urbanization index that quantifies channel improvements, channel linings, storm drains/sewers, and curb-and-gutter streets); | |
| IA | is the impervious area, in percent; and | |
| RQT | is the T-year rural discharge as predicted from the appropriate USGS rural-regression equation; | |
| (Note: The difficulty in determining the BDF index based solely on remotely sensed data was a motivating factor for conducting this study.) | ||
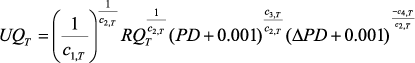
In some States, the USGS has developed localized urban equations that supersede the use of the national urban equations developed by Sauer and others (1983; shaded areas in fig. 1). The localized urban equations vary in sophistication, but all generally require some measure of urbanization, such as the percentage of impervious or residential area. The general equations for the States of New Jersey (Stankowski, 1974), Pennsylvania (Stuckey and Reed, 2000), and Wisconsin (Conger, 1986) are presented here to illustrate the available range of localized urban equations.
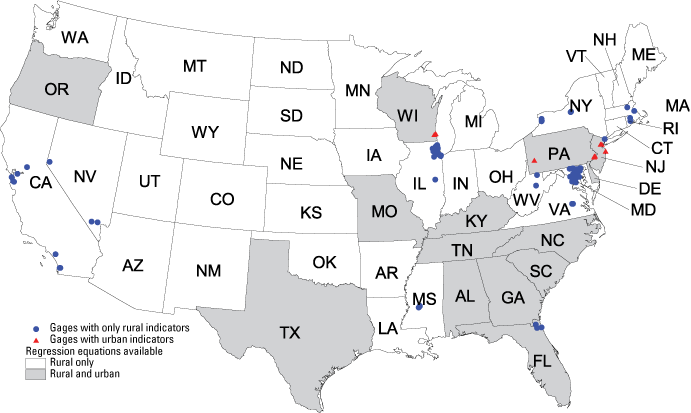
Figure 1. Locations of urban and rural streamgages used in current (2006) study of rural regression peak discharges. [Shaded states have urban prediction regression equations that apply either statewide or in selected areas.]
New Jersey:
 , , | (2) |
| where UQT | is the T-year urban peak discharge, in cubic feet per second; | |
| A | is the drainage area, in square miles; | |
| SL | is the main channel slope, in foot per mile; | |
| ST | is the basin storage in percent; | |
| IA | is the impervious area, in percent; and |
Pennsylvania (Region A):
 , , | (3) |
| where UQT | is the T-year urban peak discharge, in cubic feet per second; | |
| A | is the drainage area, in square miles; | |
| F | is forest cover, in percent; | |
| U | is urban development, in percent; | |
| C | is the watershed, in percent, underlain by carbonate rock; and | |
| CA | is the watershed, in percent, controlled by lakes, swamps, or reservoirs. |
Wisconsin (Milwaukee County urban areas):
 , , | (4) |
| where UQT | is the T-year urban peak discharge, in cubic feet per second; | |
| A | is the drainage area, in square miles; and | |
| IA | is the impervious area, in percent. |
The central premise of the study is that observed peak discharges at USGS streamgages are a function of watershed characteristics that exist at the time of the observed flood. Specifically, urbanization, measured as impervious area, varies over time and needs to be properly accounted for when performing flood-frequency analysis on an observed annual maximum time series.
The general steps in the adjustment method steps are described here. Because this is a calibration exercise, the process outlined here is iterative and is dependent on the minimization of an objective function that quantifies the difference between the observed rural flood-frequency values and the flood-frequency results obtained by using the PeakFQ program and adjusted annual maximum discharge data for urban streams.
Steps 2 through 6 are repeated for all gages in the database and then performed iteratively until the objective function described in Step 5 is minimized. The entire process is conducted separately for the 2-, 5-, 10-, 25-, 50-, 100-, and 500-year flood-frequencies. A detailed flow chart of the general process described here is shown in figure 2. (Note: Steps 2-6 are automated by a nonlinear optimization program modified from McCuen (1993). The objective function that is minimized is the sum of the squared errors between the PeakFQ output for the T-year flood and the equivalent T-year flood estimated by the rural regression equation.)
After an equation is calibrated for each return period, the calibrated urban equation is determined in the following step (7):
From the users standpoint, there likely is only an interest in the actual use of the function f from Step 7. The users experience will be limited to the following two steps:
A critical challenge is the determination of the appropriate annual maximum discharge adjustment equation. The approach used during this study was to explore several functional forms and select the form that produced the best goodness-of-fit statistics across all frequencies.
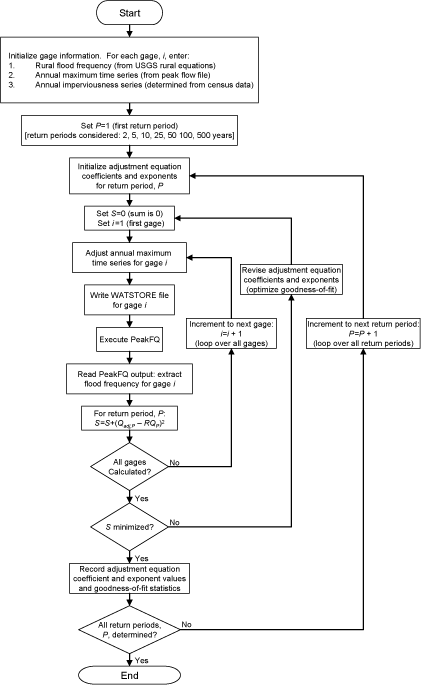
Figure 2. Flow chart for the process for calibrating adjustment equations.
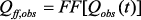
Pursuant to Bulletin 17B (Interagency Advisory Committee on Water Data, 1982), FF(x, Qo, HP, SS) is defined as the flood-frequency operator. This operator returns the flood-frequency vector, (Qff for the 2-, 5-, 10-, 25-, 50-, 100-, and 500-year floods) for a time series of annual maximum floods (x), for an identified high-outlier discharge threshold (Qo), for a historical return period associated with the largest flood exceeding Qo (HP), and assuming the station skew option (SS). An individual member of the flood-frequency vector, say the T-year flood, is identified as Qff(T) or QT.
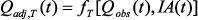
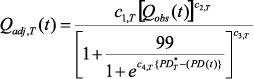
The observed annual maximum time series is defined as Qobs(t). The adjusted annual maximum time series is defined as Qadj(t). Performing flood-frequency analyses on these two time series produced the flood-frequency vectors, Qff,obs and Qff,adj, respectively. Thus, the resulting equations take the following forms:
 , , | (5) |
and
 , , | (6) |
where HPobs and HPadj are the return periods associated with the largest floods in the respective annual maximum time series exceeding Qo. For simplification, the dependency of the flood-frequency operator on a high-outlier threshold, a specified historical period, and a skew option was omitted from the notation. Thus, equations 5 and 6, respectively, reduce to simpler forms:
 , , | (7) |
and
 . . | (8) |
Two other flood-frequency vectors were relevant to this studyQff,rural and Qff,urban, which are the rural and urban flood-frequency vectors, respectively. Because these vectors are determined from regression equations, they exist only as flood-frequency values and have no time series directly associated with them.
A central premise in the study by Sauer and others (1983) was that the observed flood-frequency record for a selected streamgage was stationary; in othet words, the record was unaffected by changes in urbanization over the period of record analyzed. To compensate for this premise, Sauer and others (1983) applied the rule that a streamgage record was usable if the amount of impervious area in the watershed had not increased more than 50 percent during the period of record.
In the current (2006) study, a different approach was taken. As discussed previously, an annual time series of impervious area, IA(t), was developed for each gage studied in order to relate a unique value of impervious area to each observed annual maximum flood value.
The observed and adjusted annual maximum time series are related by a set of nonlinear functions, fT(.), such that
 , , | (9) |
where Qadj,T(t) is the adjusted time series of annual maximum flows that is keyed to the T-year flood. Each of the seven equations for the 2-, 5-, 10-, 25-, 50-, 100-, and 500-year floods (f2, f5, f10, f25, f50, f100, and f500, respectively) must be calibrated.
When the flood-frequency operator is applied to each adjusted time series, it produces the rural flood-frequency value for the return period, (T):
 . . | (10) |
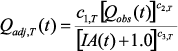
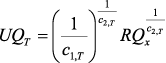
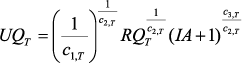
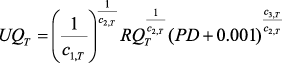
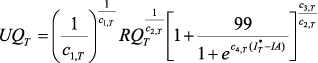
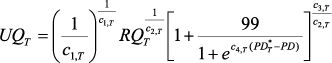
Once all fT(.) are determined and assumption 4 was applied, these functions were inverted such that the independent variables were the rural flood-frequency values and impervious area, and the dependent variable was the urban flood-frequency value:
 , , | (11) |
where  (.) is the inverted form of fT(.).
Several forms of fT(.) were investigatedthe null model, the simple imperviousness model, the simple density model, the imperviousness distribution model, the density distribution model, the scaled imperviousness model, and the scaled density model. These model forms are represented by the following equations (12 - 18, respectively).
Null model:
 . . | (12) |
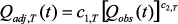
Simple imperviousness model:
 . . | (13) |
Simple density model:
 . . | (14) |
Imperviousness distribution model:
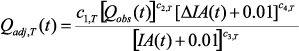 . . | (15) |
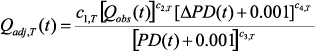
Density distribution model:
 . . | (16) |
Scaled imperviousness model:
 . . | (17) |
Scaled dentisy model:
 . . | (18) |
The distribution models (eqs. 15 and 16) deserve a brief discussion. The terms ΔIA(t) and ΔPD(t) represent the difference between the 10th and 90th percentiles of the impervious area and population density, respectively. These terms quantify the homogeneity or uniformity of development within a watershed. Watersheds with relatively small values of either of these terms are considered to be uniform. Consideration of uniformity of development is helpful in predicting flood behavior.
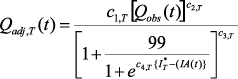
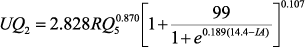
The scaled models (eqs. 17 and 18) also deserve a brief explanation. The term scaled imperviousness varies nonlinearly from 1 to 100 as IA increases from 0 to 100 percent. For IA = I*, the scaled imperviousness equals 50.5. The scaled imperviousness function for typical parameter values is shown in figure 3. Scaled imperviousness is used because it could be argued that each incremental increase in imperviousness may not have an equivalent effect on flood-frequency. In figure 3, the effect of imperviousness increases most rapidly within the range of 5 to 15 percent imperviousness. This is consistent with studies of the effects of imperviousness on ecological health (for example, Schueler, 1987).
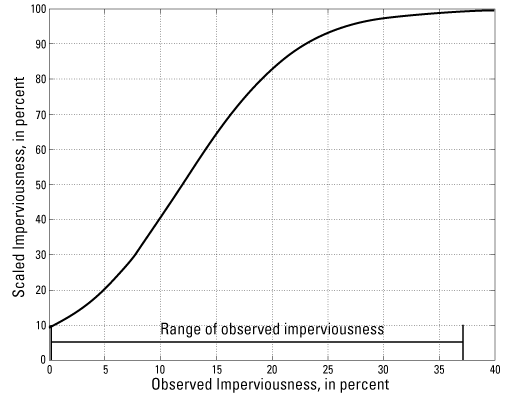
Figure 3. The relation between observed and scaled imperviousness for the scaled values I*=12.1 and c4=0.2.
Using PeakFQ, a preliminary flood-frequency analysis was performed for the observed annual maximum time series at each of the 78 streamgages. These analyses were conducted identically to those that are conducted in the optimization model with respect to identifying high outliers and determining the length of the historical record (discussed later). The flood-frequency results from these preliminary analyses were compared with the rural regression flood-frequency values described later in this report. If, at a specific streamgage, the flood-frequency from the observed annual maximum time series produced estimates for the T-year flood such that
 , , | (19) |
this gage was eliminated from the database for the development of the T-year regression equation. The rationale for such data elimination is that if a streamgage does not have an increase in flood-frequency values relative to the rural regression equations for peak flows, then it does not make sense to use such a gage to calibrate an urban-scaling factor. The number of gages censored from the analysis will be presented later in the Results section.
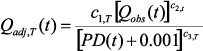
As an example of the flow-adjustment process, consider the calibrated form for the 5-year, simple imperviousness adjustment model determined in this study:
 . . | (20) |
Included in table 1 are the imperviousness time series, IA(t), the observed annual maximum time series, Qobs(t), and the 5-year adjusted annual maximum time series, Qadj,5(t) for USGS streamgage 01645000, Seneca Creek at Dawsonville, Maryland. The far right column of the table contains the ratios of the adjusted discharges to the observed discharges. Notice that the ratios are less than 1 for all by the three largest discharges in 1971, 1972, and 1975, indicating that the adjusted annual maximum time series generally is less than the observed annual maximum time series, which would be expected if the adjusted series approximates the comparatively small rural discharges that would have occurred in these years had urbanization not occurred. The adjustment ratios also are clearly smaller for smaller discharges and approach (and slightly exceed) 1 as the discharges become large. This indicates that relatively small discharges that correspond to more frequent 2- and 5-year flows are subject to adjustment from the effects of imperviousness. Such adjustments are consistent with the expectation that urbanization has the greatest effect on flood flows from storms of small magnitude. Further, in general, note that the adjustment ratios decrease with time, indicating the need to adjust the more recent discharges that correspond to greater urbanization in the watershed.
The behavior of the adjustment equation can be observed clearly by comparing years 1973 and 1999 (table 1). In 1973, the peak discharge was 3,020 ft3/s, and imperviousness was about 5.6 percent. The adjusted discharge for 1973 is 2,397 ft3/s. In comparison, the peak discharge in 1999 was 3,060 ft3/s, and imperviousness was 12.8 percent. The adjusted discharge for 1999 is 2,144 ft3/s. Although the observed discharge in 1999 is only slightly greater (40 ft3/s) than the observed discharge in 1973, the adjusted discharge for 1973 is greater by 253 ft3/s than the adjusted discharge for 1999. This clearly indicates the role of the annual imperviousness time series in this study. It is worth noting that imperviousness in the watershed between 1970 and 2000 increased from 4.8 percent to almost 13 percent, which represents more than a doubling of impervious area. For this reason, USGS streamgage 01645000 would have been eliminated from the Sauer and others (1983) study because their threshold of a 50-percent increase in imperviousness.
Finally, it is instructive to look at the 5-year flood-frequency values and compare these to the 5-year rural regression equation value of 5,876 ft3/s determined from Dillow (1996). While the observed 5-year peak discharge is 1.27 times the rural regression estimate, the adjusted 5-year peak is only 1.05 times this estimate. The similarity of the adjusted 5-year peak to the rural regression estimate is indicative of the success of the calibrated adjustment equation in quantifying the effect of imperviousness on the annual maximum discharge.
Table 1. Example of the adjustment of the observed annual maximum time series using the 5-year simple imperviousness adjustment model for the U.S. Geological Survey streamgage 01645000, Seneca Creek at Dawson, Maryland.
[%, percent; ft3/s, cubic feet per second]
| Year | Imperviousness (%) |
Observed Q (ft 3/s) |
Adjusted Q (ft 3/s) |
Qadj,5(t) /Qobs(t) |
|---|---|---|---|---|
| 1970 | 4.84 | 2,200 | 1,702 | 0.774 |
| 1971 | 5.10 | 25,900 | 28,787 | 1.111 |
| 1972 | 5.37 | 26,100 | 28,831 | 1.105 |
| 1973 | 5.63 | 3,020 | 2,397 | 0.794 |
| 1974 | 5.90 | 3,160 | 2,508 | 0.794 |
| 1975 | 6.16 | 16,000 | 16,094 | 1.006 |
| 1976 | 6.42 | 4,900 | 4,101 | 0.837 |
| 1977 | 6.69 | 3,770 | 3,016 | 0.800 |
| 1978 | 6.95 | 7,850 | 6,969 | 0.888 |
| 1979 | 7.22 | 16,000 | 15,716 | 0.982 |
| 1980 | 7.48 | 10,800 | 9,946 | 0.921 |
| 1981 | 7.85 | 1,340 | 896 | 0.668 |
| 1982 | 8.23 | 3,160 | 2,385 | 0.755 |
| 1983 | 8.60 | 3,260 | 2,455 | 0.753 |
| 1984 | 8.98 | 3,010 | 2,225 | 0.739 |
| 1985 | 9.35 | 3,620 | 2,734 | 0.755 |
| 1986 | 9.73 | 1,070 | 669 | 0.625 |
| 1987 | 10.10 | 4,950 | 3,871 | 0.782 |
| 1988 | 10.48 | 7,410 | 6,120 | 0.826 |
| 1989 | 10.85 | 8,250 | 6,886 | 0.835 |
| 1990 | 11.23 | 2,270 | 1,553 | 0.684 |
| 1991 | 11.40 | 5,120 | 3,947 | 0.771 |
| 1992 | 11.58 | 1,750 | 1,146 | 0.655 |
| 1993 | 11.76 | 3,350 | 2,412 | 0.720 |
| 1994 | 11.93 | 9,160 | 7,651 | 0.835 |
| 1995 | 12.11 | 2,080 | 1,388 | 0.667 |
| 1996 | 12.28 | 11,000 | 9,399 | 0.854 |
| 1997 | 12.46 | 3,880 | 2,829 | 0.729 |
| 1998 | 12.64 | 5,280 | 4,023 | 0.762 |
| 1999 | 12.81 | 3,060 | 2,144 | 0.701 |
| 2000 | 12.99 | 1,910 | 1,244 | 0.651 |
| Q5 | 7,435 | 6,157 | ||
The database used for this investigation contains watershed characteristics for 78 USGS streamgages across the United States (Appendix 1). The two most critical elements in this database are the flood-frequency values obtained directly from the gage record and the flood-frequency values obtained from the current USGS rural discharge equations that apply at each gage site. In this section, the method for determining these two sets of values for the gages used in this investigation is discussed. Other ancillary data, such as outlier values, development of impervious-cover time series from census data, and determination of watershed characteristics also are discussed.
The premise of the current study is that the USGS rural flood-frequency regression equations for each State represent the best estimate of the nonurbanized flood-frequency at any gage analyzed in the study. Thus, it is necessary to apply these equations to each gage included in the study and use the flood-frequency results in the development of the urban adjustment methods.
For each gage used in the study, the digital elevation model (DEM) covering the extent of the gaged watershed was obtained from the National Elevation Dataset (NED; U.S. Geological Survey, 2004a). Flow directions were constrained by burning in stream locations from the 1:100,000-scale National Hydrography Dataset (NHD; U.S. Geological Survey and U.S. Environmental Protection Agency, 2004). Standard GIS techniques were used to fill depressions and determine flow directions using a D8 algorithm (Jenson and Domingue, 1988). The watershed boundaries were delineated automatically by indicating the location of the streamgage to the GIS and initiating the delineation algorithm. An automated delineation is considered acceptable and consistent with USGS standards if the delineated drainage area is within 10 percent of the drainage area reported by the USGS (U.S. Geological Survey, 2004b).
Using the watershed boundaries generated as described in the previous section other watershed characteristics were determined as needed from additional interpretation of the DEM (for example, calculating the channel slope). If additional land-use and land-cover descriptors were needed, such as percentage of forest cover, these data were determined by using the most current land-use and land-cover data available. In most cases this meant using the 1992 National Land Cover Dataset (NLCD; Vogelmann and others, 1998a, 1998b; U.S. Geological Survey, 2005), although the 2001 NLCD (Homer and others, 2004; Multi-Resolution Land Characterization Consortium, 2005) was available for some locations during this study.
Flood-frequency estimates were developed from the observed annual maximum time series recorded as peak streamflow by the USGS (U.S. Geological Survey, 2004b). In this section, the methods will be discussed for selecting the gages used in the analysis, obtaining the observed annual maximum time, and using the PeakFQ program (Flynn and others, 2005) to analyze the data and produce the flood-frequency values.
The following list of criteria was used for selecting gages for this study:
Applying these criteria resulted in the final selection of 78 gages in 12 States for the study analyses. The States in which the gages are located are California, Florida, Illinois, Maryland, Massachusetts, Michigan, Mississippi, Nevada, New York, Rhode Island, Virginia, and West Virginia (fig. 1).
The observed annual maximum time series was obtained from the USGS (U.S. Geological Survey, 2004b). Observed peak discharge values for each study gage were obtained for all recorded floods occurring between 1970 and 2000. Data were collected in WATSTORE format, which can be read directly by the PeakFQ program.
The USGS developed the PeakFQ computer program (Flynn and others, 2005) to conduct flood-frequency analyses based on the guidelines in Bulletin 17B (Interagency Advisory Committee on Water Data, 1982). The PeakFQ program uses the sample-moment method to fit the Pearson Type III frequency distribution to the logarithms of annual flood peaks. The skew that is used may be (a) user-developed generalized skew for a region, (b) the skew map from Bulletin 17B, (c) computed from the data, or (d) weighted between the generalized skew and station skew computed from the data. Adjustments can be made for high and low outliers and historic information. Qualification codes can be used to censor data from the analysis.
The PeakFQ program offers several options for defining a skew value to use in developing a flood-frequency estimate. In developing rural flood-frequency estimates for a given State, a regionalized skew typically is developed that is weighted with the local skew at the gaging station being analyzed. For urban estimates, this method is problematic because of fewer urban watersheds from which to develop a regionalized value and the varying extent of urbanization. In this study, therefore, each gaging station was considered individually and the station skew option was used throughout the analyses presented in this report.
Because of the relatively short periods of record (31 years or less) for the flood-frequency analysis, there is a greater possibility of time-sampling errors than may be expected when examining longer periods of record. To reduce the potential effects of these errors, a systematic method for applying the high-outlier option of the PeakFQ program was applied. To apply this option, however, two quantities must be definedthe discharge threshold that defines the minimum high-outlier discharge and the return frequency of the largest discharge in the systematic record analyzed. Because of the nature of the model calibration process, the procedures outlined here were performed repeatedly (for each iteration, for each gage, for each return period examined) in calibrating various trial-adjustment models.
The high-outlier threshold is the largest discharge that is considered within the normal range of discharge for a particular time series being analyzed. Discharges greater than this threshold were not attributed a probability using the Weibull plotting position formula in the analyses. The high-outlier discharge threshold was determined by the following method: given an annual maximum time series of n discharges at a particular gage, it was arbitrarily decided that these n values would represent the flood-frequency characteristics for that location for a period four times as long. Although this is an arbitrary assumption, it adequately produced the desired effect of filtering out large extreme floods that far exceeded the periods of record being analyzed while allowing the consideration of moderate-sized floods. Thus, the approach for identifying outlier discharges for this study is not consistent with the approach outlined in Bulletin 17B; however, this outlier-identification approach was a repeatable criterion that worked effectively and could be applied uniformly.
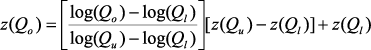
The discharges determined from the rural flood-frequency regression equations were used to determine the high-outlier threshold. The flood-frequency distribution was treated as a piecewise log-normal distribution, and the high-outlier threshold was determined by linear interpolation within the bounds of these values by applying the following equation:
 , , | (21) |
where Tl < 4n ≤ Tu and z(Tx) is the standard normal deviate corresponding to a flood of return period, Tx. Thus, the high-outlier threshold (Qo), is determined simply as
 . . | (22) |
In a similar manner, the largest flood in the systematic record was assigned a value for the historic period that it represents given the rural regression flood-frequency equation estimates that apply to a specific watershed. The largest flood was compared to the rural flood-frequency distribution, and a return period was determined by interpolating from this distribution, thus treating the flood-frequency distribution as a piecewise log-normal distribution. If the largest flood in the systematic record exceeded the 500-year rural flood, a return period of 500 years was arbitrarily assigned to the flood. The interpolation was performed as follows:
 , , | (23) |
where Ql < Qo ≤ Qu and z(Qx) is the standard normal deviate corresponding to a flood of magnitude, Qx. With z(Qo) known, the cumulative probability (P(Qo)) associated with this value was determined from the standard normal distribution. Finally, the return period (T(Qo)) was determined by using
 . . | (24) |
To illustrate the application of the outlier and historical period identification procedures, the procedures were applied to the record of USGS streamgage 02037800, Falling Creek near Midlothian, Virginia. The period of record for this gage is 1951-2003, with several breaks in the record. Because of limited census data, only the period 1970-2000 was considered. Further, the gage was inactive in 1978 and again from 1994 to 2000; therefore, only the records for the periods 1970-1977 and 1979-1993 were available for this study. The largest flood during these two periods had a magnitude of 5,170 ft3/s and occurred in 1979. The next largest flood had a magnitude of 1,400 ft3/s and occurred in 1985 (fig. 4).
The rural peak discharges determined from Bisese (1995) for the Southern Piedmont region produced peak-discharge estimates for the streamgage at Falling Creek of 380 ft3/s, 647 ft3/s, 862 ft3/s, 1,217 ft3/s, 1,552 ft3/s, 1,923 ft3/s, and 3,054 ft3/s for the 2-, 5-, 10-, 25-, 50-, 100-, and 500-year floods, respectively. To identify the high-outlier threshold (Qm) and determine the return period corresponding to the largest flood, the following criteria were applied. The length of the time series used in the analysis was n=23 years, representing the 1970-1977 and 1979-1993 periods of record. Using 4n=92 years, the log-normally interpolated 92-year flood from equations 21 and 22 is 1,876 ft3/s. No interpolation is necessary to determine the return period corresponding to the largest flood for either the observed or adjusted (discussed later) annual maximum time series because the observed (5,170 ft3/s) and adjusted (4,220 ft3/s) values exceed the rural 500-year flood of 3,054 ft3/s. A 500-year return period is arbitrarily attached to the largest flood during the periods of record analyzed. Thus, the PeakFQ program was executed for both the observed and adjusted annual maximum time series using station skew, high-outlier threshold (1,876 ft3/s), and historical period (500 years).
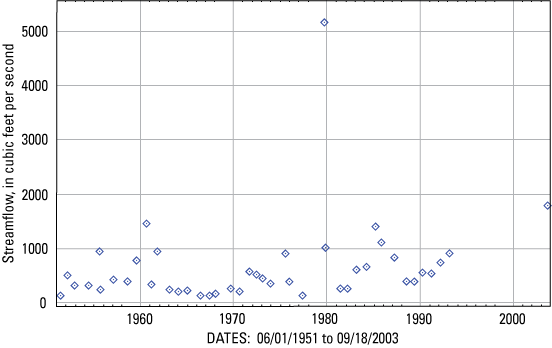
Figure 4. Annual maximum time series for U.S. Geological Survey streamgage 02037800, Falling Creek near Midlothian, Virginia.
This study draws heavily on the idea of developing a time series of changes in the spatial characteristics of the landscape. As a single descriptor of land-use change, imperviousness is the most simple characteristic that can be identified as having a strong influence on flood magnitude. Historical records of imperviousness are scarce, however, in both the spatial and temporal dimensions. For this reason, historical census-derived population-density estimates were used as a surrogate of imperviousness and as a predictor of imperviousness from which to develop the necessary space-time estimates of the changing landscape.
Census data are readily available in 10-year increments and digital format for 1970 through 2000. Assuming linear changes in population density between incremental census data, it is possible to develop space-time estimates of population density for any location in the United States at the resolution of a census tract. Census tracts vary considerably in scale depending on population density. For this study, the focus was on urban areas for which the census data tend to delineate small-scale census tracts. For example, Montgomery County, Maryland, is a densely populated county directly north of Washington, D.C. In the 2000 census, this county was composed of 177 census tracts (GeoLytics, 2003), ranging in size from 0.13 mi2 to 70 mi2 and averaging 2.86 mi2. Population density is not uniformly distributed among these tracts, however, and smaller tracts tend to have greater population densities, as shown in figure 5.
Landscape changes, such as increases in imperviousness, introduction of curb and gutter drainage, and channelization can vary with population density. Using a single, average population-density value and the landscape changes for which it is a surrogate to quantify human influences within a watershed may be a poor model when a watershed is large or if human influences vary considerably. To quantify such variability or nonhomogeneity within a watershed, the distribution of population densities was quantified as a fraction of the total watershed area as shown in the example for USGS streamgage 01645000, Seneca Creek at Dawsonville, Maryland (fig. 6). The population densities that correspond to the 10th and 90th percentiles of the watershed area were tagged, and the difference between these densities was recorded. This quantity (ΔPD) was defined as follows:
 . . | (25) |
The more homogeneous the distribution of population within a watershed, the smaller ΔPD will be. ΔPD is a potentially useful predictor, as discussed in the earlier section on Adjustment Models.
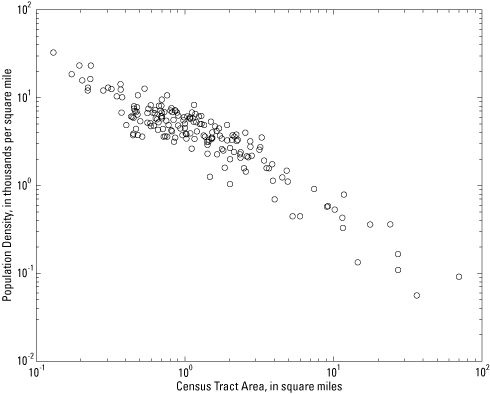
Figure 5. Population density in Montgomery County, Maryland, as a function of census-tract area from the 2000 census.
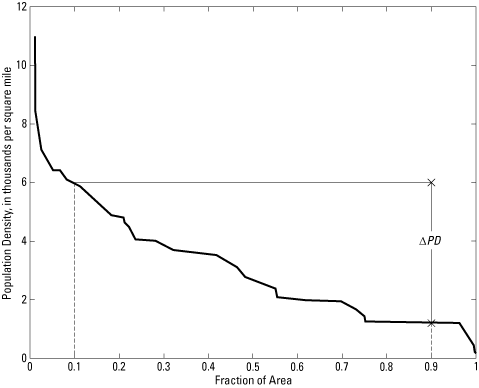
Figure 6. Distribution of population density as a fraction of the total watershed area for U.S. Geological Survey streamgage 01645000, Seneca Creek at Dawsonville, Maryland. [ΔPD is the difference in population density between the 10th and 90th percentiles of the distribution of population density in the watershed.]
The 2001 NLCD includes imperviousness mapping product at 30-meter resolution. Each pixel reports a value of imperviousness as a percentage of the total area of the pixel. The determination of the percentage of imperviousness across an entire watershed is straightforward and requires simply calculating the average imperviousness from the set of pixels within the watershed.
A time series of historical land-use (or imperviousness) data covering several decades and uniformly available at the national scale does not exist. Because of the need to develop estimates of imperviousness for each year for each watershed being studied, it was necessary to develop a procedure that could be uniformly applied to each watershed.
The imperviousness layer from the 2001 NLCD was obtained for the central region of Maryland because it was available and because this region includes two highly urbanized areasBaltimore, Maryland, and Washington, D.C. Similarly, tract data from the 2000 census were obtained. For each census tract, the population density (in thousands of people per square mile) was determined based on the reported total population and the area of the tract as determined by using GIS. Similarly, the tract outlines were used to sample the 2001 NLCD imperviousness layer and to determine the average imperviousness for each tract. Several different models were investigated for describing the relation between population density and imperviousness. A simple power model was selected to provide the best compromise between statistical power and model rationality. The calibrated equation took the following form:
 , , | (26) |
| where IA | is imperviousness, in percent; and | |
| PD | is population density in thoursands of people per square mile. |
This equation was determined for 0.0002 < PD < 176.4 and 0.08 < IA < 96.66. The median PD and IA values were 3.87 and 21.8, respectively. The regression was performed using data from 998 census tracts. The ratio of the standard error (Se) of equation 26 to the standard deviation (Sd) of observed imperviousness was Se/Sd = 0.6163, with an explained variance of 62.1 percent.
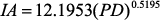
The regression equation developed by Stankowski (1972) to estimate imperviousness from population density in New Jersey had a different form from that of equation 26:
 . . | (27) |
| where IA | is imperviousness, in percent; and | |
| PD | is population density, in persons (not thousands of persons) per square mile. |
The results of both equations, however, are quite comparable, as shown in figure 7.
In focusing on predicted imperviousness between 0 and 50 percent, which is the typical range observed in most watersheds, the maximum departure between the two methods is about 1.2 percent (fig. 7). The estimated imperviousness obtained by using equation 27 is 31.0 percent and 29.8 percent by using equation 26 for a population density of approximately 5,660 persons per square mile. While the difference is small, it is even less significant considering that most of the watersheds in this study had lower population densities and, thus, smaller estimated imperviousness. The typical departure in estimates of imperviousness between the two methods for the watersheds included in this study was less than 1.0 percent.
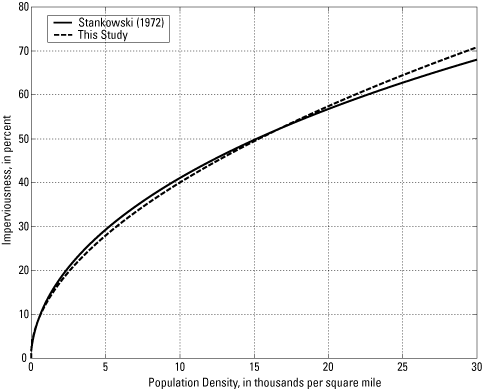
Figure 7. Relations of imperviousness to population density as measured by Stankowski (1972) and as measured in this study.
Historical census tract data were obtained for 1970, 1980, 1990, and 2000. Population density and estimated imperviousness were determined, using equation 26, for each census tract in each study watershed for each census period. The watershed boundary was then used to select all intersecting census tracts, and an area-weighted average of imperviousness for each census period was determined for each watershed. Imperviousness was assumed to vary linearly between each census measure.
In the event of decreasing population density over time, the estimate of imperviousness naturally would decline (eq. 26). Although population could decrease, imperviousness was assumed to be a strictly nondecreasing function with time and, therefore, was assumed to remain at the previous value. Of the 78 watersheds studied, 10 had decreasing population estimates and nonvarying estimates of imperviousness during the entire gaged period.
To illustrate the use of historical census data in estimating imperviousness, census tract data were obtained for the watershed of USGS streamgage 01645000, Seneca Creek at Dawsonville, Maryland (fig. 8). Equation 26 was applied to population densities for 1970, 1980, 1990, and 2000. The resulting imperviousness estimations for these years were 4.84 percent, 7.48 percent, 11.23 percent, and 12.99 percent, respectively.
Figure 8. Estimated imperviousness from census-tract data for U.S. Geological Survey streamgage 01645000, Seneca Creek at Dawsonville, Maryland. [Imperviousness in this figure ranges from 0 to 40 percent. Darker shades correspond to high degrees of imperviousness.]
Previously, in the Methods section the need to censor gages with non-elevated flood-frequency was discussed. The actual numbers of streamgages that were used in the calibration of the adjustment equations as a function of the flood-frequencies being considered are given in table 2.
Table 2. Number of gages used in the regression analysis as a function of return period.
| Return period (years) | 2 | 5 | 10 | 25 | 50 | 100 | 500 |
|---|---|---|---|---|---|---|---|
| Number of streamgages used | 52 | 52 | 50 | 48 | 43 | 41 | 28 |
In total, information was obtained from 61 of the 78 streamgages (identified by italics in appendix 2) for at least one of the seven frequencies for which urban regression equations were calibrated in this study. In other words, of the 78 streamgages originally selected for use in this study, observed flood-frequency estimates for 17 of the streamgages were no greater than the rural regression estimates for any of the seven frequencies examined. The explanation for this is attributed collectively to error inherent in the rural regression equations, possible error in the discharge measurement or corresponding rating curve, error in the flood-frequency analysis, and other inherent characteristics (such as manmade storage or missing basin attributes) that may have served to reduce the flood magnitudes as predicted by the rural regression equations.
The goodness-of-fit characteristics for the model calibrations are presented in table 3, and the calibrated coefficients are shown in table 4. Table 3 presents standard error (Se) calculated as
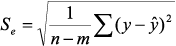 . . | (28) |
| where n | is the number of observations, | |
| m | is the number of coefficients or exponents being calibrated, | |
| y | is the observed discharge (from the PeakFQ output), and | |
 |
is the predicted output calibrated by the nonlinear regression tool. |
Standard deviation (Sy) is calculated as
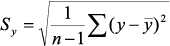 , , | (29) |
where  |
is the mean of the discharges for the return period (T). |
Explained variance (R2) is calculated as
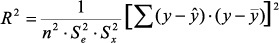 , , | (30) |
where
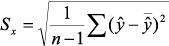 , , | (31) |
in which  is the mean of the predicted discharges for the return period (T).
Table 3. Goodness-of-fit characteristics for the models evaluated.
[All statistics presented are for log-transformed discharges: log10(Q). Bold values are best values for the return period.]| Model | Explained variance (R2) | Standard error ratio (Se/Sy) | ||||||||||||||
|---|---|---|---|---|---|---|---|---|---|---|---|---|---|---|---|---|
| Return period (years) | Return period (years) | |||||||||||||||
| 2 | 5 | 10 | 25 | 50 | 100 | 500 | 2 | 5 | 10 | 25 | 50 | 100 | 500 | |||
| Null | 0.821 | 0.859 | 0.864 | 0.902 | 0.899 | 0.889 | 0.814 | 0.390 | 0.378 | 0.341 | 0.265 | 0.261 | 0.277 | 0.446 | ||
| Simple imperviousness | 0.818 | 0.866 | 0.879 | 0.909 | 0.902 | 0.884 | 0.801 | 0.392 | 0.389 | 0.348 | 0.281 | 0.277 | 0.310 | 0.480 | ||
| Simple density | 0.818 | 0.866 | 0.877 | 0.907 | 0.897 | 0.881 | 0.804 | 0.397 | 0.363 | 0.328 | 0.257 | 0.298 | 0.311 | 0.478 | ||
| Imperviousness distribution | 0.832 | 0.867 | 0.874 | 0.909 | 0.901 | 0.897 | 0.855 | 0.385 | 0.374 | 0.338 | 0.292 | 0.268 | 0.271 | 0.356 | ||
| Density distribution | 0.833 | 0.870 | 0.874 | 0.902 | 0.893 | 0.889 | 0.779 | 0.383 | 0.368 | 0.335 | 0.278 | 0.289 | 0.297 | 0.526 | ||
| Scaled imperviousness | 0.822 | 0.873 | 0.869 | 0.904 | 0.900 | 0.884 | 0.810 | 0.409 | 0.396 | 0.365 | 0.288 | 0.280 | 0.310 | 0.528 | ||
| Scaled density | 0.823 | 0.861 | 0.873 | 0.904 | 0.900 | 0.887 | 0.821 | 0.409 | 0.414 | 0.361 | 0.289 | 0.287 | 0.307 | 0.464 | ||
Table 4. Calibrated values of the adjustment model coefficients and exponents.
[Variables for all models are defined in equations 12-18.]| Model | Variable | Return period (years) | ||||||
|---|---|---|---|---|---|---|---|---|
| 2 | 5 | 10 | 25 | 50 | 100 | 500 | ||
| Null | c1 | 0.275 | 0.489 | 0.305 | 0.330 | 0.305 | 0.330 | 0.330 |
| c2 | 1.10 | 1.04 | 1.10 | 1.10 | 1.10 | 1.10 | 1.10 | |
| Simple imperviousness | c1 | 0.289 | 0.331 | 0.33 | 0.33 | 0.228 | 0.225 | 0.263 |
| c2 | 1.16 | 1.15 | 1.16 | 1.16 | 1.15 | 1.15 | 1.12 | |
| c3 | 0.177 | 0.173 | 0.176 | 0.176 | 0.0383 | 0.0446 | 0.035 | |
| Simple density | c1 | 0.27 | 0.315 | 0.314 | 0.368 | 0.35 | 0.35 | 0.308 |
| c2 | 1.10 | 1.10 | 1.10 | 1.10 | 1.10 | 1.10 | 1.10 | |
| c3 | 0.05 | 0.0987 | 0.0977 | 0.0642 | 0.172 | 0.172 | 0.0474 | |
| Imperviousness distribution | c1 | 0.33 | 0.42 | 0.405 | 0.435 | 0.363 | 0.293 | 0.251 |
| c2 | 1.10 | 1.10 | 1.10 | 1.10 | 1.10 | 1.10 | 1.10 | |
| c3 | 0.134 | 0.159 | 0.135 | 0.101 | 0.0819 | 0.0148 | 0.0229 | |
| c4 | 0.0687 | 0.025 | 0.0166 | 0.0425 | 0.0388 | 0.0666 | 0.108 | |
| Density distribution | c1 | 0.27 | 0.313 | 0.312 | 0.315 | 0.304 | 0.345 | 0.332 |
| c2 | 1.10 | 1.10 | 1.10 | 1.10 | 1.10 | 1.10 | 1.10 | |
| c3 | 0.171 | 0.228 | 0.111 | 0.155 | 0.140 | 0.136 | 0.198 | |
| c4 | 0.11 | 0.062 | 0.0264 | 0.0739 | 0.0963 | 0.126 | 0.113 | |
| Scaled imperviousness | c1 | 0.288 | 0.315 | 0.3 | 0.3 | 0.3 | 0.315 | 0.285 |
| c2 | 1.15 | 1.15 | 1.15 | 1.15 | 1.15 | 1.15 | 1.15 | |
| c3 | 0.11 | 0.148 | 0.0997 | 0.1 | 0.1 | 0.109 | 0.0898 | |
| c4 | 0.131 | 0.29 | 0.2 | 0.167 | 0.105 | 0.149 | 0.204 | |
| I* | 13.9 | 20.1 | 9 | 12.5 | 7.54 | 10.2 | 13.1 | |
| Scaled density | c1 | 0.287 | 0.3 | 0.3 | 0.3 | 0.3 | 0.296 | 0.284 |
| c2 | 1.15 | 1.15 | 1.15 | 1.15 | 1.15 | 1.15 | 1.15 | |
| c3 | 0.11 | 0.1 | 0.125 | 0.0944 | 0.108 | 0.108 | 0.109 | |
| c4 | 0.271 | 0.505 | 0.765 | 0.213 | 0.000488 | 0.00469 | 0.00907 | |
| PD* | 1.05 | 1.2 | 3.04 | 0.960 | 0.284 | 0.369 | 0.519 | |
As shown in table 3, the null model performed almost as well as the more sophisticated models, especially in regard to the standard error ratio measure. It must be noted, however, that only urban streamgages were used in this study. In particular, the calibrated equations were developed only for urban gages where the observed flood-frequency was associated with greater discharges than those predicted by the rural regression equations. Given such a dataset from which to calibrate an equation, the null model was certain to perform well simply because the data were already screened for the tendency to produce elevated flood magnitudes. The null model could be expected to have a poorer performance if both rural and urban streamgages were in the dataset. Further, the major shortcoming of the null model is that it will not predict larger urban discharges in relation to larger amounts of urbanization (imperviousness or density). The value of the null model is to provide some information about the additional predictive power of the models that include imperviousness in the flow-adjustment scheme.
Provided that a model that accounts quantitatively for urbanization is needed, the question now turns to which model of those examined performs best. An absolute best model is not indicated in table 3 because only seven models were examined, and it is impossible to prove logically that the very best mathematical form was investigated. Nevertheless, the models examined encompass several different approaches to adjusting flows, and their performance probably is not far removed from the hypothetical best adjustment model. Further, the relative performance of the seven models varied, depending on the measure (explained variance or relative standard error) and the flood-frequency being considered (table 3). The goodness-of-fit values in table 3 were ranked within each measure and return period and the best performing model received a ranking of 1 with subsequent rankings increasing as model performance decreased (table 5). The rankings then were summed across both the explanatory measures and flood-frequencies, and the model producing the overall smallest sum was considered to be the best overall model among those considered. These summed rankings are presented in table 6.
Table 5. Rankings of model performance based on the goodness-of-fit values show in table 3.
| Model | Explained variance (R2) | Standard error ratio (Se/Sy) | ||||||||||||||
|---|---|---|---|---|---|---|---|---|---|---|---|---|---|---|---|---|
| Return period (years) | Return period (years) | |||||||||||||||
| 2 | 5 | 10 | 25 | 50 | 100 | 500 | 2 | 5 | 10 | 25 | 50 | 100 | 500 | |||
| Null | 5 | 6 | 7 | 6 | 5 | 3 | 3 | 3 | 4 | 4 | 4 | 1 | 2 | 2 | ||
| Simple imperviousness | 6 | 4 | 1 | 1 | 1 | 5 | 6 | 4 | 5 | 5 | 5 | 3 | 5 | 5 | ||
| Simple density | 6 | 4 | 2 | 3 | 6 | 7 | 5 | 5 | 1 | 1 | 1 | 7 | 7 | 4 | ||
| Imperviousness distribution | 2 | 3 | 3 | 1 | 2 | 1 | 1 | 2 | 3 | 3 | 3 | 2 | 1 | 1 | ||
| Density distribution | 1 | 2 | 3 | 6 | 7 | 2 | 7 | 1 | 2 | 2 | 2 | 6 | 3 | 6 | ||
| Scaled imperviousness | 4 | 1 | 6 | 4 | 3 | 5 | 4 | 6 | 6 | 7 | 7 | 4 | 5 | 7 | ||
| Scaled density | 3 | 7 | 5 | 4 | 3 | 4 | 2 | 6 | 7 | 6 | 6 | 5 | 4 | 3 | ||
Table 6. Summed rankings of model-calibration statistics based on goodness-of-fit values given in table 3.
[Bold values are best values for each column.]| Model | Explained variance, R2 sum |
Standard error ratio, Se/Sy sum |
Overall sum (Overall rank) |
||||
|---|---|---|---|---|---|---|---|
| Null | 35 | 20 | 55 (3) | ||||
| Simple imperviousness | 24 | 32 | 56 (4) | ||||
| Simple density | 33 | 26 | 59 (5) | ||||
| Imperviousness distribution | 13 | 15 | 28 (1) | ||||
| Density distribution | 28 | 22 | 50 (2) | ||||
| Scaled imperviousness | 27 | 42 | 69 (7) | ||||
| Scaled density | 28 | 37 | 65 (6) | ||||
This ranking scheme indicates that the best overall performing model was the imperviousness distribution model (table 6). This assertion can be confirmed by a closer examination of table 3 in which the imperviousness distribution model produced the largest explained variance in three of the seven flood-frequencies examined and was among the top three performing models in this measure. With respect to relative standard error, the imperviousness distribution model is the best model in two of the seven flood-frequencies and was always among the top three performing models in this measure. In ranking overall performance, the imperviousness distribution model performed the best (slightly better than the density distribution model) with regard to explained variance and relative standard error (table 5).
In regard to the remaining models, one could ask two questions. First, does population density serve as a stronger predictor than imperviousness? Second, does the simple approach, such as simple imperviousness or simple density, outperform the distribution or scaled approach?
With regard to the first question, the tabulated results (table 5) indicate a modest advantage for imperviousness over density as a predictor. The imperviousness distribution model ranked first overall, whereas the density distribution model ranked second. The simple imperviousness model ranked fourth overall, whereas the simple density model ranked fifth. The opposite trend occurred for the scaled modelsthe imperviousness-based model ranked seventh (last) and the density-based model ranked sixth. Thus, the results slightly favor imperviousness over population density as a predictor of flood-frequency magnitude.
With regard to the second question, the distribution approach (eqs. 15, 16) ranked first, followed by the simple approach (eqs. 13, 14); the scaled models (eqs. 17, 18) performed the worst. This result is interesting because the simple models require the calibration of three parameters; the distribution models require four parameters, and the scaled models require five parameters. Generally, a more complex model would be expected to perform best because it has more flexibility to conform to the observed data. In this case, the moderately complex model performs best. The ΔPD or ΔIA term of the distribution model structure apparently is an effective way of quantifying urban heterogeneity within a watershed and, therefore, is useful in predicting flood behavior.
The calibration results for all models are presented in table 4. (Appendix 3 contains plots for comparing predicted and observed discharges for the calibrated simple imperviousness model, which is fairly representative of other model calibrations as well.) While the values shown in table 4 represent optimum calibration results, a brief examination of this table reveals somewhat erratic trends in many calibration parameters as return period varies. It would be expected that these parameters vary smoothly from one return period to the next. Towards this end, a secondary smoothing was performed for each calibration parameter using a linear regression model:
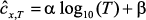 , , | (32) |
| where T | is the return period and | |
| α and ß | are determined by regressing the calibrated values of cx,T on log10(T). |
These smoothed parameter values were used in all subsequent analyses, because it was felt these values were more representative of the true relations between rural and urban flood magnitudes (table 7). Appendix 4 contains the calibrated and smoothed coefficients plotted against return periods for each adjustment model.
Table 7. Smoothed values of the adjustment model coefficients and exponents.
[Variables for all models are defined in equations 12-18.]| Model | Variable | Return period (years) | ||||||
|---|---|---|---|---|---|---|---|---|
| 2 | 5 | 10 | 25 | 50 | 100 | 500 | ||
| Null | c1 | 0.289 | 0.297 | 0.303 | 0.311 | 0.317 | 0.324 | 0.338 |
| c2 | 1.10 | 1.10 | 1.10 | 1.10 | 1.10 | 1.10 | 1.10 | |
| Simple imperviousness | c1 | 0.327 | 0.312 | 0.301 | 0.287 | 0.276 | 0.264 | 0.239 |
| c2 | 1.16 | 1.16 | 1.16 | 1.15 | 1.15 | 1.14 | 1.13 | |
| c3 | 0.200 | 0.170 | 0.147 | 0.117 | 0.095 | 0.072 | 0.019 | |
| Simple density | c1 | 0.305 | 0.312 | 0.318 | 0.325 | 0.330 | 0.336 | 0.349 |
| c2 | 1.10 | 1.10 | 1.10 | 1.10 | 1.10 | 1.10 | 1.10 | |
| c3 | 0.0856 | 0.0910 | 0.0950 | 0.100 | 0.104 | 0.108 | 0.118 | |
| Imperviousness distribution | c1 | 0.414 | 0.393 | 0.378 | 0.357 | 0.341 | 0.325 | 0.289 |
| c2 | 1.10 | 1.10 | 1.10 | 1.10 | 1.10 | 1.10 | 1.10 | |
| c3 | 0.161 | 0.136 | 0.118 | 0.0927 | 0.0740 | 0.0552 | 0.0115 | |
| c4 | 0.0269 | 0.0361 | 0.0431 | 0.0523 | 0.0592 | 0.0662 | 0.0823 | |
| Density distribution | c1 | 0.289 | 0.297 | 0.304 | 0.313 | 0.320 | 0.326 | 0.342 |
| c2 | 1.10 | 1.10 | 1.10 | 1.10 | 1.10 | 1.10 | 1.10 | |
| c3 | 0.166 | 0.165 | 0.164 | 0.163 | 0.162 | 0.161 | 0.159 | |
| c4 | 0.066 | 0.073 | 0.079 | 0.087 | 0.093 | 0.098 | 0.112 | |
| Scaled imperviousness | c1 | 0.303 | 0.302 | 0.301 | 0.300 | 0.300 | 0.299 | 0.298 |
| c2 | 1.15 | 1.15 | 1.15 | 1.15 | 1.15 | 1.15 | 1.15 | |
| c3 | 0.123 | 0.117 | 0.113 | 0.108 | 0.104 | 0.100 | 0.0911 | |
| c4 | 0.189 | 0.185 | 0.182 | 0.178 | 0.175 | 0.172 | 0.165 | |
| I* | 14.4 | 13.7 | 13.1 | 12.3 | 11.8 | 11.2 | 9.88 | |
| Scaled density | c1 | 0.298 | 0.297 | 0.296 | 0.295 | 0.295 | 0.294 | 0.292 |
| c2 | 1.15 | 1.15 | 1.15 | 1.15 | 1.15 | 1.15 | 1.15 | |
| c3 | 0.108 | 0.108 | 0.108 | 0.108 | 0.108 | 0.108 | 0.107 | |
| c4 | 0.512 | 0.418 | 0.347 | 0.253 | 0.182 | 0.111 | -0.0539 | |
| PD* | 1.67 | 1.45 | 1.28 | 1.06 | 0.893 | 0.725 | 0.336 | |
As stated previously, the functions, fn(.) can be rearranged to express the urban peak discharge as a function of the rural peak discharge and imperviousness. For simplicity, the equation 11 can be revised as follows:
 . . | (33) |
Thus, the null model is rearranged as
 , , | (34) |
the simple imperviousness model is rearranged as
 , , | (35) |
the simple density model is rearranged as
 , , | (36) |
the imperviousness distribution model is rearranged as
 , , | (37) |
the density distribution model is rearranged as
 , , | (38) |
the scaled imperviousness model is rearranged as
 , , | (39) |
and the scaled density model is rearranged as
 , , | (40) |
where IA is the impervious area, in percent, for the watershed conditions at which the urban discharge estimate is desired.
The coefficients and (or) exponents, cx,T, refer to the coefficients outlined in the models presented in equations 12-18 for the T-year prediction equation. Note that equations 12-18 refer to adjustment models that convert urbanized discharges to equivalent rural ones, whereas equations 33-40 convert rural discharges to urban ones.
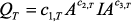
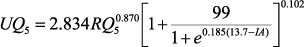
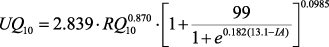
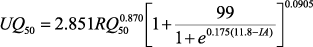
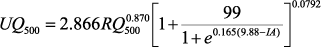
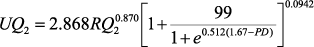
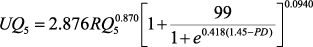
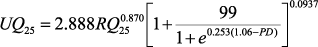
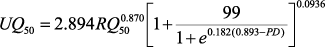
Based on the smoothed coefficients and (or) exponents given in table 7, seven sets of urban equations are given based on the calibrated null, simple imperviousness, simple density, imperviousness distribution, density distribution, scaled imperviousness, and scaled density adjustment models. For the null model, the resulting urban equations are as follows:
 , , | (41) |
 , , | (42) |
 , , | (43) |
 , , | (44) |
 , , | (45) |
 , , | (46) |
and
 . . | (47) |
The calibrated urban equations for the simple imperviousness model are as follows:
 , , | (48) |
 , , | (49) |
 , , | (50) |
 , , | (51) |
 , , | (52) |
 , , | (53) |
and
 . . | (54) |
The calibrated urban equations for the simple density model are as follows:
 , , | (55) |
 , , | (56) |
 , , | (57) |
 , , | (58) |
 , , | (59) |
 , , | (60) |
and
 . . | (61) |
The calibrated urban equations for the imperviousness distribution model are as follows:
 , , | (62) |
 , , | (63) |
 , , | (64) |
 , , | (65) |
 , , | (66) |
 , , | (67) |
and
 . . | (68) |
The calibrated urban equations for the density distribution model are as follows:
 , , | (69) |
 , , | (70) |
 , , | (71) |
 , , | (72) |
 , , | (73) |
 , , | (74) |
and
 . . | (75) |
For the scaled imperviousness model, the calibrated urban equations are as follows:
 , , | (76) |
 , , | (77) |
 , , | (78) |
 , , | (79) |
 , , | (80) |
 , , | (81) |
and
 . . | (82) |
Finally, for the scaled density model, the calibrated urban equations are as follows:
 , , | (83) |
 , , | (84) |
 , , | (85) |
 , , | (86) |
 , , | (87) |
 , , | (88) |
and
 . . | (89) |
A positive exponent on any predictor variable indicates a positive relation between that predictor and the urban discharge; a negative exponent indicates a negative relation. All of the model forms have positive exponents on all predictors except the ΔIA and ΔPD terms (eqs. 62-75), which have negative exponents. (One other exception, which will be discussed later, occurred for c4 in equation 89.) It can be concluded quickly that all exponents are rational because the urban flood magnitude is expected to increase with increasing rural flood magnitude, increasing imperviousness, and increasing population density. Although the negative sign on the ΔIA and ΔPD terms is less obvious, it indicates that as the watershed becomes more varied spatially in urbanization, the predicted discharge decreases. In essence, the ΔIA and ΔPD terms serve to temper the IA or PD terms, which convey only the average imperviousness or population density in a watershed but not variability. Finally, the positive signs on the two parameters that control the scaled sigmoid function presented in figure 8 are worth noting.
Trends in the parameter values as return period increases also are important to examine. Generally, as the return period increases, one might expect to see diminishing effects of urbanization on flood magnitude. For example, the 2-year flood would be expected to have greater dependence on urbanization than the 100-year flood, and trends in the parameter values would be expected to support this. The following discussion focuses on the rationality of the trends for each model:
The results of the rationality analysis are summarized as follows:
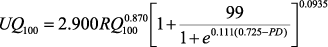
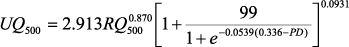
Each of the above equations (eqs. 41-89) was divided by RQT to produce the ratio of urban to rural discharge (UQ/RQ). Assuming a vector of rural flood-frequency values (Qff,rural), the UQ/RQ was determined as a function of varying imperviousness. To visualize results of this approach, each model was applied to values in two watersheds, one fairly large and one fairly small. The fairly large watershed (102 mi2) was represented by USGS streamgage 01645000, Seneca Creek at Dawsonville, Maryland; the fairly small watershed (2.2 mi2) was represented by USGS streamgage 01585200, West Branch Herring Run at Idlewylde, Maryland. The UQ/RQ ratios are shown in figures 9-12.
The three imperviousness models that were investigated have several common characteristics (figs. 9, 11). First, all models indicate a general decline in UQ/RQ, approaching 1, as the return period increases. Because the effects of urbanization are most profound for small magnitude and high-frequency flooding events, the greatest adjustment ratios are required for the small return periods. Also, all models had a greater UQ/RQ value as imperviousness increased. This was not surprising because, all things being equal, higher values of imperviousness would be expected to lead to greater urban discharges. In most cases, the null model results were roughly centered within the spread of imperviousness values and were considered representative of average imperviousness across the datasets evaluated (figs. 9, 11).
The three calibrated population density models were applied to discharge data from the two selected gaging stations to obtain the UQ/RQ values across all return periods (figs. 10, 12). The irrationality in the trend in the population density exponent in the simple density model is shown in figure 10A by the increasing spread of the constant population density traces in relation to return period increases. The tight clustering of the constant population density traces in figure 10C indicates that the calibrated parameters for the scaled population density term do not lead to greatly varying estimates of scaled population density. This is not irrational, but it diminishes the credibility of the scaled population density model.
By comparing the UQ/RQ ratios for imperviousness (figs. 9, 11) and population density (figs. 10, 12) in the two watersheds, the effect of watershed scale is apparent between the two datasets. Herring Run is roughly two orders of magnitude smaller than Seneca Creek, which results in a greater range in UQ/RQ ratios for this smaller watershed. In comparing figures 9A and 11A for the 2-year return period, a UQ/RQ range is observed of 0.8 to 1.6 for Seneca Creek and approximately 1.2 to 2.2 for Herring Run, respectively. The greater range in UQ/RQ ratios for the smaller watershed is because the exponent on RQ, which is positive but less than 1, has the effect of the UQ/RQ ratio varying more widely for small discharges associated with small watersheds.
Figure 9. Application of the (A) simple imperviousness model, (B) imperviousness distribution model, and (C) scaled imperviousness model to the ratio of urban to rural discharges as a function of return period and imperviousness at U.S. Geological Survey streamgage 01645000, Seneca Creek at Dawsonville, Maryland. [The heavy dashed line shows the ratio for the "null" model. The light lines indicate imperviousness increasing in 2-percent increments starting from 0 percent for the lowest trace.]
Figure 10. Application of the (A) simple density model, (B) density distribution model, and (C) scaled density model to the ratio of urban to rural discharges as a function of return period and imperviousness at U.S. Geological Survey streamgage 01645000, Seneca Creek at Dawsonville, Maryland. [The heavy dashed line shows the ratio for the null model. The light lines indicate population density increasing in increments of 1,000 persons per square mile starting from 0 persons per square mile for the lowest trace.]
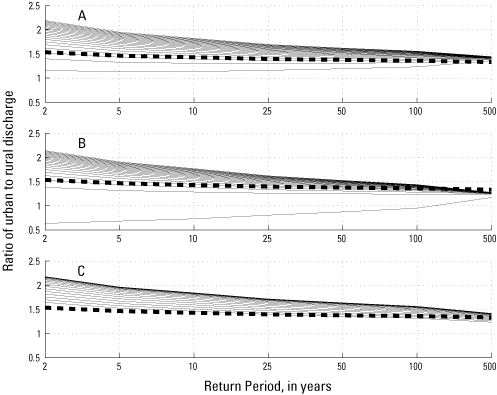
Figure 11. Application of the (A) simple imperviousness model, (B) imperviousness distribution model, and (C) scaled imperviousness model to the ratio of urban to rural discharges as a function of return period and imperviousness at U.S. Geological Survey streamgage 01585200, West Branch Herring Run at Idlewylde, Maryland. [The heavy dashed line shows the ratio for the null model. The light lines indicate imperviousness increasing in 2-percent increments starting from 0 percent for the lowest trace.]
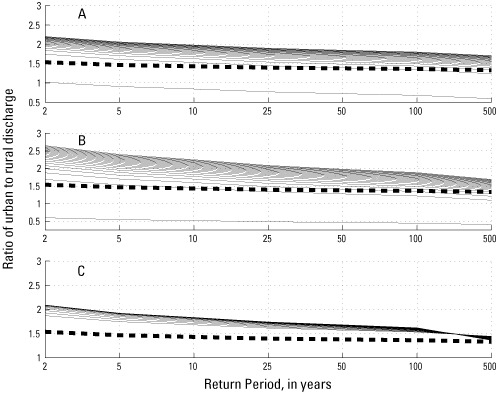
Figure 12. Application of the (A) simple density model, (B) density distribution model, and (C) scaled density model to the ratio of urban to rural discharges as a function of return period and imperviousness at U.S. Geological Survey streamgage 01585200, West Branch Herring Run at Idlewylde, Maryland. [The heavy dashed line shows the ratio for the null model. The light lines indicate population density increasing in increments of 1,000 persons per square mile starting from 0 persons per square mile for the lowest trace.]
Application of the urban equations in Sauer and others (1983) to the database assembled for this current study was not possible because all of the equations developed in the earlier work included many watershed characteristics that were not gathered for the current study, most notably the basin development factor (BDF). It is possible, however, to return to the dataset from Sauer and others (1983) and apply three of the equations generated in the current study.
The three equations represent the null model, the simple imperviousness model, and the scaled imperviousness model. The adjustment models that included population density and (or) imperviousness distribution as predictors could not be compared because these data were not measured or presented in the dataset generated by Sauer and others (1983). Another model was added, however; the Sauer (null) model is the analog of the null model presented in the current study. The Sauer (null) model was calibrated as a simple power model of the rural discharge,
 , , | (90) |
using a logarithmic transformation of the rural and urban discharges and calibrating a linear model through least-squares regression. The purpose of the Sauer (null) model was to provide some perspective on the merits of the seven-parameter Sauer and others (1983) model relative to the simplest possible model.
The mean bias and relative standard error were examined for the seven-parameter model (Sauer and others, 1983), the Sauer (null) model, and the three models developed in the current study as applied to the seven return periods (table 8). For the purposes of this report, mean bias was calculated as the average difference between predicted discharges (from the equations developed in this report) and observed urban flood-frequency (reported by Sauer and others, 1983).
Table 8. Performance of U.S. Geological Survey urban equations from an earlier study and urban equations developed in this report.
[Bold values indicate overall best model performance. Italic values indicate best model performance developed in this report. ft3/s, cubic feet per second]
| Mean bias (ft3/s) | Relative standard error: Se/Sy | |||||||||||
|---|---|---|---|---|---|---|---|---|---|---|---|---|
| Return period (years) | Sauer (null) | Sauer* | Null | Siimple | Scaled | Sauer (null) | Sauer* | Null | Simple | Scaled | ||
| 2 | -127 | -1111 | -33 | -111 | 32 | 0.462 | 0.381 | 0.486 | 0.461 | 0.461 | ||
| 5 | -171 | -178 | -80 | -214 | 6 | 0.463 | 0.425 | 0.466 | 0.477 | 0.467 | ||
| 10 | -235 | -141 | -174 | -285 | -65 | 0.474 | 0.449 | 0.474 | 0.496 | 0.481 | ||
| 25 | -357 | -289 | -388 | -455 | -241 | 0.493 | 0.490 | 0.496 | 0.523 | 0.507 | ||
| 50 | -537 | -281 | -553 | -644 | -377 | 0.520 | 0.518 | 0.521 | 0.550 | 0.534 | ||
| 100 | -675 | -300 | -867 | -734 | -658 | 0.532 | 0.533 | 0.540 | 0.573 | 0.555 | ||
| 500 | -1,200 | -1,150 | -1,748 | -1,106 | -1,458 | 0.600 | 0.600 | 0.600 | 0.586 | 0.612 | ||
In general, the equations from Sauer and others (1983) performed best in predicting urban discharges across the 203 streamgages in the study, especially in terms of standard error (table 8). This would be expected because Sauer and others (1983) used these gages to calibrate their equations. Although the three new models calibrated in the current study did not make use of the database from Sauer and others (1983), the prediction ability of these new models was respectable as evidenced by similar, albeit slightly poorer, bias and standard error values (table 8). This is somewhat surprising in that this comparison is not exactly fair given the possibility for systematic differences in the way imperviousness was measured in the two studies and the fact that this is the calibration set for the Sauer and others (1983) equations. Further, the Sauer (null) model shows comparable relative standard error performance for the 25- through 500-year return periods. The complexity of the seven-parameter model from Sauer and others (1983) seems to yield meaningfully better predictions relative to the other models only for the 2-, 5-, and 10-year return periods. Finally, the performance of the new models developed in this study is even more impressive when considering the use of only two predictors (rural discharge and imperviousness) in these models.
To further quantify the performance of the three models developed in this (current) study, the relative standard errors of each of the new models (null, simple, and scaled) were normalized by the relative standard error from the seven-parameter Sauer and others (1983) model for the same return period. Each of the three new models performed similarly across all return periods (table 9). On average, the standard error of the three new models was about 6 to 9 percent greater than the equivalent standard error from Sauer and others (1983). Standard error is not uniform across return periods, however, but tends to decrease as the return period increases.
Table 9. Relative standard error (Se/Sy) for three imperviousness models developed in this report as normalized by the relative standard error determined by Sauer and others (1983).
| Return period (years) | Null | Simple | Scaled | Mean | |||||||
|---|---|---|---|---|---|---|---|---|---|---|---|
| 2 | 1.244 | 1.218 | 1.205 | 1.223 | |||||||
| 5 | 1.094 | 1.146 | 1.106 | 1.115 | |||||||
| 10 | 1.047 | 1.120 | 1.078 | 1.082 | |||||||
| 25 | 1.004 | 1.073 | 1.040 | 1.039 | |||||||
| 50 | 1.002 | 1.052 | 1.034 | 1.029 | |||||||
| 100 | 1.016 | 1.048 | 1.048 | 1.037 | |||||||
| 500 | 1.000 | 0.976 | 1.020 | 0.999 | |||||||
| Mean | 1.058 | 1.090 | 1.076 | 1.075 | |||||||
This finding mirrors the performance of the Sauer (null) model, which produced poorer relative standard errors for the 2-, 5-, and 10-year return periods and then was essentially equivalent in relative standard error to the seven-parameter model (Sauer and others, 1983) for all larger flood events.
A total of 10 USGS streamgages were identified in New Jersey (Stankowski, 1974), Pennsylvania (Stuckey and Reed, 2000), and Wisconsin (Walker and Krug, 2003) that were subject to substantial urbanization. A set of USGS peak flow regression equations that include an imperviousness or urbanization descriptor is available for each of these States. For each of the 10 urban streamgages, watershed characteristics were determined and regression equations were applied twicefirst, to obtain the best estimate of the current urban flow, and second, to set the urban descriptor (either imperviousness or urban area) at zero to develop an equivalent rural flow. The watershed characteristics for the 10 streamgages are provided in appendix 5, and the rural and urban flood-frequency results are provided in appendix 6.
The following example is given for USGS streamgage 01393450, Elizabeth at Ursino Lake at Elizabeth, New Jersey. The 2-year USGS regression equation for New Jersey is as follows:
 , , | (91) |
where the constants of 1 are added by default on the chance that either of these quantities would be zero for a particular watershed being studied. For USGS streamgage 01393450, the drainage area is 17.6 mi2, the channel slope is 22.4 feet per mile, the storage is 1.6 percent, and the imperviousness in 2000 was 41.9 percent. The result of applying equation 91 to these values is an urban 2-year discharge of 1,071 ft3/s. If imperviousness is set at zero (actually 1, as applied in the National Flood-Frequency program), the equivalent rural discharge is 550 ft3/s.
To test the quality of the urban equation models calibrated in this study, the urban equations were applied to the equivalent rural discharge, and the result was compared with the urban value of 1,071 ft3/s. Continuing this example, the simple imperviousness model was applied as follows:
 . . | (92) |
The result of 1,127 ft3/s was compared with the estimated 1,071 ft3/s from equation 91. Similar comparisons were made for the other nine streamgages, and the mean bias results are presented in table 10 and the relative standard error results are presented in table 11.
Table 10. Mean bias, in cubic feet per second, for new urban equations used on data from 10 U.S. Geological Survey streamgages for which localized urban equations are available.
[Bold values indicate overall best model performance.]| Return period (years) | Null | Simple | Distribution | Scaled | |||
|---|---|---|---|---|---|---|---|
| Imperviousness | Density | Imperviousness | Density | Imperviousness | Density | ||
| 2 | -481 | -428 | -391 | -390 | -331 | -403 | -359 |
| 5 | -587 | -431 | -417 | -506 | -392 | -491 | -383 |
| 10 | -592 | -503 | -345 | -541 | -380 | -473 | -305 |
| 25 | -557 | -418 | -191 | -575 | -349 | -404 | -135 |
| 50 | -495 | -288 | -10 | -584 | -305 | -317 | 64 |
| 100 | -385 | -77 | 248 | -569 | -231 | -180 | 341 |
| 500 | 62 | 803 | 1,165 | -406 | 55 | 336 | -1,708 |
Table 11. Relative standard error (Se/Sy) for new urban equations used on data from 10 U.S. Geological Survey streamgages for which localized urban equations are available.
[Bold values indicate overall best model performance.]| Return period (years) | Null | Simple | Distribution | Scaled | |||
|---|---|---|---|---|---|---|---|
| Imperviousness | Density | Imperviousness | Density | Imperviousness | Density | ||
| 2 | 0.486 | 0.454 | 0.409 | 0.417 | 0.378 | 0.500 | 0.428 |
| 5 | 0.361 | 0.284 | 0.252 | 0.311 | 0.249 | 0.376 | 0.280 |
| 10 | 0.298 | 0.262 | 0.178 | 0.271 | 0.200 | 0.311 | 0.202 |
| 25 | 0.234 | 0.192 | 0.139 | 0.238 | 0.166 | 0.243 | 0.138 |
| 50 | 0.201 | 0.160 | 0.174 | 0.221 | 0.162 | 0.209 | 0.148 |
| 100 | 0.177 | 0.156 | 0.236 | 0.202 | 0.162 | 0.184 | 0.196 |
| 500 | 0.218 | 0.307 | 0.439 | 0.184 | 0.209 | 0.222 | 0.361 |
The performance of the models was ranked in the same way as the model calibrations. The sums of ranks for both the mean bias and relative standard error for the performance of the models for the 10 streamgages with local urban equations are given in table 12. Here, mean bias is defined as the average difference between the predicted discharges determined by applying the equations developed in this study and the discharges determined by applying the appropriate (published) State urban regression equations. The strongest performing models were models based on population density; however, all models outperform the null model, which indicates the genuine predictive capabilities that these models offer beyond a simplistic scaling up of a rural discharge.
Table 12. Summed and ranked overall performance of new urban equations used on data from 10 U.S. Geological Survey streamgages for which localized urban equations are available.
[Smaller sums and lower ranks indicate best performance.]| Performance measure | Null | Simple | Distribution | Scaled | |||
|---|---|---|---|---|---|---|---|
| Imperviousness | Density | Imperviousness | Density | Imperviousness | Density | ||
| Sum of mean bias ranks | 41 | 29 | 22 | 40 | 17 | 28 | 19 |
| Sum of relative standard error ranks | 34 | 25 | 25 | 33 | 14 | 42 | 23 |
| Overall Sum | 75 | 54 | 47 | 73 | 31 | 70 | 42 |
| Overall Rank | 7 | 4 | 3 | 6 | 1 | 5 | 2 |
The equations developed in this study appear to be comparable in predictive capability to those developed by Sauer and others (1983). Three models developed during this current studythe null, simple imperviousness, and scaled imperviousness modelswere compared with the best model from the Sauer and others (1983) study. The simple and scaled imperviousness models performed, on average, within about 6 to 9 percent of the results obtained by Sauer and others (1983). The model performance for the more frequent return periods, however, was not as strong. The relative standard error was about 20 to 24 percent greater for the 2-year return period, 10 to 15 percent greater for the 5-year return period, and 5 to 12 percent greater for the 10-year return period that the results obtained by Sauer and others (1983). These results are considered comparable because the statistics from Sauer and others (1983) were based on performance using the same dataset from which the equations were calibrated, and the new models were calibrated using a completely different dataset.
The models developed in this study have two key strengths
The principal weakness of the models developed in this study is the relatively mild dependency of flood magnitude on imperviousness or population density. This mild dependency is underscored by the good performance of the calibrated null model and on the non-smoothness of the calibrated adjustment model parameters shown in table 6. If this method were expanded to more gages or repeated with longer time series as additional data become available, it may be the case that the functional dependency on urbanization measures would become more clear and the need for calibrated model parameter smoothing (shown in table 7) would diminish.
Another weakness of the models, which is apparent from the comparison to data from Sauer and others (1983; see table 8) and to the locally available urban equations (table 10), is a clearly negative bias in the errors of all models for the small return periods. A shift to a positive bias occurred for the largest return periods (table 10). The origin of this bias is not known with certainty, although it may be a result of the model calibration method which depends on a logarithmic transformation of the observed rural discharges. Because calibration takes place in the logarithmic space, positive and negative errors measured in the arithmetic space are unequal, and a negative bias can result.
Ultimately, the questions one faces are these: Which is the best model form to use? and Are there models that are clearly superior or inferior to the others?
In this study, a new approach was developed, using data from 78 urbanized streamgages across the United States, for calibrating a set of USGS urban regression equations. The rural flood-frequency was determined for each streamgage by using the best available GIS data. The annual maximum time series for the 31-year period, 19702000, formed the observed peak discharge portion of the dataset. GIS techniques were used to develop an annual time series of imperviousness over this period using census-derived population density as a surrogate and predictor of imperviousness. The PeakFQ program1 was embedded in a modified nonlinear optimization program, and several adjustment equations were investigated for calibrating adjustment equations that could scale-back the observed annual maximum time series to an equivalent rural annual maximum time series closely representative of the rural regression equation flood frequency. Seven adjustment models of varying degrees of complexity were calibrated. These models then were compared with earlier USGS urban equations and with urban flood-frequency equations for individual States.
The results indicate that the urban equations developed in this study are comparable in performance to the earlier USGS urban equations but are simpler in that they are dependent only on rural discharge and measures of either imperviousness or population density. Further, the new urban equations can be applied readily by using only remotely sensed data rather than requiring data that can only be measured during site visits to the watershed of interest.
The highest performing models emerging from this study are the imperviousness distribution models (eqs. 62-68) and the population density distribution models (eqs. 69-75). These models depend on three predictors eachrural discharge, imperviousness or population density, and delta imperviousness or delta population density. The imperviousness or population density predictor serves to scale up the rural discharge, and the delta imperviousness or delta population density predictor scales down the discharge. This delta predictor quantifies the homogeneity of the development in a watershed and is calculated readily by GIS techniques using the same spatial data used in determining the imperviousness or population density predictor.
Several directions are worth pursuing in future efforts to develop urban equations.
| A | drainage area of watershed (in square miles) | |
| BFD | basin development factor - a number between 0 and 12 (used in the Sauer and others (1983) urban equations) that represents the degree of channel improvements, channel linings, storm drains and storm sewers, and curb and gutter streets within the upper, middle, and lower third of the watershed | |
| C | percentage of watershed underlain by carbonate rock (in Pennsylvania Region A flood regression equations (in percent)) | |
| CA | percentage of the basin controlled by lakes, swamps, or reservoirs (in Pennsylvania Region A flood regression equations (in percent)) | |
| cx,T | calibrated coefficients or exponents corresponding to parameter x and the T-year flood in one of the adjustment equations | |
| F | forest cover (in percent) | |
| FF(.) | flood-frequency operator in Bulletin 17Bproduces a vector of flood-frequency discharge estimates (in units of cubic feet per second) | |
| ƒT(.) | a discharge adjustment model for return period T | |
|
(.) | a discharge adjustment model for return period T | |
| HP | historical period used as input in Bulletin 17B flood-frequency analysis (in years) | |
| IA | impervious area within the watershed (in percent) | |
| IAx | impervious area corresponding to the xth percentile of the distribution of imperviousness within the watershed (in percent) | |
| IA(t) | impervious area within the watershed in year t (in percent) | |
| ΔIA | difference between the 10th and 90th percentile imperviousness values (in percent) | |
| ΔIA(t) | difference between the 10th and 90th percentile imperviousness values in year t (in percent) | |
 | threshold impervious area for return period T in equation 39 (in percent) | |
| m | the number of coefficients and (or) exponents being calibrated in a discharge adjustment model | |
| n | number of years in a gage record (in years) | |
| n | number of observations (gages) used in the calibration of a discharge adjustment model | |
| P(Qx) | cumulative probability associated with having an annual maximum flood of magnitude Qx | |
| PD | population density (thousands of people per square mile) | |
| PDx | population density corresponding to the xth percentile of the distribution of population density within the watershed (thousands of people per square mile) | |
| PD(t) | population density in year t (thousands of people per square mile) | |
 | threshold population density for return period T in equation 40 (thousands of people per square mile) | |
| ΔPD | difference between the 10th and 90th percentile population density values (thousands of people per square mile) | |
| ΔPD(t) | difference between the 10th and 90th percentile population density values in year t (thousands of people per square mile) | |
| PT | cumulative probability associated with the T-year annual maximum flood | |
| Qadj(t) | the generic adjusted annual maximum flood in year t (in cubic feet per second) | |
| Qadj,T(t) | the T-year adjusted annual maximum flood in year t (in cubic feet per second) | |
| Qff(T) | the T-year flood from a flood-frequency vector (in cubic feet per second) | |
| Qff,rural | the rural flood-frequency vector (2-, 5-, 10-, 25-, 50-, 100-, and 500-year floods) (in cubic feet per second) | |
| Qff,rural | the urban flood-frequency vector (2-, 5-, 10-, 25-, 50-, 100-, and 500-year floods) (in cubic feet per second) | |
| Qff,x | the x (rural or urban) flood-frequency vector (2-, 5-, 10-, 25-, 50-, 100-, and 500-year floods) (in cubic feet per second) | |
| Qff(T) | the T-year flood discharge from flood-frequency analysis (in cubic foot per second) | |
| QT | the T-year flood discharge (in cubic foot per second) | |
| Qobs(t) | the observed annual maximum flood in year t (in cubic foot per second) | |
| Ql | lower bound flood-frequency discharge used in piecewise log-normal interpolation of high-outlier discharge threshold (in cubic foot per second) | |
| Qmax | the largest annual maximum flood in the systematic record of a streamgage (in cubic feet per second) | |
| Qo | in flood-frequency analysis, the high-outlier threshold flood discharge (in cubic feet per second) | |
| Qu | upper-bound flood-frequency discharge used in piecewise log-normal interpolation of high-outlier discharge threshold (in cubic feet per second) | |
| R2 | explained variance of a calibrated regression equation | |
| RI2 | the 2-year, 2-hour rainfall depth (used in the Sauer and others (1983) urban equations in inches) | |
| RQT | rural discharge for the T-year return period (in cubic feet per second) | |
| Sd | standard deviation of imperviousness estimates from a regression equation (in percent) | |
| Sy | standard deviation of discharge estimates from a regression equation (in cubic feet per second) | |
| Se | standard error of discharge (or imperviousness) estimates from a regression equation (in cubic feet per second or in percent) | |
| Se/Sd | relative standard error of imperviousness estimated from population density | |
| SL | the main channel slope measured between the points that are 10 percent and 85 percent of the main channel length upstream from the study site (in feet per mile) | |
| SS | station skew optionan input to a Bulletin 17B flood-frequency analysis | |
| ST | basin storagethe percentage of the drainage basin occupied by lakes, reservoirs, swamps, and wetlands (in percent) | |
| T | return period of flood in question (in years) | |
| Tl | lower bound return period used in piecewise log-normal interpolation of high-outlier discharge threshold (in years) | |
| Tu | upper bound return period used in piecewise log-normal interpolation of high-outlier discharge threshold (in years) | |
| T(Qx) | the return period or frequency of a flood of magnitude Qx (in years) | |
| U | urban development (in Pennsylvania Region A flood regression equations (in percent)) | |
| UQT | urban discharge for the T-year return period (in cubic feet per second) | |
| UQ/RQ | ratio of urban peak discharge to rural peak discharge (A value greater than 1 indicates urban amplification of flood peak) | |
| x | the time series of annual maximum floods reported at a streamgage (reported in cubic feet per second) | |
| y | a single, rural flood-frequency value from a statewide rural regression equation calculated for an arbitrary streamgage and return period (in cubic feet per second) | |
|
| a single, predicted value from an adjusted annual maximum time series calculated for an arbitrary streamgage (in cubic feet per second) | |
|
| the mean of the set of rural flood-frequency values from statewide rural regression equations calculated across all such values for a single return period (in cubic feet per second) | |
|
| the mean of the set of predicted flood-frequency values from adjusted annual maximum time series calculated across all such values for a single return period (in cubic feet per second) | |
| z(Tx) | the standard normal deviate corresponding to a flood of return period Tx | |
| z(Qx) | the standard normal deviate corresponding to a flood of magnitude Qx |
Null: Urban discharges are a power function of rural discharges. The null model has no dependency on imperviousness, population density, or any other watershed characteristic. Because the model does not depend on any watershed characteristics, it is of little practical value by itself but is useful in comparison to other models being calibrated.
Simple Imperviousness: Urban discharges are a power function of rural discharges and percent imperviousness in a watershed.
Simple Density: Urban discharges are a power function of rural discharges and population density in a watershed.
Imperviousness Distribution: Urban discharges are a power function of rural discharges, percentage of imperviousness, and the difference in percentage of imperviousness between the 10th and 90th percentiles of the watershed area. This last quantity captures the homogeneity of the distribution of imperviousness within a watershed. A watershed with a large difference in percentages of imperviousness between these two percentiles has a wide range of urbanization within its domain. A watershed with a small difference is fairly uniform in degree of urbanization.
Density Distribution: Urban discharges are a power function of rural discharges, population density, and the difference in population density between the 10th and 90th percentiles of a watershed area. This last quantity captures the homogeneity of the distribution of population density within a watershed. A watershed with a large difference in population density between these two percentiles has a wide range of urbanization within its domain. A watershed with a small difference is fairly uniform in degree of urbanization.
Scaled Imperviousness: Urban discharges are a power function of rural discharges and scaled imperviousness. This model assumes a nonlinear effect of imperviousness such that the marginal effect of increasing imperviousness is greatest close to the value .
Scaled Density: Urban discharges are a power function of rural discharges and scaled population density. This model assumes a nonlinear effect of population density such that the marginal effect of increasing population density is greatest close to the value .
Sauer (null): Analogous to the null model described above, urban discharges are a power function of rural discharges for the dataset assembled by Sauer and others (1983).
The senior author conducted much of the research presented in this report during 2003-04 while on sabbatical at the USGS in Reston, Virginia. The author thanks the USGS for financial support during this sabbatical. The investigative study summarized in this report benefited from many helpful discussions with current and former USGS personnel, including Steve Blanchard, Timothy A. Cohn, Kate Flynn, John R. Gray, William H. Kirby, Harry F. Lins, and Will Thomas. We are especially thankful for the insightful technical reviews provided by Kenneth Eng and William H. Kirby, the thorough editorial reivews performed by Becky Deckard and Sandy Cooper, and the careful documentation preparation of Annette Ledford.
Andersen, D.G., 1970, Effects of urban development of floods in northern Virginia: U.S. Geological Survey Water-Supply Paper 2001-C, 26 p.
Anderson, J.R., Hardy, E.E., Roach, J.T., and Witmer, R.E., 1976, A land use and land cover classification system for use with remote sensor data: U.S. Geological Survey Professional Paper 964, 28 p.
Arnold, C.L, and Gibbons, C.J., 1996, Impervious surface coverage: the emergence of a key environmental indicator: Journal of the American Planning Association, v.62(2), p. 243-258.
Bisese, J.A., 1995, Methods for estimating the magnitude and frequency of peak discharges of rural, unregulated streams in Virginia: U.S. Geological Survey Water-Resources Investigations Report 944148, 70 p.
Capiella, K., 2001, Land use/impervious cover relationships in the Chesapeake Bay: Watershed Protection Techniques, v. 3(4), p. 835-840.
Capiella, K. and Brown, K., 2001, Impervious cover and land use in the Chesapeake Bay watershed: Ellicott City, MD, Center for Watershed Protection, 61 p.
Carter, W.R., 1961, Magnitude and frequency of floods in suburban areas: U.S. Geological Survey Professional Paper 424-B, p. 9-11.
Conger, D.H., 1986, Estimating magnitude and frequency of floods for Wisconsin urban streams: U.S. Geological Survey Water-Resources Investigations Report 86-4005, 18 p.
Dillow, J.J.A., 1996, Technique for estimating magnitude and frequency of peak flows in Maryland: U.S. Geological Survey Water-Resources Investigations Report 95-4154, 55 p.
Flynn, K.M., Kirby, W.H. and Hummel, P.R., 2005, Users manual for program PeakFQ, annual flood frequency analysis using Bulletin 17B guidelines: U.S. Geological Survey Water Resources Applications Software; accessed in October 2005 at http://water.usgs.gov/software/peakfq.html.
GeoLytics, Inc., 2003, Neighborhood Change Database (NCDB), 1970-2000 tract data, East Brunswick, NJ, GeoLytics, Inc.; accessed in November 2005 at http://www.geolytics.com/USCensus,Neighborhood-Change-Database-1970-2000,Products.asp.
Homer, C., Huang, C., Yang, L., Wylie, B., and Coan, M., 2004, Development of a 2001 national land-cover database for the United States: Photogrammetric Engineering and Remote Sensing, v. 70, no. 7 [July 2004], p. 829-840.
Interagency Advisory Committee on Water Data, 1982, Guidelines for determining flood flow frequency, Bulletin 17B of the Hydrology Committee: Reston, VA, U.S. Department of the Interior Geological Survey, Office of Water Data Coordination.
James, L.D., 1965, Using a digital computer to estimate the effects of urban development on flood peaks: Water Resources Research, v. 1(2), p. 223-234.
Jennings, M.E., Thomas, W.O., Jr., and Riggs, H.C., 1994, Nationwide summary of U.S. Geological Survey regional regression equations for estimating magnitude and frequency of floods for ungaged sites, 1993: U.S. Geological Survey Water-Resources Investigations Report 94-4002, 196 p.
Jenson, S.K. and Domingue, J.O., 1988, Extracting topographic structure from digital elevation data for geographic information system analysis: Photogrammetric Engineering and Remote Sensing, v. 54, no. 11 [November 1988], p. 1593-1600.
Leopold, L.B., 1968, Hydrology for urban land planning: A guidebook on the hydrologic effects of land use: U.S. Geological Survey Circular 554, 18 p.
McCuen, R.H., 1993, Microcomputer applications in statistical hydrology: Prentice-Hall, Englewood Cliffs, NJ, 306 p.
Multi-Resolution Land Characteristics Consortium, 2005, National Land Cover Database, 2001 (NLCD 2001): accessed in January 2006 at http://www.mrlc.gov/mrlc2k_nlcd.asp.
Ries, K.G., III, and Crouse, M.Y., comps. 2002, The National Flood-Frequency Program, Version 3: A computer program for estimating magnitude and frequency of floods for ungaged sites, 2002: U.S. Geological Survey Water-Resources Investigations Report 02-4168, 42 p.
Sauer, V.B., 1973, Flood characteristics of Oklahoma streams; techniques for calculating magnitude and frequency of floods in Oklahoma with compilations of flood data through 1971: U.S. Geological Survey Water-Resources Investigations, 52-73, 301 p.
Sauer, V.B., Thomas, W.O., Jr., Stricker, V.A., and Wilson, K.V., 1983, Flood characteristics of urban watersheds in the United States: U.S. Geological Survey Water-Supply Paper 2207, 63 p.
Schueler, T.R., 1987, The importance of imperviousness [1(3)], in Schueler, T.R., and Holland, H.K., eds., 2000, The practice of watershed protection [150-article anthology]: Ellicott City, MD, Center for Watershed Protection, p. 100-111.
Stankowski, S.J., 1972, Population density as an indirect indicator of urban and suburban land-surface modifications: U.S. Geological Survey Professional Paper 800-B, p. 219-224.
Stankowski, S.J., 1974, Magnitude and frequency of floods in New Jersey with effects of urbanization: New Jersey Department of Environmental Protection, Division of Water Resources, Special Report 38, 46 p.
Stuckey, M.H., and Reed, L.A., 2000, Techniques for estimating magnitude and frequency of peak flows for Pennsylvania streams: U.S. Geological Survey Water-Resources Investigations Report 00-4189, 43 p.
U.S. Environmental Protection Agency, 2001, Multi-Resolution Land Characteristics; accessed in August 2005 at http://www.epa.gov/mrlc.
U.S. Geological Survey, 2004a, National Elevation Dataset; accessed in July 2004 at http://ned.usgs.gov/.
U.S. Geological Survey, 2004b, USGS water data for the Nation; accessed in September 2004 at http://waterdata.usgs.gov/nwis/.
U.S. Geological Survey, 2005, National Land Cover Dataset 1992 (NLCD 1992); accessed in December 2005 at http://landcover.usgs.gov/natllandcover.php.
U.S. Geological Survey and U.S. Environmental Protection Agency, 2004, National hydrography dataset; accessed in July 2004 at http://nhd.usgs.gov/.
Viessman, W., Jr., 1966, The hydrology of small impervious areas: Water Resources Research. v. 2(3), p. 405-412.
Vogelmann, J.E., Sohl, T., and Howard, S.M., 1998a, Regional characterization of land cover using multiple sources of data: Photogrammetric Engineering and Remote Sensing, v. 64, p. 45-57.
Vogelmann, J.E., Sohl, T., Howard, S.M., and Shaw, D.M., 1998b, Regional land cover characterization using Landsat thematic mapper data and ancillary data sources: Environmental Monitoring and Assessment, v. 51, p. 415-428.
Walker, J.F., and Krug, W.R., 2003, Flood-frequency characteristics of Wisconsin streams: U.S. Geological Survey Water-Resources Investigations Report 03-4250, accessed in September 2004 at https://pubs.usgs.gov/wri/wri034250/.
Appendix 1. Watershed characteristics of streamgages with only rural indicators.
Appendix 2. Actual and estimated rural discharge for streamgages with only rural indicators.
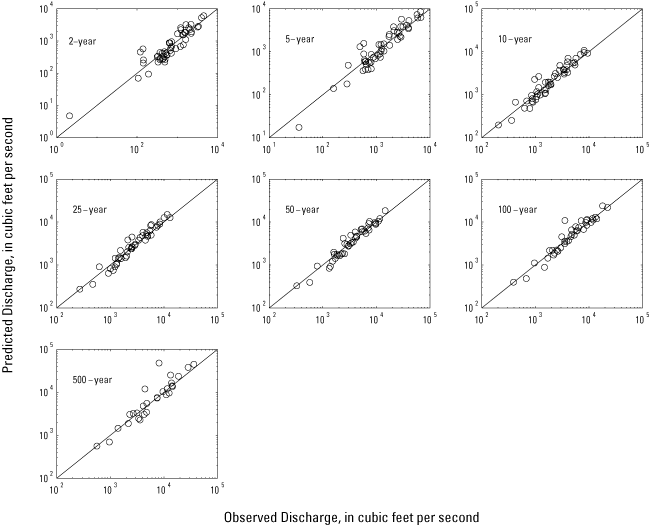
Appendix 4. Calibrated (x) and smoothed (o) coefficient and exponents for the discharge adjustment models and return period.
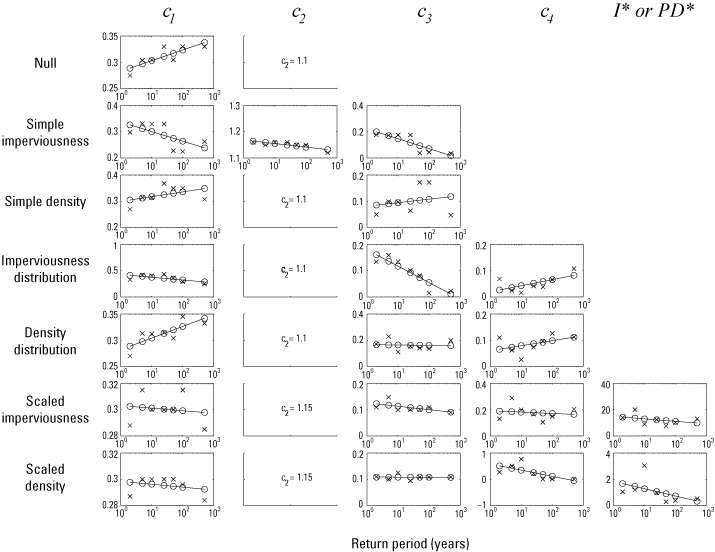
Appendix 5. Watershed characteristics for 10 U.S. Geological Survey streamgages with localized urban equations.
[mi2, square miles; ft/mi, feet per mile; %, percent]
| Streamgage number | Streamgage name | State | Area (mi2) | Slope (ft/mi) | Storage (%) | Impervious area (%) | Forest cover (%) | Urban area (%) | Carbonate area (%) | Controlled area (%) |
|---|---|---|---|---|---|---|---|---|---|---|
| 01393450 | ELIZABETH R AT URSINO LAKE AT ELIZABETH NJ | NJ | 17.6 | 22.4 | 1.6 | 41.9 | ||||
| 01394500 | RAHWAY R NR SPRINGFIELD NJ | NJ | 25.3 | 30.6 | 1.3 | 22.2 | ||||
| 01407705 | SHARK R NR NEPTUNE CITY NJ | NJ | 9.8 | 29.4 | 17.6 | 9.0 | ||||
| 01407760 | JUMPING ROOK NR NEPTUNE CITY NJ | NJ | 6.3 | 35.2 | 8.4 | 10.1 | ||||
| 01465798 | POQUESSING C AT GRANT AVE AT PHILADELPHIA PA | PA | 21.1 | 16.6 | 66.5 | 1.1 | 14.9 | |||
| 01467048 | PENNYPACK C AT LOWER RAHN ST BDG, PHILA PA | PA | 50.0 | 29.2 | 59.4 | 1.5 | 6.1 | |||
| 01467087 | FRANKFORD C AT CASTOR AVE, PHILADELPHIA PA | PA | 29.8 | 17.4 | 77.2 | 0.0 | 0.0 | |||
| 03049800 | LITTLE PINE C NR ETNA PA | PA | 5.7 | 79.8 | 8.2 | 0.0 | 0.0 | |||
| 04087204 | OAK C AT S MILWAUKEE WI | WI | 25.4 | 16.8 | ||||||
| 04087220 | ROOT R NR FRANKLIN WI | WI | 49.8 | 19.6 | ||||||
Appendix 6. Rural and urban discharges, in cubic feet per second for 10 U.S. Geological Survey streamgages with localized urban uquations.
[Entries in italics were not available directly from the regression equations and were determined from log-normal extrapolation.]
| Streamgage number | Streamgage name | State | Return Period (years) | ||||||
|---|---|---|---|---|---|---|---|---|---|
| 2 | 5 | 10 | 25 | 50 | 100 | 500 | |||
| Urban Discharges | |||||||||
| 01393450 | ELIZABETH R AT URSINO LAKE AT ELIZABETH NJ | NJ | 1,071 | 1,516 | 1,992 | 2,552 | 2,993 | 3,528 | 4,922 |
| 01394500 | RAHWAY R NR SPRINGFIELD NJ | NJ | 1,452 | 2,088 | 2,784 | 3,580 | 4,219 | 5,016 | 7,120 |
| 01407705 | SHARK R NR NEPTUNE CITY NJ | NJ | 157 | 244 | 338 | 460 | 568 | 694 | 1,039 |
| 01407760 | JUMPING BROOK NR NEPTUNE CITY NJ | NJ | 166 | 254 | 350 | 476 | 584 | 715 | 1,075 |
| 01465798 | POQUESSING C AT GRANT AVE AT PHILADELPHIA PA | PA | 2,739 | 3,984 | 4,845 | 5,970 | 7,009 | 8,140 | 11,180 |
| 01467048 | PENNYPACK C AT LOWER RHAWN ST BDG, PHILADELPHIA PA | PA | 5,019 | 7,095 | 8,503 | 10,312 | 11,971 | 13,742 | 18,381 |
| 01467087 | FRANKFORD C AT CASTOR AVE, PHILADELPHIA PA | PA | 4,520 | 6,213 | 7,337 | 8,761 | 10,060 | 11,433 | 14,968 |
| 03049800 | LITTLE PINE C NR ETNA PA | PA | 347 | 611 | 821 | 1,124 | 1,415 | 1,752 | 2,742 |
| 04087204 | OAK C AT S MILWAUKEE WI | WI | 941 | 1,301 | 1,585 | 1,912 | 2,207 | 2,440 | 2,991 |
| 04087220 | ROOT R NR FRANKLIN WI | WI | 1,847 | 2,518 | 3,062 | 3,691 | 4,266 | 4,716 | 5,777 |
| Rural Discharges | |||||||||
| 01393450 | ELIZABETH R AT URSINO LAKE AT ELIZABETH NJ | NJ | 550 | 863 | 1,217 | 1,672 | 2,104 | 2,674 | 4,343 |
| 01394500 | RAHWAY R NR SPRINGFIELD NJ | NJ | 903 | 1,411 | 1,993 | 2,713 | 3,386 | 4,287 | 6,912 |
| 01407705 | SHARK R NR NEPTUNE CITY NJ | NJ | 91 | 152 | 220 | 313 | 405 | 517 | 850 |
| 01407760 | JUMPING BROOK NR NEPTUNE CITY NJ | NJ | 97 | 159 | 229 | 327 | 421 | 450 | 896 |
| 01465798 | POQUESSING C AT GRANT AVE AT PHILADELPHIA PA | PA | 1,132 | 2,089 | 2,879 | 4,051 | 5,220 | 6,626 | 11,062 |
| 01467048 | PENNYPACK C AT LOWER RHAWN ST BDG, PHILADELPHIA PA | PA | 2,237 | 3,932 | 5,281 | 7,233 | 9,142 | 11,383 | 18,204 |
| 01467087 | FRANKFORD C AT CASTOR AVE, PHILADELPHIA PA | PA | 1,676 | 3,012 | 4,090 | 5,670 | 7,227 | 9,075 | 14,791 |
| 03049800 | LITTLE PINE C NR ETNA PA | PA | 303 | 553 | 757 | 1,059 | 1,415 | 1,752 | 2,737 |
| 04087204 | OAK C AT S MILWAUKEE WI | WI | 454 | 651 | 792 | 966 | 1,095 | 1,219 | 1,514 |
| 04087220 | ROOT R NR FRANKLIN WI | WI | 796 | 1,127 | 1,360 | 1,645 | 1,859 | 2,062 | 2,544 |
This report is available online in Portable Document Format (PDF). If you do not have the Adobe Acrobat PDF Reader, it is available for free download from Adobe Systems Incorporated.
Download the report (PDF, 5.3M)
Document Accessibility: Adobe Systems Incorporated has information about PDFs and the visually impaired. This information provides tools to help make PDF files accessible. These tools convert Adobe PDF documents into HTML or ASCII text, which then can be read by a number of common screen-reading programs that synthesize text as audible speech. In addition, an accessible version of Acrobat Reader 5.0 for Windows (English only), which contains support for screen readers, is available. These tools and the accessible reader may be obtained free from Adobe at Adobe Access.
Contact Information: GS-W_OSW_Webmaster@usgs.gov

![]() U.S. Department of the Interior | U.S. Geological Survey
U.S. Department of the Interior | U.S. Geological Survey
Persistent URL: https://pubs.water.usgs.gov/sir2006-5270
Page Contact Information: USGS Publishing Network
Page Last Modified: Thursday, 01-Dec-2016 19:37:01 EST