Scientific Investigations Report 2006–5316
U.S. GEOLOGICAL SURVEY
Scientific Investigations Report 2006–5316
DOE/ID-22201
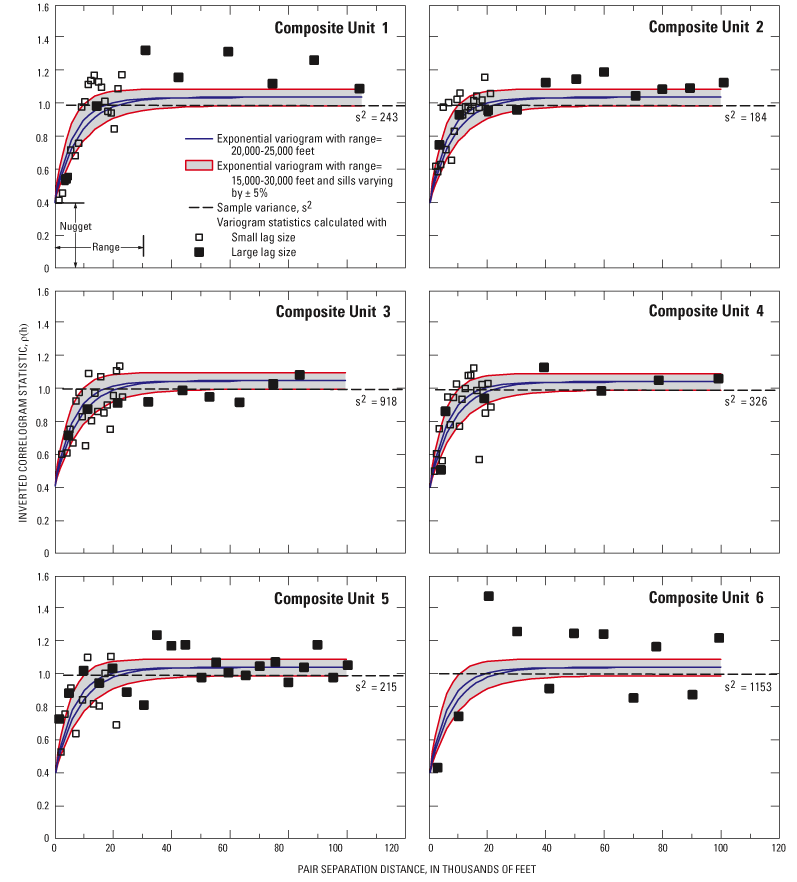
Figure 13. Relative variograms of sediment thickness within composite units 1 through 6, based on the inverted correlogram statistic. Variograms are plotted at two lag sizes to elucidate the variogram range and nugget. All fitted models have a relative nugget of 40 percent of the sample variance.

![]() U.S.
Department of the Interior | U.S. Geological
Survey
U.S.
Department of the Interior | U.S. Geological
Survey
Persistent URL: https://pubs.water.usgs.gov/sir20065316
Page Contact Information: Publications Team
Page Last Modified: Thursday, 01-Dec-2016 19:33:00 EST
