Scientific Investigations Report 2006–5316
U.S. GEOLOGICAL SURVEY
Scientific Investigations Report 2006–5316
DOE/ID-22201
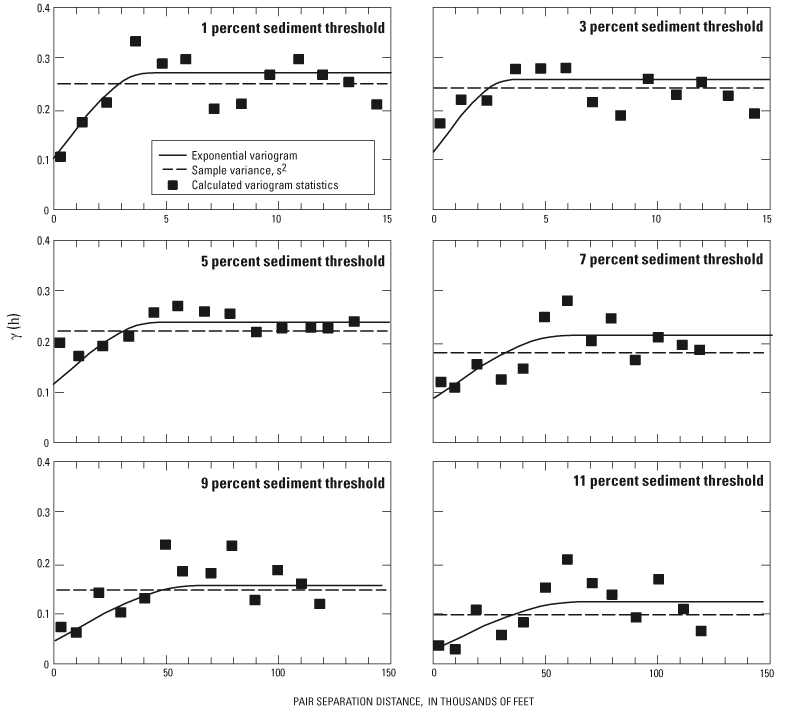
Figure 15. Examples of multiple indicator semivariograms at selected thresholds for layer A, showing the nature of the autocorrelation structure and the progressive change in nuggets, sills, and ranges as thresholds increase. Note that the horizontal axes for the 1- and 3-percent thresholds are 10 times smaller than for larger thresholds.

![]() U.S.
Department of the Interior | U.S. Geological
Survey
U.S.
Department of the Interior | U.S. Geological
Survey
Persistent URL: https://pubs.water.usgs.gov/sir20065316
Page Contact Information: Publications Team
Page Last Modified: Thursday, 01-Dec-2016 19:33:01 EST
