Scientific Investigations Report 2006–5316
U.S. GEOLOGICAL SURVEY
Scientific Investigations Report 2006–5316
DOE/ID-22201
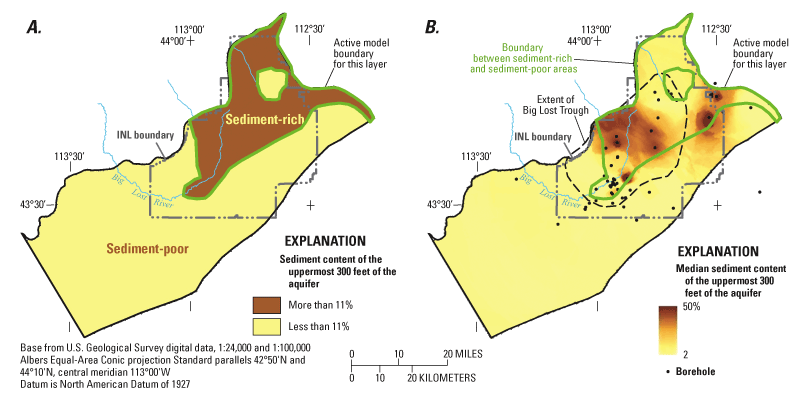
Figure 19. Distribution of sediment-rich and sediment-poor areas in the model domain. (A) as currently implemented in the U.S. Geological Survey subregional ground-water flow model, based on an 11-percent sediment threshold, regardless of depth; and (B) median sediment content of the uppermost 300 feet of the aquifer, as determined by multiple-indicator kriging. The extent of the Big Lost Trough (dashed polygon) and the boundary between sediment-rich and sediment-poor areas in (A) are shown for comparison.

![]() U.S.
Department of the Interior | U.S. Geological
Survey
U.S.
Department of the Interior | U.S. Geological
Survey
Persistent URL: https://pubs.water.usgs.gov/sir20065316
Page Contact Information: Publications Team
Page Last Modified: Thursday, 01-Dec-2016 19:33:05 EST
