|
Appendixes
Appendix 6. Hydrologic conditions during
Phase II of the Milwaukee Metropolitan Sewerage District (MMSD) Corridor Study.
Appendix 6A. Water-discharge hydrographs for
water years 2004–2005 at the 12 Phase II stream sites with gages in the Milwaukee
Metropolitan Sewerage District (MMSD) planning area. Period of record annual
mean does not include data from the 2004 and 2005 water years.
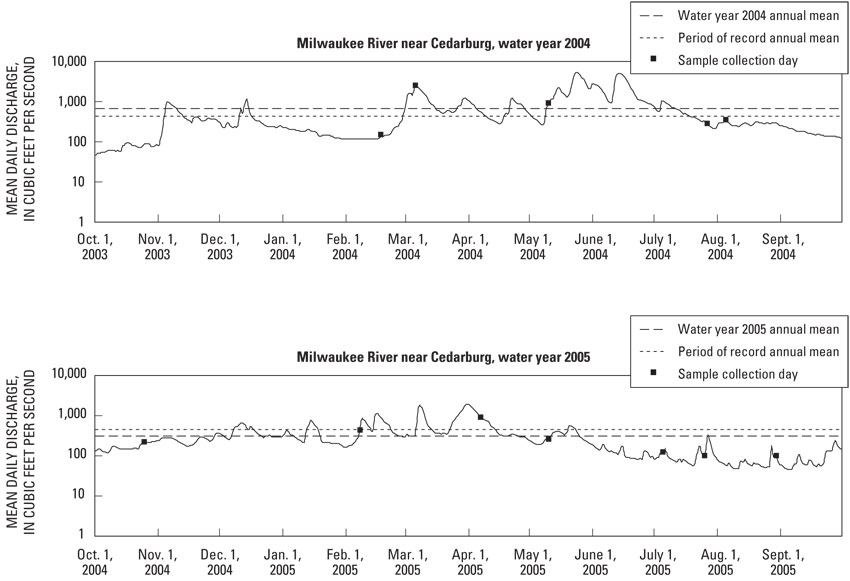
Figure 6-1. Milwaukee River near Cedarburg.
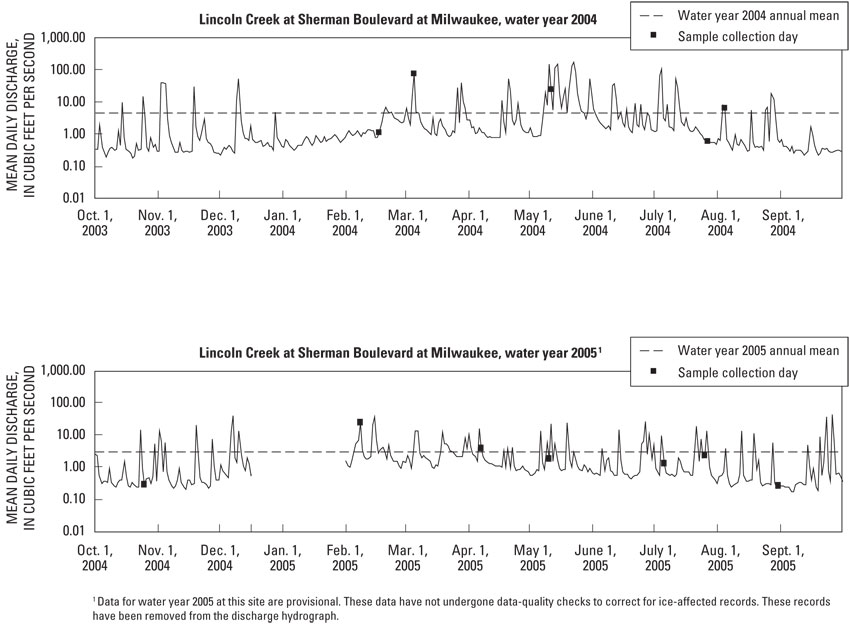
Figure 6-2. Lincoln Creek at 47th Street at Milwaukee. A
period of record annual mean is not provided for this site because it has less
than 20 years of hydrologic data.
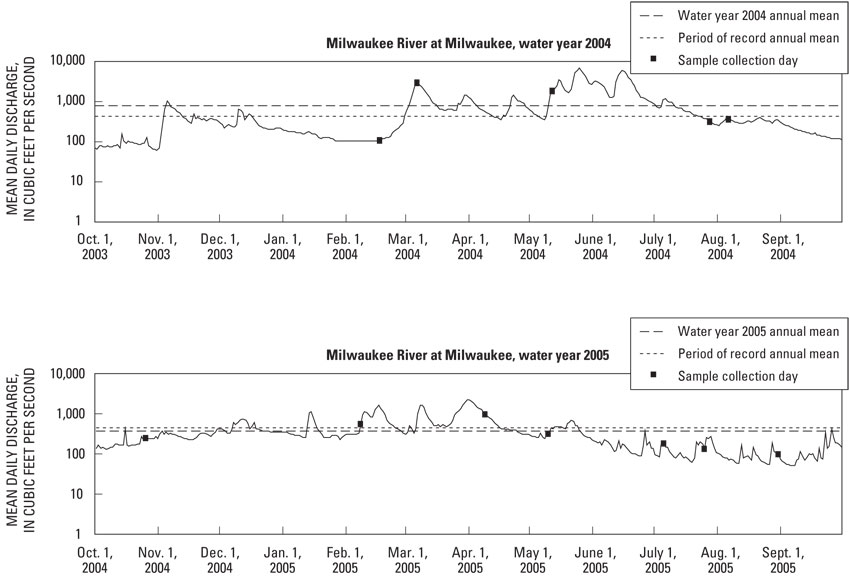
Figure 6-3. Milwaukee River at Milwaukee.
return to top
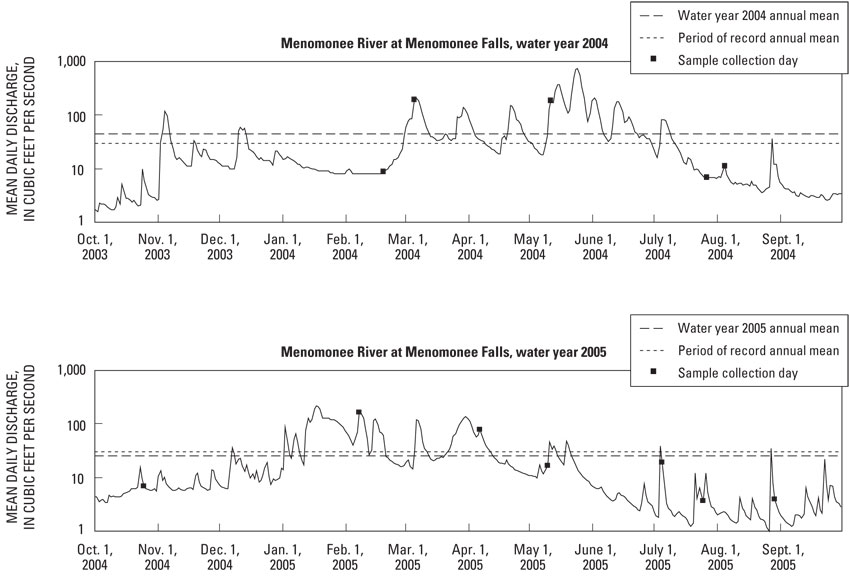
Figure 6-4. Menomonee River at Menomonee Falls.
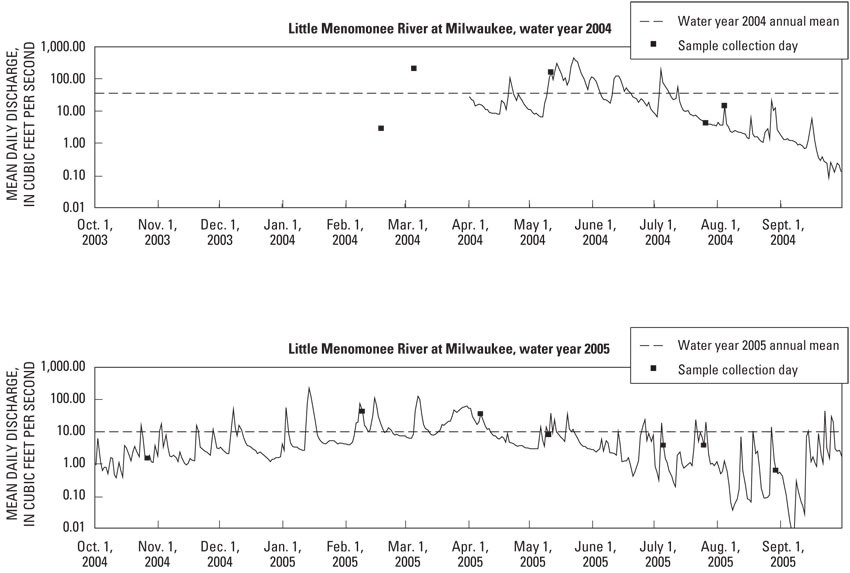
Figure 6-5. Little Menomonee River at Milwaukee.
Prior to the addition of a gage at this site in April of 2004, current-meter
discharge measurements were made during water-quality sampling. A period of record
annual mean is not provided for this site because it has less than 20 years of
hydrologic data.
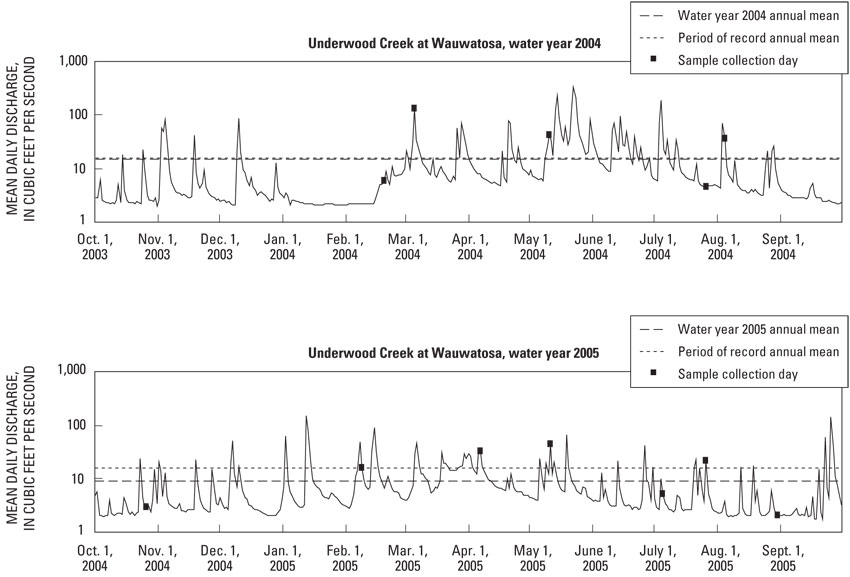
Figure 6-6. Underwood Creek at Wauwatosa.
return to top
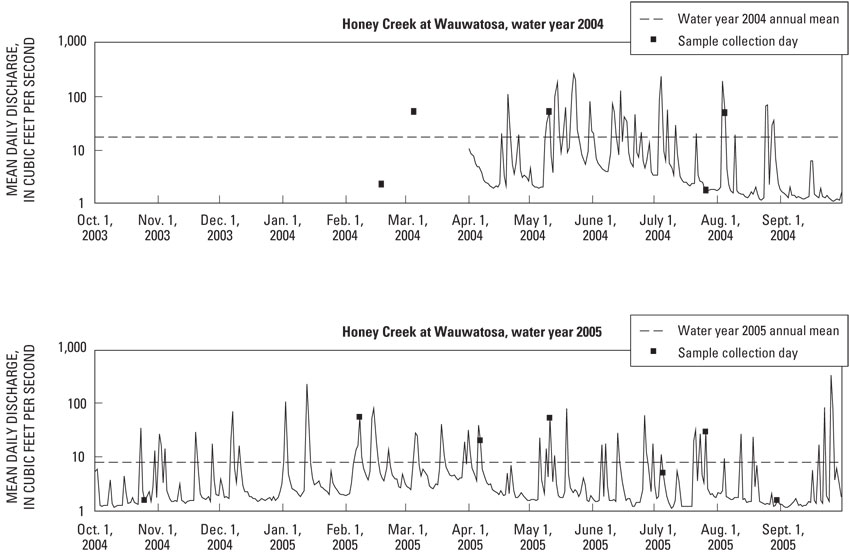
Figure 6-7. Honey Creek at Wauwatosa. Prior
to the addition of a gage at this site in April of 2004, current-meter discharge
measurements were made during water-quality sampling. A period of record annual
mean is not provided for this site because it has less than 20 years of hydrologic
data.
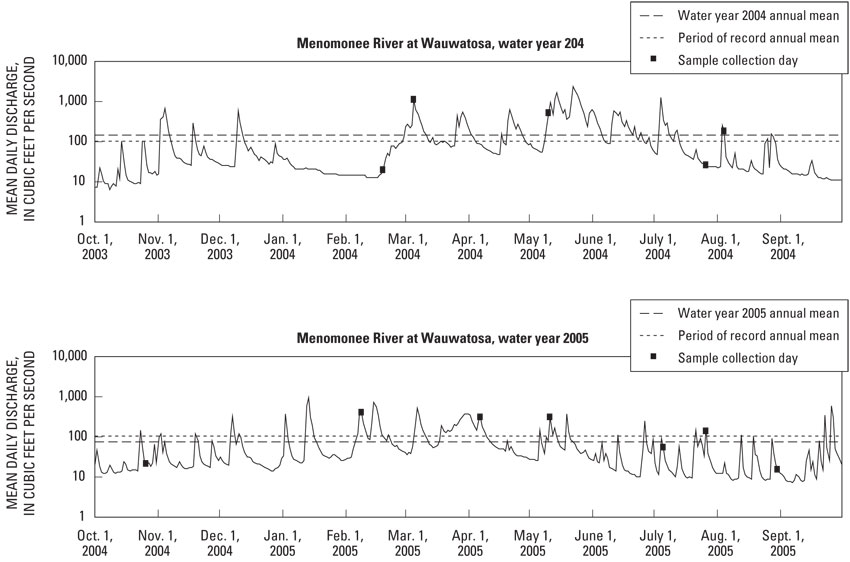
Figure 6-8. Menomonee River at Wauwatosa.
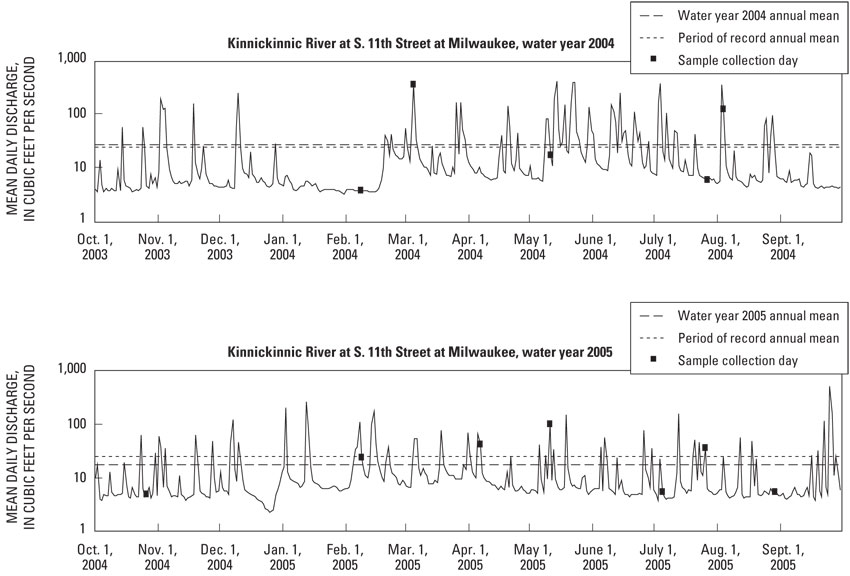
Figure 6-9. Kinnickinnic River at S. 11th
Street at Milwaukee.
return to top
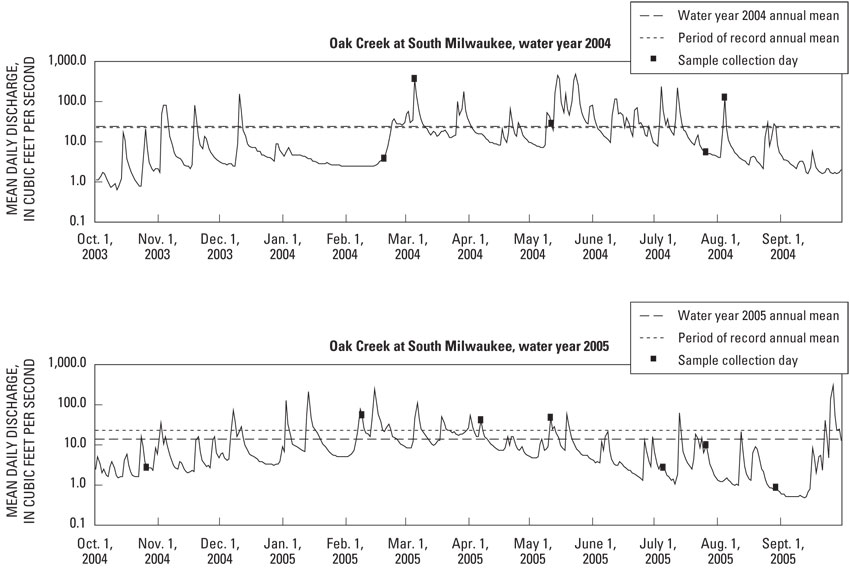
Figure 6-10. Oak Creek at South Milwaukee.
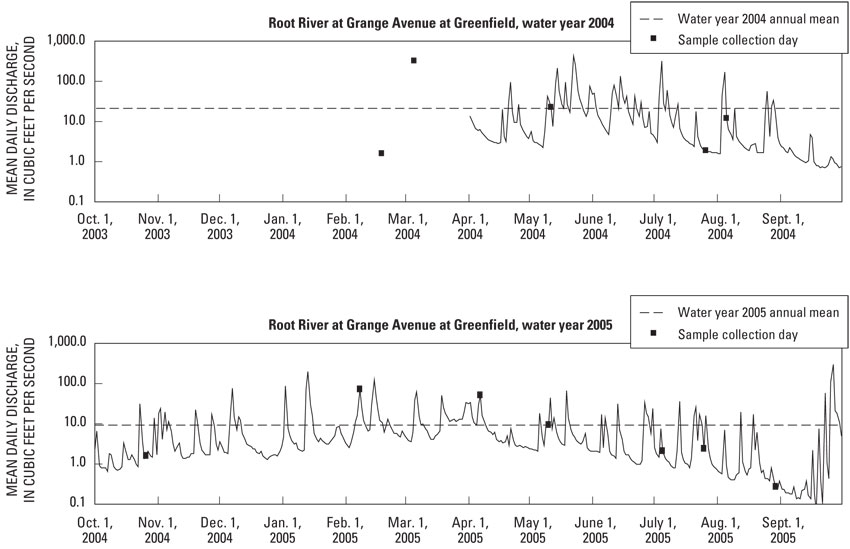
Figure 6-11. Root River at Grange Avenue at
Greenfield. Prior to the addition of a gage at this site in April of 2004, current-meter
discharge measurements were made during water-quality sampling. A period of record
annual mean is not provided for this site because it has less than 20 years of
hydrologic data.
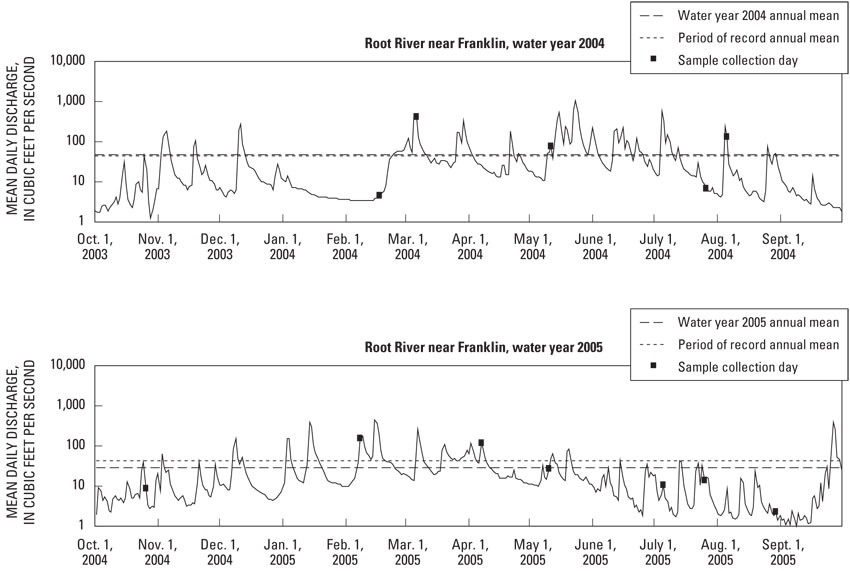
Figure 6-12. Root River near Franklin.
return to top
Appendix 6B. Monthly runoff spanning more
than 20 years for the eight Phase II stream sites with records in the Milwaukee
Metropolitan Sewerage District (MMSD) planning area, Wis. Long-term means for
runoff do not include data from the 2004 and 2005 water years.
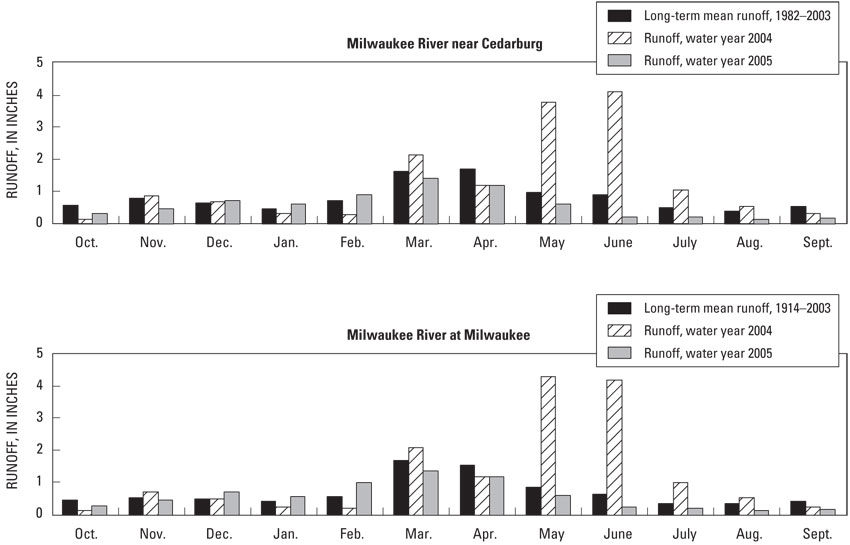
Figure 6-13. Monthly runoff, in inches, for
water years 2004 and 2005 and for the period of record.
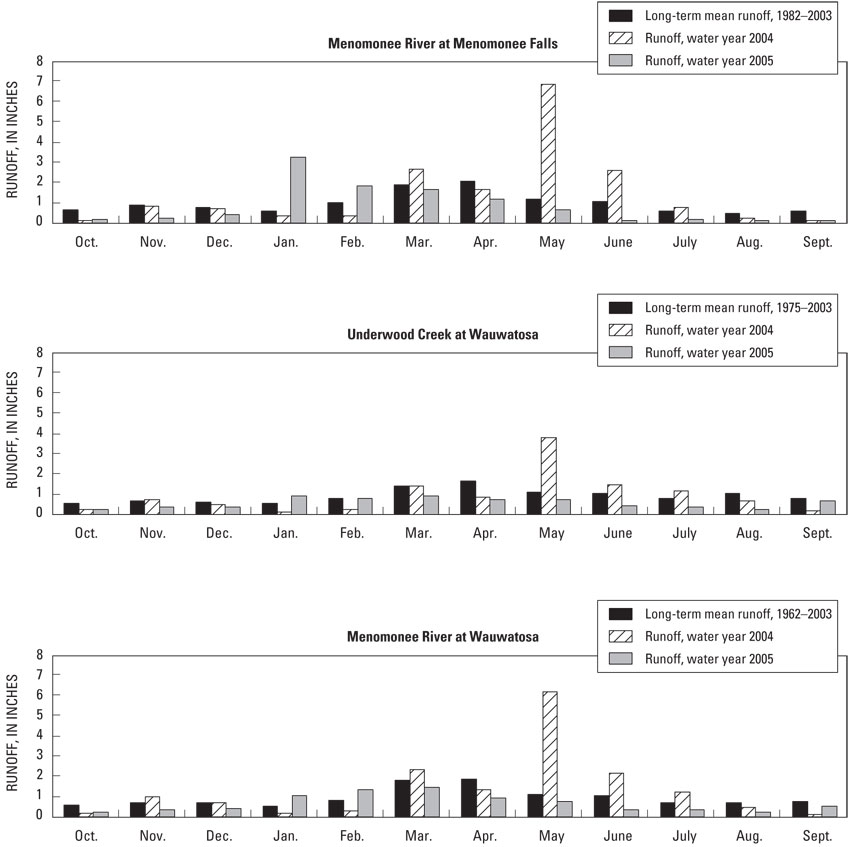
Figure 6-13. Monthly runoff, in inches, for
water years 2004 and 2005 and for the period of record—Continued.
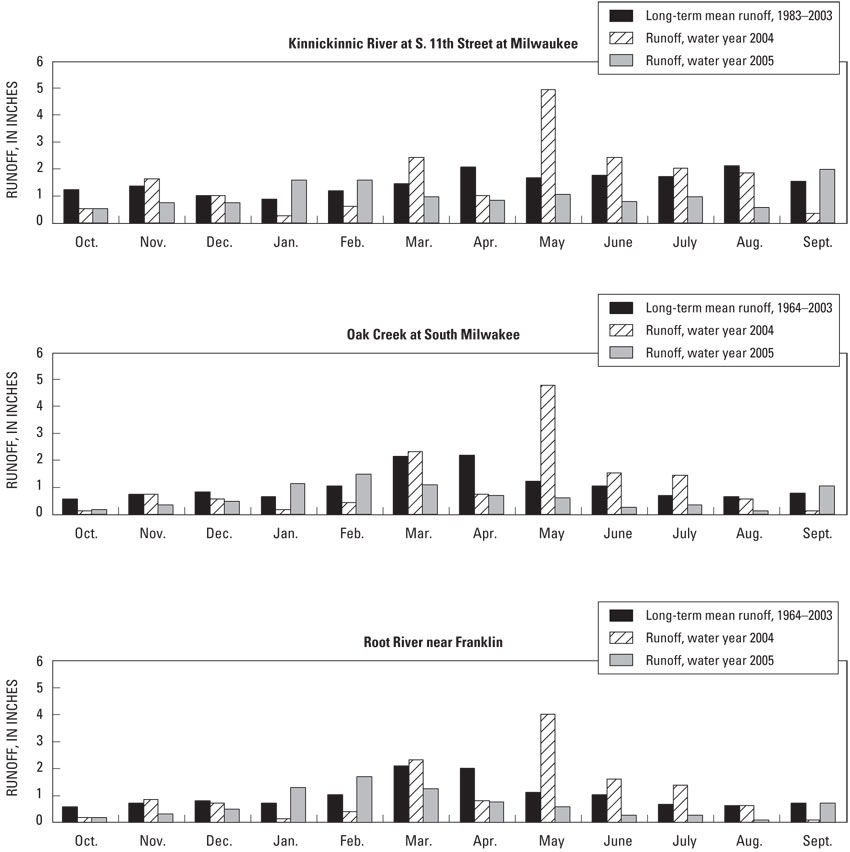
Figure 6-13. Monthly runoff, in inches, for
water years 2004 and 2005 and for the period of record—Continued
return to top
Appendix 6C. Monthly discharge and runoff
statistics for eight Phase II stream sites in the Milwaukee Metropolitan Sewerage
District (MMSD) planning area, for the period of record and water years 2004
and 2005. Long-term means for discharge and runoff do not include data from the
2004 and 2005 water years.
[WY, water year; mi2,
square mile]
|
Month
|
Discharge (cubic feet per second)
|
Runoff (inches)
|
Percent difference of discharge
and runoff from long-term mean
|
|
Long-term mean
|
WY 2004 mean
|
WY 2005 mean
|
Long-term mean
|
WY 2004 mean
|
WY 2005 mean
|
WY 2004
|
WY 2005
|
|
Milwaukee River near Cedarburg (drainage
area, 607 mi2; period of record, 1982–2003)
|
| Oct. |
296
|
73.7
|
168
|
0.56
|
0.14
|
0.32
|
-75
|
-43
|
| Nov. |
430
|
467
|
254
|
.79
|
.86
|
.47
|
9
|
-41
|
| Dec. |
350
|
370
|
390
|
.66
|
.70
|
.74
|
6
|
11
|
| Jan. |
249
|
173
|
323
|
.47
|
.33
|
.61
|
-31
|
30
|
| Feb. |
428
|
170
|
521
|
.73
|
.30
|
.89
|
-60
|
22
|
| March |
867
|
1,129
|
739
|
1.65
|
2.14
|
1.40
|
30
|
-15
|
| April |
926
|
645
|
647
|
1.7
|
1.19
|
1.19
|
-30
|
-30
|
| May |
513
|
1,986
|
319
|
.97
|
3.77
|
.61
|
287
|
-38
|
| June |
488
|
2,229
|
122
|
.90
|
4.10
|
.22
|
357
|
-75
|
| July |
259
|
548
|
108
|
.49
|
1.04
|
.20
|
112
|
-58
|
| Aug. |
213
|
290
|
68.4
|
.40
|
.55
|
.13
|
36
|
-68
|
| Sept. |
289
|
176
|
92.5
|
.53
|
.32
|
.17
|
-39
|
-68
|
Annual mean discharge
and annual runoff |
442
|
689
|
311
|
9.89
|
15.45
|
6.96
|
|
Percent difference
from long-term annual mean |
|
|
56
|
-30
|
|
Milwaukee River at Milwaukee (drainage
area, 696 mi2; period of record, 1914–2003)
|
| Oct. |
279
|
87.2
|
184
|
0.46
|
0.14
|
0.30
|
-69
|
-34
|
| Nov. |
348
|
454
|
286
|
.56
|
.73
|
.46
|
30
|
-18
|
| Dec. |
298
|
311
|
435
|
.49
|
.52
|
.72
|
4
|
46
|
| Jan. |
253
|
149
|
359
|
.42
|
.25
|
.59
|
-41
|
42
|
| Feb. |
393
|
150
|
689
|
.59
|
.23
|
1.03
|
-62
|
75
|
| March |
1,030
|
1,273
|
829
|
1.71
|
2.11
|
1.37
|
24
|
-20
|
| April |
969
|
757
|
753
|
1.55
|
1.21
|
1.21
|
-22
|
-22
|
| May |
518
|
2,597
|
368
|
.86
|
4.30
|
.61
|
401
|
-29
|
| June |
412
|
2,629
|
154
|
.66
|
4.22
|
.25
|
538
|
-63
|
| July |
229
|
618
|
126
|
.38
|
1.02
|
.21
|
170
|
-45
|
| Aug. |
210
|
341
|
83
|
.35
|
.56
|
.14
|
62
|
-60
|
| Sept. |
267
|
170
|
116
|
.43
|
.27
|
.19
|
-36
|
-57
|
Annual mean discharge
and annual runoff |
433
|
796
|
363
|
8.45
|
15.57
|
7.08
|
|
Percent difference
from long-term annual mean |
|
|
84
|
-16
|
|
Menomonee River at Menomonee Falls (drainage
area, 34.7 mi2; period of record, 1975–2003)
|
| Oct. |
19.5
|
2.87
|
5.55
|
0.65
|
0.10
|
0.18
|
-85
|
-72
|
| Nov. |
26.8
|
26.5
|
7.98
|
.86
|
.85
|
.26
|
-1
|
-70
|
| Dec. |
22.6
|
21.1
|
13.3
|
.75
|
.70
|
.44
|
-7
|
-41
|
| Jan. |
17.6
|
10.7
|
98.1
|
.58
|
.35
|
3.26
|
-39
|
457
|
| Feb. |
33.4
|
11.3
|
61.0
|
1.00
|
.35
|
1.83
|
-66
|
83
|
| March |
56.6
|
80.0
|
50.3
|
1.88
|
2.66
|
1.67
|
41
|
-11
|
| April |
63.8
|
50.7
|
37.1
|
2.05
|
1.63
|
1.19
|
-21
|
-42
|
| May |
34.9
|
207
|
19.8
|
1.16
|
6.88
|
.66
|
493
|
-43
|
| June |
32.8
|
80.1
|
4.46
|
1.05
|
2.58
|
.14
|
144
|
-86
|
| July |
18.7
|
23.7
|
5.15
|
.62
|
.79
|
.17
|
27
|
-72
|
| Aug. |
14.2
|
7.01
|
3.4
|
.47
|
.23
|
.11
|
-51
|
-76
|
| Sept. |
18.6
|
3.34
|
3.75
|
.60
|
.11
|
.12
|
-82
|
-80
|
Annual mean discharge
and annual runoff |
29.8
|
43.9
|
14.8
|
11.65
|
17.22
|
5.79
|
|
Percent difference
from long-term annual mean |
|
|
47
|
-14
|
|
Underwood Creek at Wauwatosa (drainage area, 18.2 mi2; period of record,
1975–2003)
|
| Oct. |
8.99
|
4.04
|
3.94
|
0.57
|
0.26
|
0.25
|
-55
|
-56
|
| Nov. |
10.9
|
12.1
|
5.64
|
.67
|
.74
|
.35
|
11
|
-48
|
| Dec. |
10.1
|
7.79
|
6.15
|
.64
|
.49
|
.39
|
-23
|
-39
|
| Jan. |
8.62
|
2.29
|
14.6
|
.55
|
.15
|
.93
|
-73
|
69
|
| Feb. |
13.9
|
4.54
|
14.0
|
.80
|
.27
|
.80
|
-67
|
1
|
| March |
22.4
|
21.7
|
14.6
|
1.42
|
1.38
|
.92
|
-3
|
-35
|
| April |
27.1
|
14.1
|
11.6
|
1.66
|
.86
|
.71
|
-48
|
-57
|
| May |
17.8
|
59.4
|
11.6
|
1.13
|
3.76
|
.74
|
234
|
-35
|
| June |
17.3
|
23.8
|
6.66
|
1.06
|
1.46
|
.41
|
38
|
-62
|
| July |
13.0
|
18.0
|
5.66
|
.82
|
1.14
|
.36
|
38
|
-56
|
| Aug. |
16.3
|
10.3
|
3.53
|
1.03
|
.65
|
.22
|
-37
|
-78
|
| Sept. |
12.9
|
2.94
|
11.4
|
.79
|
.18
|
.70
|
-77
|
-12
|
Annual mean discharge
and annual runoff |
15.0
|
15.1
|
9.08
|
11.17
|
11.33
|
6.77
|
|
Percent difference
from long-term annual mean |
|
|
1
|
-39
|
|
Menomonee River at Wauwatosa (drainage area, 123 mi2; period
of record, 1962–2003)
|
| Oct. |
64.4
|
21.4
|
24.3
|
0.60
|
0.20
|
0.23
|
-67
|
-62
|
| Nov. |
77.6
|
113
|
37.6
|
.70
|
1.02
|
.34
|
46
|
-52
|
| Dec. |
74.6
|
75.2
|
46.1
|
.70
|
.70
|
.43
|
1
|
-38
|
| Jan. |
57.5
|
20.5
|
110
|
.54
|
.19
|
1.03
|
-64
|
91
|
| Feb. |
98.6
|
35.4
|
160
|
.83
|
.31
|
1.36
|
-64
|
62
|
| March |
196
|
253
|
160
|
1.84
|
2.37
|
1.50
|
29
|
-18
|
| April |
205
|
149
|
107
|
1.86
|
1.35
|
.97
|
-27
|
-48
|
| May |
119
|
665
|
80.9
|
1.12
|
6.24
|
.76
|
459
|
-32
|
| June |
114
|
240
|
37.7
|
1.03
|
2.18
|
.34
|
111
|
-67
|
| July |
77.4
|
129
|
36.7
|
.73
|
1.21
|
.34
|
67
|
-53
|
| Aug. |
76.8
|
52.5
|
22.3
|
.72
|
.49
|
.21
|
-32
|
-71
|
| Sept. |
82.7
|
15.6
|
59.3
|
.75
|
.14
|
.54
|
-81
|
-28
|
Annual mean discharge
and annual runoff |
103
|
148
|
72.9
|
11.43
|
16.41
|
8.05
|
|
Percent difference
from long-term annual mean |
|
|
44
|
-29
|
|
Kinnickinnic River at S. 11th Street
at Milwaukee (drainage area, 18.8 mi2;
period of record, 1983–2003)
|
| Oct. |
19.9
|
8.99
|
8.89
|
1.22
|
0.55
|
0.55
|
-55
|
-55
|
| Nov. |
23.4
|
27.2
|
13.0
|
1.39
|
1.62
|
.77
|
16
|
-44
|
| Dec. |
16.7
|
16.8
|
12.5
|
1.02
|
1.03
|
.77
|
1
|
-25
|
| Jan. |
14.7
|
4.46
|
25.9
|
.90
|
.27
|
1.59
|
-70
|
76
|
| Feb. |
21.3
|
11.0
|
28.7
|
1.18
|
.63
|
1.59
|
-48
|
35
|
| March |
23.9
|
39.7
|
16.0
|
1.47
|
2.44
|
.98
|
66
|
-33
|
| April |
35.1
|
17.2
|
14.2
|
2.08
|
1.02
|
.84
|
-51
|
-60
|
| May |
27.3
|
80.9
|
17.5
|
1.67
|
4.96
|
1.07
|
196
|
-36
|
| June |
30.0
|
41.1
|
13.3
|
1.78
|
2.44
|
.79
|
37
|
-56
|
| July |
28.3
|
32.8
|
16.1
|
1.74
|
2.01
|
.99
|
16
|
-43
|
| Aug. |
34.8
|
30.5
|
9.43
|
2.13
|
1.87
|
.58
|
-12
|
-73
|
| Sept. |
25.8
|
5.92
|
33.3
|
1.53
|
.35
|
1.97
|
-77
|
29
|
Annual mean discharge
and annual runoff |
25.1
|
26.5
|
17.3
|
18.14
|
19.2
|
12.5
|
|
Percent difference
from long-term annual mean |
|
|
6
|
-31
|
|
Oak Creek at South Milwaukee (drainage area, 25 mi2; period of record,
1964–2003)
|
| Oct. |
12
|
3.22
|
3.64
|
0.55
|
0.15
|
0.17
|
-73
|
-70
|
| Nov. |
17.1
|
16.9
|
7.39
|
.76
|
.76
|
.33
|
-1
|
-57
|
| Dec. |
18.3
|
12.6
|
10.8
|
.84
|
.58
|
.50
|
-31
|
-41
|
| Jan. |
14.5
|
3.71
|
24.9
|
.67
|
.17
|
1.15
|
-74
|
72
|
| Feb. |
25.4
|
10.1
|
36.3
|
1.06
|
.44
|
1.51
|
-60
|
43
|
| March |
46.2
|
50.7
|
23.3
|
2.13
|
2.34
|
1.08
|
10
|
-50
|
| April |
48.8
|
17.1
|
15.2
|
2.18
|
.76
|
.68
|
-65
|
-69
|
| May |
26.4
|
103
|
13.5
|
1.22
|
4.77
|
.62
|
290
|
-49
|
| June |
23.9
|
34.0
|
5.55
|
1.07
|
1.52
|
.25
|
42
|
-77
|
| July |
15.5
|
31.0
|
7.34
|
.71
|
1.43
|
.34
|
100
|
-53
|
| Aug. |
14.3
|
12.4
|
2.95
|
.66
|
.57
|
.14
|
-13
|
-79
|
| Sept. |
17.6
|
2.53
|
23.0
|
.79
|
.11
|
1.03
|
-86
|
31
|
Annual mean discharge
and annual runoff |
23.3
|
25.0
|
14.3
|
12.65
|
13.59
|
7.78
|
|
Percent difference
from long-term annual mean |
|
|
7
|
-39
|
|
Root River near Franklin (drainage area, 49.2 mi2; period of record,
1964–2003)
|
| Oct. |
23.8
|
6.80
|
7.71
|
0.56
|
0.16
|
0.18
|
-71
|
-68
|
| Nov. |
30.4
|
36.8
|
13.2
|
.69
|
.84
|
.30
|
21
|
-57
|
| Dec. |
34.3
|
30.2
|
20.2
|
.80
|
.71
|
.47
|
-12
|
-41
|
| Jan. |
30.9
|
5.76
|
54.2
|
.72
|
.14
|
1.27
|
-81
|
75
|
| Feb. |
48.1
|
18.0
|
80.3
|
1.02
|
.39
|
1.70
|
-63
|
67
|
| March |
89.6
|
98.3
|
52.7
|
2.10
|
2.30
|
1.24
|
10
|
-41
|
| April |
88.5
|
34.9
|
34.0
|
2.01
|
.79
|
.77
|
-61
|
-62
|
| May |
47.6
|
171
|
24.9
|
1.12
|
4.01
|
.58
|
259
|
-48
|
| June |
45.8
|
71.4
|
12.2
|
1.04
|
1.62
|
.28
|
56
|
-73
|
| July |
27.8
|
58.0
|
11.2
|
.65
|
1.36
|
.26
|
109
|
-60
|
| Aug. |
26.2
|
27.1
|
4.40
|
.61
|
.64
|
.10
|
3
|
-83
|
| Sept. |
31.5
|
4.56
|
31.5
|
.71
|
.10
|
.71
|
-86
|
0
|
Annual mean discharge
and annual runoff |
43.6
|
47.2
|
28.5
|
12.05
|
13.05
|
7.07
|
|
Percent difference
from long-term annual mean |
|
|
8
|
-35
|
return to top
|