Scientific Investigations Report 2007-5084
| Nutrients and Chlorophyll a
Concentrations of total nitrogen, nitrate, total phosphorus, and chlorophyll a are primary indicators of nutrient enrichment in streams (U.S. Environmental Protection Agency, 2000), and samples for these constituents were collected at all Phase II sites during each site visit. The USEPA has established proposed nutrient criteria for the continental U.S.; these criteria are specific to regional areas, or ecoregions. Ecoregions are defined as areas of similar natural geographic characteristics and land-use patterns, and include geology, physiography, vegetation, climate, soils, wildlife, and hydrology. Ecoregions can be defined at multiple scales. For example, there are 14 Nutrient ecoregions and 84 Level III ecoregions in the conterminous United States; Nutrient ecoregions are aggregations of Level III ecoregions where the characteristics affecting nutrient levels are expected to be similar. Nutrient ecoregions can form the basis for initial development of nutrient criteria, however small-scale variability and accuracy may be lost during the aggregation of data for these large areas. Level III ecoregions are smaller and more homogenous; therefore Level III criteria can provide more accurate reference conditions for smaller-scale studies. Additionally, the USEPA encourages states and authorized tribes to further subdivide these regions and establish more refined criteria where possible. The MMSD planning area is located in Nutrient Ecoregion VII and Level III Ecoregion 53; the USEPA criteria for these ecoregions are defined in table 13 (U.S. Environmental Protection Agency, 2000). These criteria are the USEPA’s recommendations to states and authorized tribes for use in establishing their water-quality standards consistent with section 303(c) of the Clean Water Act (U.S. Environmental Protection Agency, 2000), and reflect estimated nutrient concentrations in reference streams from these areas. Nutrient Ecoregion VII is the “mostly glaciated dairy region” that includes the southern two-thirds of Wisconsin and Michigan and parts of Minnesota, Illinois, Indiana, Ohio, Pennsylvania, and New York (U.S. Environmental Protection Agency, 2000). Level III Ecoregion 53, the “Southeastern Wisconsin Till Plains,” includes the area northward from the Wisconsin-Illinois border to Green Bay, Wis., and stretches eastward from central Wisconsin to Lake Michigan. Additional reference concentrations for total nitrogen, total phosphorus, and chlorophyll a have been defined for wadeable Wisconsin streams by Robertson and others (2006), and are included to provide another benchmark for assessing water-quality. Table 13. Estimated nutrient concentrations in reference streams for the area encompassing the Milwaukee Metropolitan Sewerage District planning area, Wis. [mg/L, milligram per liter; µg/L, microgram per liter; --, not determined]
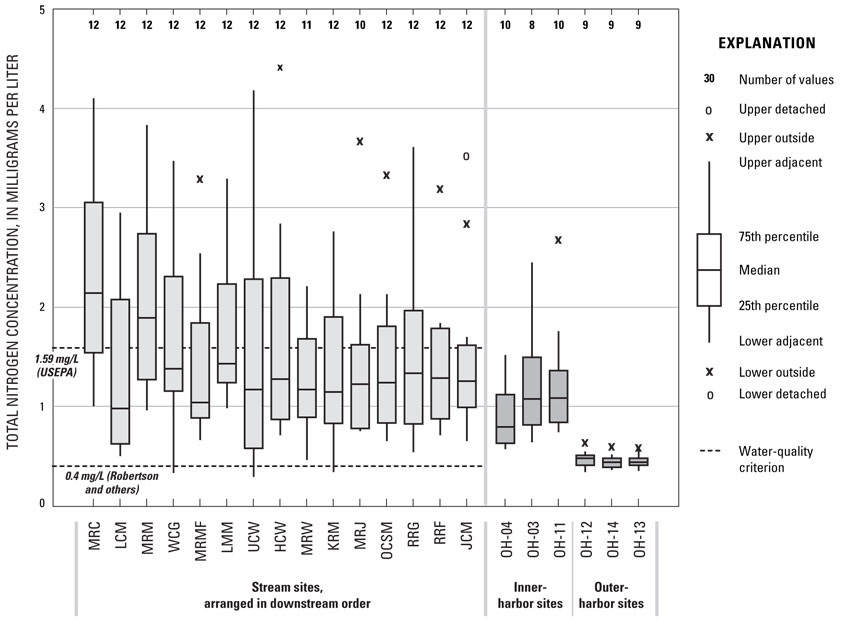
Whereas concentrations of nutrients and chlorophyll a at stream sites could be compared against the USEPA criteria, concentrations of total phosphorus and chlorophyll a at harbor sites can be compared against ranges for trophic classes; trophic classes are a traditional system for describing the water quality of lakes as oligotrophic (low nutrient concentrations, low algal populations), mesotrophic (moderate nutrient concentrations, prone to moderate algal blooms), and eutrophic (high nutrient concentrations, prone to frequent seasonal algal blooms). The trophic state index (TSI) was developed to allow for lake classification according to concentrations of total phosphorus, chlorophyll a, and Secchi depth (Carlson, 1977). TSI values of 40 and 50 bound the range of concentrations indicating mesotrophic conditions. Corresponding concentrations of total phosphorus (0.012–0.024 mg/L) and chlorophyll a (2.60–7.20 µg/L) were used to classify observed sample concentrations from harbor sites. Total nitrogen concentrations in streams sampled in Phase II ranged from 0.30 to 4.44 mg/L with a median concentration of 1.33 mg/L. The median concentration was less than the USEPA proposed criterion of 1.59 mg/L for total nitrogen in Level III Ecoregion 53 (table 13) (U.S. Environmental Protection Agency, 2000). At Milwaukee River near Cedarburg (2.14 mg/L) and Milwaukee River at Milwaukee (1.89 mg/L), median concentrations were greater than the USEPA criterion. For the remaining streams, median concentrations ranged from 0.98 to 1.43 mg/L, all of which were greater than the reference concentration of 0.4 mg/L proposed by Robertson and others (2006). The maximum total nitrogen concentration, 4.44 mg/L, was measured at Honey Creek during the snowmelt sampling event in March 2004 (fig. 11). Land use did not correlate appreciably with total nitrogen throughout the MMSD planning area. Figure 11. Distribution of total nitrogen concentrations, by site, in the Milwaukee Metropolitan Sewerage District planning area, Wis. Water-quality criteria lines represent the U.S. Environmental Protection Agency proposed nutrient criterion for total nitrogen in Level III Ecoregion 53 streams (1.59 mg/L) (U.S. Environmental Protection Agency, 2000) and the reference concentration for wadeable Wisconsin streams (0.4 mg/L), as defined by Robertson and others (2006). Site abbreviations listed in table 1. Median concentrations of total nitrogen at all stream samples were notably higher during high flow (2.02 mg/L) than during low flow (1.13 mg/L) (fig. 12A). Notable seasonality also was evident in total nitrogen concentrations. Highest median and greatest variability occurred during spring (1.98 mg/L) and winter (2.05 mg/L) (figure 12B). Median total nitrogen concentrations measured during spring high flow (2.12 mg/L) were higher than those measured during spring low flow (1.47 mg/L). Winter median concentrations measured during high flow (2.16 mg/L) were also higher than those measured during winter low flow (1.29 mg/L) (fig. 12C). Figure 12. Distributions of total nitrogen concentrations for stream and harbor samples, Milwaukee Metropolitan Sewerage District planning area, Wis. Stream sample distributions are grouped by flow (A), season (B), and flow and season combined (C). Harbor-sample distributions are grouped by season only (D) (no harbor samples were collected in winter). Water-quality criteria lines represent the U.S. Environmental Protection Agency proposed nutrient criterion for total nitrogen in Level III Ecoregion 53 streams (1.59 mg/L) (U.S. Environmental Protection Agency, 2000), and the reference concentration for Wisconsin wadeable streams (0.4 mg/L), as defined by Robertson and others (2006). Data were available for Phase I and Phase II nitrogen concentration comparisons at 11 sites (appendix 5). Median total nitrogen concentrations at five of those sites decreased from Phase I to Phase II; among these sites, percent differences ranged from -21 percent at Lincoln Creek to -57 percent at Little Menomonee River. Honey Creek was the only site with a notable increase from Phase I to Phase II (288 percent difference). At the remaining five sites, no notable differences were observed from Phase I to Phase II (fig. 13). Figure 13. Phase I and Phase II comparison of median total nitrogen concentrations in the Milwaukee Metropolitan Sewerage District (MMSD) planning area, Wis. Phase I values are shown by subwatershed values and quartiles, Phase II values are shown by site using the same quartile. Site abbreviations listed in table 1. Total nitrogen concentration in harbor samples ranged from 0.35 to 2.71 mg/L. Harbor samples had a notably lower overall median concentration (0.63 mg/L) than stream samples did (1.33 mg/L). Inner-harbor sites had higher median concentrations (0.79–1.08 mg/L) than outer-harbor sites (0.44–0.48 mg/L). Harbor samples collected in spring had the highest median concentration (0.91 mg/L) and were the most variable (fig. 12D). Nitrate3 concentrations in streams sampled in Phase II ranged from 0.060 to 3.48 mg/L, with an overall median of 0.560 mg/L. At the Milwaukee River sites, median concentrations were greater than the USEPA proposed criterion of 0.94 mg/L for nitrate in Level III Ecoregion 53 (table 13) (U.S. Environmental Protection Agency, 2000): Milwaukee River near Cedarburg (1.40 mg/L) and Milwaukee River at Milwaukee (1.17 mg/L). The remaining medians ranged from 0.270 to 0.860 mg/L. The maximum nitrate concentration, 3.48 mg/L, was measured at Honey Creek during the snowmelt sampling in March 2004 (fig. 14). Land use did not correlate appreciably with nitrate concentrations. 3 Because nitrite generally makes up a negligible proportion of nitrite plus nitrate in stream water, this combined constituent is referred to simply as “nitrate” in this report. Concentrations are reported as nitrogen (N). Figure 14. Distribution of nitrate concentrations, by site, in the Milwaukee Metropolitan Sewerage District planning area, Wis. Water-quality criterion line represents the U.S. Environmental Protection Agency proposed nutrient criterion for nitrate in Level III Ecoregion 53 streams (0.94 mg/L) (U.S. Environmental Protection Agency, 2000). Site abbreviations listed in table 1. The median concentration of nitrate in stream samples was notably higher during high flow (0.950 mg/L) than during low flow (0.480 mg/L) (fig. 15A–C). Median concentrations in spring (0.870 mg/L) and winter (1.10 mg/L) were higher than those in summer and autumn and also were more variable. The spring high-flow median (1.03 mg/L) was higher than the spring low-flow median (0.700 mg/L); however, concentrations were highly variable at both extremes of flow. The winter high-flow median (1.14 mg/L) was higher than the winter low-flow median (0.930 mg/L); however, the variability in winter low-flow was greater than in winter high-flow. Figure 15. Distributions of nitrate concentrations for stream and harbor samples, Milwaukee Metropolitan Sewerage District planning area, Wis. Stream sample distributions are grouped by flow (A), season (B), and flow and season combined (C). Harbor-sample distributions are grouped by season only (D) (no harbor samples were collected in winter). Water-quality criterion line represents the U.S. Environmental Protection Agency proposed nutrient criterion for nitrate in Level III Ecoregion 53 streams (0.94 mg/L) (U.S. Environmental Protection Agency, 2000). Data were available for Phase I and Phase II nitrate concentration comparisons at 12 sites (appendix 5). At five sites, median nitrate concentrations increased from Phase I to Phase II; the most notable differences were at Underwood Creek (which had no concentrations above the reporting level (0.02 mg/L as N) in the five samples summarized for Phase I and a median concentration of 0.410 mg/L in samples collected for Phase II) and Little Menomonee River (5,350 percent difference). Percent differences among the remaining three sites that indicated notable increases ranged from 256 percent at Honey Creek to 735 percent at Jewel Creek. Only two sites had notable decreases in nitrate concentrations: Menomonee River at Menomonee Falls (-42 percent) and Lincoln Creek (-41 percent) (fig. 16). The remaining five sites indicated no notable change. Figure 16. Phase I and Phase II comparison of median nitrate concentrations in the Milwaukee Metropolitan Sewerage District (MMSD) planning area, Wis. Phase I values are shown by subwatershed values and quartiles, Phase II values are shown by site using same quartile. Site abbreviations listed in table 1. Nitrate concentrations in harbor samples ranged from 0.180 to 1.95 mg/L. The overall median concentration for harbor samples (0.360 mg/L) was lower than that for stream samples (0.560 mg/L). Inner-harbor sites had higher median concentrations (0.400–0.490 mg/L) than outer-harbor sites did (0.240–0.260 mg/L). Spring harbor samples had the highest median concentration (0.490 mg/L) and the most variability (fig. 15D). Total phosphorus concentrations in Phase II streams ranged from 0.009 to 0.500 mg/L; the overall median was 0.111 mg/L, which is above the USEPA proposed criterion of 0.08 mg/L for total phosphorus in Level III Ecoregion 53 (table 13) (U.S. Environmental Protection Agency, 2000). Of the 15 stream sites, 11 had median concentrations greater than the USEPA criterion: Lincoln Creek (0.163 mg/L), Little Menomonee River (0.152 mg/L), Honey Creek (0.150 mg/L), Kinnickinnic River (0.148 mg/L), Milwaukee River at Milwaukee (0.133 mg/L), Milwaukee River near Cedarburg (0.120 mg/L), Menomonee River at Wauwatosa (0.113 mg/L), Root River at Grange Avenue (0.113 mg/L), Menomonee River at Menomonee Falls (0.100 mg/L), Root River near Franklin (0.092 mg/L), and Underwood Creek (0.085 mg/L). Medians for the remaining four sites ranged from 0.062 to 0.079 mg/L, all of which were above the reference concentration of 0.03–0.04 mg/L proposed by Robertson and others (2006). The maximum total phosphorus concentration, 0.500 mg/L, was measured in Lincoln Creek (fig. 17). Land use did not correlate appreciably with total phosphorus. Figure 17. Distribution of total phosphorus concentrations, by site, in the Milwaukee Metropolitan Sewerage District planning area, Wis. Stream water-quality criterion lines represent the U.S. Environmental Protection Agency proposed nutrient criterion for total phosphorus in Level III Ecoregion 53 streams (0.08 mg/L) (U.S. Environmental Protection Agency, 2000) and the reference concentrations for wadeable Wisconsin streams (0.03–0.04 mg/L) as defined by Robertson and others (2006). Labels for harbor trophic class boundaries (0.012 mg/L and 0.024 mg/L) are marked with an asterisk (*); boundaries delineate trophic classes (oligotrophic, mesotropic, eutrophic) for lakes as defined by Carlson (1977). Site abbreviations listed in table 1. The median total phosphorus concentration during high flow (0.136 mg/L) was higher than that during low flow (0.098 mg/L) (fig. 18A–C). Variability with respect to season was not observed. When flow and season were looked at together, no further patterns were observed. Figure 18. Distributions of total phosphorus concentrations for stream and harbor samples, Milwaukee Metropolitan Sewerage District planning area, Wis. Stream sample distributions are grouped by flow (A), season (B), and flow and season combined (C). Harbor-sample distributions are grouped by season only (D) (no harbor samples were collected in winter). Stream water-quality criterion lines represent the U.S. Environmental Protection Agency proposed nutrient criterion for total phosphorus in Level III Ecoregion 53 streams (0.08 mg/L) (U.S. Environmental Protection Agency, 2000) and the reference concentrations for wadeable Wisconsin streams (0.03–0.04 mg/L) as defined by Robertson and others (2006). Labels for harbor trophic class boundaries (0.012 mg/L and 0.024 mg/L) are marked with an asterisk (*); boundaries delineate trophic classes (oligotrophic, mesotropic, eutrophic) for lakes as defined by Carlson (1977). Data were available for Phase I and Phase II total phosphorus concentration comparisons at 11 sites (appendix 5). At six sites, median total phosphorus concentrations increased from Phase I to Phase II. Percent differences ranged from 32 percent at Oak Creek to 1,420 percent at Little Menomonee River (fig. 19). The remaining five sites indicated no notable differences. Figure 19. Phase I and Phase II comparison of median total phosphorus concentrations in the Milwaukee Metropolitan Sewerage District (MMSD) planning area, Wis. Phase I values are shown by subwatershed values and quartiles, Phase II values are shown by site using same quartile. Site abbreviations listed in table 1. Total phosphorus concentrations at harbor sites ranged from 0.002 to 0.095 mg/L. The overall median concentration for harbor samples (0.021 mg/L) was lower than that for stream samples (0.111 mg/L), and is within the range of concentrations indicative of mesotrophic lake conditions (0.012–0.024 mg/L) (Carlson, 1977). Concentrations at inner-harbor sites were indicative of eutrophic conditions and had higher median concentrations (0.032–0.048 mg/L) than did outer-harbor sites, where median concentrations were close to the reporting level for total phosphorus (0.004 mg/L), and were indicative of oligotrophic conditions (fig. 17). Spring harbor samples had the highest median concentration (0.028 mg/L) and indicated the greatest variability (fig. 18D). Loads, Yields, and Volumetrically Weighted Concentrations of Total Phosphorus Total phosphorus loads for June through September 2004 ranged from 4,980 lb at the Kinnickinnic River site to 98,200 lb at the Milwaukee River at Milwaukee site (table 14). VW concentrations ranged from 0.15 mg/L at Milwaukee River near Cedarburg and Menomonee River at Wauwatosa to 0.27 mg/L at Kinnickinnic River at Milwaukee. In water year 2005, the total phosphorus load ranged from 8,840 lb at Kinnickinnic River to 113,000 lb at Milwaukee River at Milwaukee. VW concentrations ranged from 0.13 mg/L at Menomonee River at Wauwatosa to 0.26 mg/L at Kinnickinnic River. Table 14. Annual total phosphorus load and yield, average daily phosphorus yield, total water flow, and volumetric total phosphorus concentrations for four Phase II sites in the Milwaukee Metropolitan Sewerage District planning area, Wis. [lbs, pounds; lb/mi2, pound per square mile; lb/mi2/d, pound per square mile per day; ft3/s, cubic foot per second; mg/L, milligram per liter; values in bold are for complete water years]
Total phosphorus yields for the complete water year 2005 ranged from 144 lb/mi2 at Milwaukee River near Cedarburg to 470 lb/mi2 at Kinnickinnic River at (table 14). The median total phosphorus yield for rural watersheds in the Southeastern Wisconsin Till Plains Ecoregion was 283 lb/mi2, and the range was 40.7 to 1,800 lb/mi2 (Corsi and others, 1997). Within the two predominantly rural drainage basins, the Milwaukee River near Cedarburg and the Milwaukee River at Milwaukee sites had total phosphorus yields of 144 lb/mi2 and 162 lb/mi2, respectively. These yields were less than the median, but within the range of total phosphorus yields measured in the Ecoregion (Corsi and others, 1997). The median total phosphorus yield for urban watersheds in the Southeast Wisconsin Till Plains Ecoregion was 318 lb/mi2, and the range was 133 to 1,210 lb/mi2 (Corsi and others, 1997). The Kinnickinnic River drainage basin had a yield of 470 lb/mi2, which was greater than the median yield in the Ecoregion. The total phosphorus yield for the Menomonee River drainage basin was less than yields at similar urban sites but within the range of monitored yields. Total phosphorus loads indicated a seasonal pattern at Milwaukee River near Cedarburg and Milwaukee River at Milwaukee in water year 2005, with higher loads generally being recorded February through May (table 15). No seasonal response in loads was observed at Menomonee River at Wauwatosa and Kinnickinnic River during water year 2005. The greatest monthly loads of total phosphorus for data collected in 2004 were recorded in June at all sites except Kinnickinnic River, where greatest monthly loads were recorded in August. Table 15. Monthly and annual total phosphorus loads for four Phase II sites in the Milwaukee Metropolitan Sewerage District planning area, Wis., for water years 2004 and 2005. [WY, water year]
Chlorophyll a concentrations in Phase II streams ranged from 0.260 to 170 µg/L; the median was 5.79 µg/L, which is at the USEPA proposed criterion for cholorophyll a in Nutrient Ecoregion VII (table 13) (U.S. Environmental Protection Agency, 2000). Median concentrations were greater than the USEPA criterion at the following seven sites: Milwaukee River near Cedarburg (13.4 µg/L), Jewel Creek (10.3 µg/L), Milwaukee River at Milwaukee (10.2 µg/L), Menomonee River at Menomonee Falls (8.45 µg/L), Menomonee River at Wauwatosa (7.80 µg/L), Honey Creek (6.76 µg/L), and Little Menomonee River (5.96 µg/L). At the remaining sites, median concentrations ranged from 1.34 to 5.34 µg/L, all of which were above the reference condition of 1.0 µg/L proposed by Robertson and others (2006). The maximum chlorophyll a concentration, 170 µg/L, was measured in Underwood Creek (fig. 20). Land use did not correlate appreciably with chlorophyll a. Figure 20. Distribution of chlorophyll a concentrations, by site, in the Milwaukee Metropolitan Sewerage District planning area, Wis. Stream water-quality criterion lines represent the U.S. Environmental Protection Agency proposed nutrient criterion for chlorophyll a in Nutrient Ecoregion VII (5.8 µg/L) (U.S. Environmental Protection Agency, 2000) and the reference concentration for wadeable Wisconsin streams (1.0 µg/L) as defined by Robertson and others (2006). Labels for harbor trophic class boundaries (2.6 µg/L and 7.2 µg/L) are marked with an asterisk (*); boundaries delineate trophic classes (oligotrophic, mesotropic, eutrophic) for lakes as defined by Carlson (1977). Site abbreviations listed in table 1. The median concentration of chlorophyll a in stream samples during high flow (7.98 µg/L) was higher than during low flow (4.96 µg/L). The highest median concentration (10.7 µg/L) was observed in spring samples; these samples also indicated the greatest variability in concentrations. The summer high-flow median (7.50 µg/L) was higher than the summer low-flow median (4.62 µg/L), whereas spring high- and low-flow medians were similar (11.6 and 9.98 µg/L, respectively) (fig. 21A–C). Figure 21. Distributions of chlorophyll a concentrations for stream and harbor samples, Milwaukee Metropolitan Sewerage District planning area, Wis. Stream sample distributions are grouped by flow (A), season (B), and flow and season combined (C). Harbor-sample distributions are grouped by season only (D) (no harbor samples were collected in winter). Stream water-quality criterion lines represent the U.S. Environmental Protection Agency proposed nutrient criterion for chlorophyll a in Nutrient Ecoregion VII (5.8 µg/L) (U.S. Environmental Protection Agency, 2000) and the reference concentration for wadeable Wisconsin streams (1.0 µg/L) as defined by Robertson and others (2006). Labels for harbor trophic class boundaries (2.6 µg/L and 7.2 µg/L) are marked with an asterisk (*); boundaries delineate trophic classes (oligotrophic, mesotropic, eutrophic) for lakes as defined by Carlson (1977). Data were available for Phase I and Phase II chlorophyll a concentration comparisons at seven sites (appendix 5). Two notable increases were observed at Menomonee River at Menomonee Falls (49 percent difference) and Menomonee River at Wauwatosa (30 percent difference), whereas one notable decrease was observed at Root River near Franklin (-34 percent difference). The remaining four sites indicated no notable differences. Chlorophyll a concentrations in harbor samples ranged from 0.260 to 31.5 µg/L. The overall median for harbor samples (1.82 µg/L) was lower than that for stream samples (5.79 µg/L); in addition, it was less than the range of concentrations indicative of mesotrophic lake conditions (2.60–7.20 µg/L) and were therefore indicative of oligotrophic conditions (Carlson, 1977). Concentrations at inner-harbor sites were indicative of mesotrophic conditions and had higher median concentrations (4.38–5.70 µg/L) than outer-harbor sites (0.830–1.09 µg/L), where median concentrations were indicative of oligotrophic conditions. Summer harbor samples had the highest median concentration (3.35 µg/L) and indicated the most variability (fig. 21D). return to top |
||||||||||||||||||||||||||||||||||||||||||||||||||||||||||||||||||||||||||||||||||||||||||||||||||||||||||||||||||||||||||||||||||||||||||||||||||||||||||||||||||||||||||||||||||||||||||||||||||||||||||||||||||||||||||||||||||||

![]() U.S. Department of the Interior |
U.S. Geological Survey
U.S. Department of the Interior |
U.S. Geological Survey
URL: https://pubsdata.usgs.gov/pubs/sir/2007/5084/page6.html
Page Contact Information: USGS Publishing Network
Page Last Modified: Thursday, 01-Dec-2016 19:59:16 EST


 planning area, Wis.")


 planning area, Wis.")

