Scientific Investigations Report 2007–5164
U.S. GEOLOGICAL SURVEY
Scientific Investigations Report 2007–5164
Turbidity data and samples for suspended-sediment concentrations were collected from streamflow-gaging stations (Rantz and others, 1982; Edwards and Glysson, 1999; Wagner and others, 2006) as indicated in table 1. Records for continuous turbidity were longer for two stations on the South Fork McKenzie River because those turbidimeters were installed during 2000, prior to the construction and drawdown at Cougar Reservoir. Turbidimeters were installed at the other three stations in January 2003, resulting in relatively complete data sets for water years 2003–04 but no data during the initial drawdown period at those stations.
Turbidity was monitored according to standard USGS protocols (Wagner and others, 2006). All turbidimeters installed in the McKenzie River basin used near-infrared light sources, with a single detector at 90 degrees to the incident light beam. On the basis of this configuration, turbidity data are reported in Formazin Nephelometric Units (FNU), as specified for USGS (Anderson, 2004). This reporting unit provides traceability and specificity to the instruments used to make the measurements, helping to reduce uncertainty in data analysis. Although FNUs may be considered equivalent to the more traditional Nephelometric Turbidity Unit (NTU), direct comparison with data from instruments with optical configurations different from FNU should be done with caution and only if compatibility can be demonstrated among the instruments used. The turbidimeters used were SDI-12 compatible Analite© 395 probes from McVan Instruments Pty Ltd, except at the South Fork McKenzie River above Cougar Reservoir prior to 2003, when an analog Analite© 195 probe was used. The Analite© 195 and 395 probes differ only in signal processing but use identical optics so they provide data that are directly comparable. During sediment sampling, YSI 6920 Multiparameter Sondes equipped with model 6026 turbidity probes were used for instantaneous readings and cross-sectional profiling of turbidity. The 6026 probe also was manufactured by McVan Instruments, and recent work has shown a near 1:1 comparison between the Analite© 195 and YSI 6026 turbidity probes (H.M. Bragg, U.S. Geological Survey, unpub. data, 2004).
Turbidity data were recorded every 15 or 30 minutes, depending on the station. Except for data from the analog Analite© 195 probe, which were instantaneous readings, values were reported as the median of 100 readings during a period of about 1 minute. Signal processing in this manner, which is a feature of the Analite© probes used, helps to reduce the high variability that is common for turbidity data. For the purposes of estimating suspended-sediment concentrations, values during periods of missing data typically were estimated as the general, recent background value at the individual station, typically less than 1 FNU, unless changes in discharge or other information indicated the likelihood of increased turbidity. If increased turbidity was indicated where data were missing, turbidity values were not estimated. Turbidity records typically were greater than (>) 94 percent complete, except at BLUE. Most of the missing data from BLUE was during a 3-month period in late summer 2004 and was therefore not significant relative to sediment transport.
Samples for suspended-sediment concentration (SSC) were collected using standard USGS methods for depth- and width-integrated (EWI) sampling (Edwards and Glysson, 1999), except where otherwise noted. Samples were collected from cableways, if available, or otherwise from bridges, by using a USGS D-74 sediment sampler with pint glass bottles, suspended with a B-reel (Edwards and Glysson, 1999). Cableways were used at CGRO, BLUE, and VIDA, whereas bridges were used at MRBO and SFCO; a bridge about 1.5 mi downstream of CGRO also was used on occasion. SSC samples were analyzed at the USGS Sediment Laboratory in Vancouver, Washington. Samples were analyzed gravimetrically, and data reported in milligrams per liter of dried sediment and the percentage of SSC in the fine fraction, defined as having a median diameter less than (<) 0.063 mm.
In some cases, samples were collected by grab sampling, typically during storm events where conditions were rapidly changing and many sites were being sampled in a short amount of time. Grab sampling typically was accomplished by use of a weighted container holding a sample bottle and suspended by rope from a bridge. These samples typically approximated EWI sampling because they were collected from multiple locations in a transect across the bridge. Evaluation of SSC data from CGRO and BLUE indicated that the fraction of fine sediments typically was equal to or greater than 90 percent (medians 93 and 90 percent, respectively). Fine sediment typically does not settle rapidly in flowing water. Because of the high percentage of fine material, sediment concentrations in the cross sections were assumed to be well mixed, and the use of grab samples at CGRO and BLUE therefore was considered to be an acceptable method when time constraints prevented more thorough EWI sampling.
Regressions of SSC with turbidity (taken at the time of SSC sample collection) were calculated individually for each station. Regression equations are given as a power function in the format y=bxa, where y is SSC, in millgrams per liter, x is the reported instantaneous turbidity, in FNU, and b and a are regression coefficients. This is equivalent to an ordinary least-squares regression on the log-transformed values of SSC and turbidity. Such relations have been used increasingly as a means of predicting SSC from continuous turbidity probes (Christensen and others, 2000; Gray and Glysson, 2003; Uhrich and Bragg, 2003).
For each station, computed estimates of suspended-sediment load (SSL) were based on continuous turbidity and discharge records for individual sites. Regression equations (see above) for turbidity-SSC relations were used to compute SSC from the instantaneous turbidity values at each site, after correcting for transformation bias by using Duan’s smearing estimate (Helsel and Hirsch, 1992). For each regression, the model standard prediction error (MSPE) was calculated from the Mean Square Error (MSE) of the regression (Patrick P. Rasmussen and others, U.S. Geological Survey, written commun. 2007) as
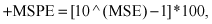 (1)
(1)
and
 (2)
(2)
The computed SSC, in milligrams of suspended sediment per liter, was multiplied by discharge for each 30-minute interval, with a unit conversion, to determine SSL for the respective intervals, in tons of sediment transported per day. The resulting 48 daily values of SSL were averaged to produce a daily mean estimate of SSL. Annual sediment load, in tons per year, was determined by summing the 365 daily mean estimates.
Using reconnaissance data collected by the U.S. Army Corps of Engineers (2003) on ΣDDx in exposed reservoir and streambank sediments, a coarse calculation was made to estimate the amount of suspended material needed in order to detect ΣDDx in transport, and thereby to estimate the minimum turbidity needed to be able to detect ΣDDx in the water column. The USEPA criterion for the protection of aquatic life for ΣDDx is 0.001 micrograms per liter (µg/L), which commonly is the analytical detection limit for many laboratories. The median ΣDDx concentration in bed sediment in the exposed reservoir and streambank sediments was 13.6 micrograms per kilogram (µg/kg) (U.S. Army Corps of Engineers, 2003). Therefore, and accounting for unit conversion,
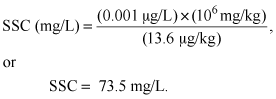 (3)
(3)
Using a preliminary equation for SSC as a function of turbidity from a lower basin site in the North Santiam River as a starting point, where turbidities generally are less than 200 FNU (H.M. Bragg, U.S. Geological Survey, written commun., 2002), a threshold turbidity value of about 100 FNU was used as a target for conditions that would trigger sampling for ΣDDx in suspended material. In order to increase detectability by increasing the mass of sediment analyzed, ΣDDx was analyzed separately from the suspended and dissolved phases for some samples.
In order to maintain clean sampling techniques, sampling for ΣDDx was conducted with Teflon® sampling equipment, which was cleaned as specified by Wilde (2004) for organic constituents. Depth- and width-integrated samples for suspended sediment were collected using a D-95 sampler (McGregor, 2000) equipped with a 1-L Teflon® bottle and Teflon® cap and nozzle assembly. Subsamples from individual verticals in the cross section were composited into 3-L Teflon® bottles, and stored on ice until they could be processed in the laboratory, a period of less than 8 hours. Additional 3-L Teflon® bottles for equipment rinses were filled by grab sampling at the side of the river, as necessary. In the laboratory, all 3-L Teflon® sample bottles for each site were composited into a 14-L Teflon® churn splitter (Horowitz and others, 2001), and whole-water (unfiltered) subsamples were drawn for SSC and suspended organic carbon. Subsequently, samples for organochlorine pesticides including ΣDDx were filtered directly from the churn splitter through baked glass-fiber filters (0.7-micron nominal pore size) housed in an aluminum filtration apparatus, using ceramic-piston metering pumps equipped with Teflon® tubing. The glass-fiber filters were retained for analysis of organochlorine pesticides in the suspended material, and the filtrate was collected into baked, amber glass, 1-L pesticide bottles, with the volume of water filtered noted. Dissolved organic carbon (DOC) was processed according to standard USGS protocols (Wilde and others, 1999; 2004). For some samples, whole-water samples were submitted for analysis when separation into dissolved and suspended partitions was not practical.
Laboratory analyses of ΣDDx in suspended sediment were performed by Severn-Trent Laboratory, in Seattle, Washington, in accordance with standard organochlorine analysis by U.S. Environmental Protection Agency (USEPA) SW-846 method 8081A. DOC was analyzed according to USEPA method SW-906. Quality-assurance data indicated acceptable data quality for organochlorine analysis, with nondetect values reported for all blank results (Method Detection Limit (MDL) = 0.0022 µg/L. For analysis of DOC, a field blank using certified, organic-free water in April 2003 was reported as 1.8 milligrams per liter (mg/L), with an MDL of 0.5 mg/L.
Infiltration bags were deployed in August 2003 in spawning gravels corresponding to each of the discharge- and turbidity-monitoring stations (table 1), and retrieved in July 2004. Bags were deployed in triplicate, arranged at least 5–7 ft apart in a direction orthogonal to surface flow lines at the individual site to avoid interactions of sediment dynamics between the individual bags. Sites were selected with assistance from fishery biologists from Oregon State Department of Fish and Wildlife, and on the basis of known spawning use by salmonids, with observable downwelling, moderate flow velocity, and for their relatively shallow overlying water depth. Shallow water (4–10 cm) was desired during low flow to minimize loss of fine sediment upon retrieval.
The bags were constructed and deployed following the general dimensions provided by Lisle and Eads (1991), modified to allow for analysis of ΣDDx from the retrieved sample and to reduce erosion of surficial fine sediments by turbulence from overlying water during retrieval. Bags were made from a laminated vinyl fabric (14 mil), glued into a cylindrical shape (diameter 30 cm, height 56 cm, total volume 39.6 L) using a vinyl adhesive (HH-6, RH Products, Acton, MA), with a metal hoop in the mouth to help the bag retain its cylindrical form. A 4-mil Teflon® bag (19.8 liter) was riveted into each infiltration bag to provide a clean interior for ΣDDx sampling. The infiltration bags were supported with nylon webbing straps, riveted at the mouth, bottom edges, and underneath, to hold the weight of river rocks and water when retrieved. Cables (1/8-inch steel, approximately 31 inches or 80 cm long) were attached to loops in the nylon webbing near the mouth of the bag for retrieval (fig. 4A).
Prior to deployment of infiltration bags, the depth of water overlying the sediment was measured. Deployment involved the excavation of a 40-cm-deep hole in the streambed from inside an open, solid cylindrical form (fig. 4B).
To characterize the native bed material at each site, all surface rocks down to the armored layer were carefully removed and the diameter (intermediate-axis length) measured. Near-surface rocks (including sand) were carefully extracted or shoveled into a bucket for later laboratory analysis of size fraction. Median diameters for native surface rocks among all sites ranged from about 3 to 7 cm. This method did not, however, adequately capture or characterize native fine material in the bed, which was susceptible to resuspension and export during the digging process. Background stream turbidity was less than 1 FNU at all sites at the time of deployment. After excavating the hole, the water was allowed to clear (5–10 minutes), at which point the bag was placed collapsed in the bottom of the hole with cables extending beyond the opening of the cylindrical form (fig. 4C). Experimental gravel (median diameter 5.0 cm), which had been vigorously cleaned of fine materials using stream water immediately prior to deployment, was placed in the form on top of the collapsed bag and refilled to the original level of the streambed. Final depth of overlying water inside the form was measured, and then the form removed vertically, leaving the collapsed infiltration bag buried in place under 40 cm of experimental gravel (fig. 4D). The exposed lengths of the retrieval cables also were measured to allow estimation of aggradation or scour upon retrieval. To help locate the bags upon retrieval, all bag locations were mapped and global positioning system coordinates recorded.
Infiltration bags were extracted from the streambed during July 2004. Retrieval of the infiltration bags was accomplished by the use of a large tripod equipped with a winch, after initial measurements of the depth of overlying water and careful removal, measurement (intermediate axis length), and retention of any large cobbles or boulders that had been moved over the buried bags. The winch was connected to the four exposed retrieval cables for each bag, and hoisted slowly until the streambed began to visibly deform. Once deformation or erosion was visible, the cables were rapidly hoisted until the mouth of the bag extended beyond the sediment surface, whereupon it was immediately grabbed and the bag pulled up enough for the mouth to break the surface of the water to prevent erosion of surficial layers. At this point, it was considered a stable sample. The bag was subsequently pulled gently from the streambed, with the exterior rinsed to remove additional fine materials, and emptied into a large stainless steel receptacle that had been precleaned according to Wilde (2004). The initial depth of water in the receptacle was noted for calculations of the volume of bed material and overlying streamwater removed with the infiltration bag. The Teflon® liner was removed from the bag and carefully rinsed into the receptacle with certified organic-free water. Individually, each rock was removed from the receptacle, rinsed into it with organic-free water, and set aside for size analysis. Upon removal of all gravel-size and larger rocks, the remaining sediment was sieved to retain coarse silt and larger-sized particles (>0.063 mm) and removed for size-fraction analysis (fig. 5). The volume of all organic-free water used to rinse rocks or other sampling apparatus into the receptacle was carefully noted, as was the final depth of water in the stainless steel receptacle for final calculations of volume. Streamwater overlying the infiltration bags also was sampled (prior to extraction) for concentrations of suspended sediment, organic carbon, and organochlorine compounds.
The remaining slurry, consisting of pore water, surface water, organic-free water, and fine streambed sediment was transferred to a Teflon® churn splitter for subsampling. Whole-water subsamples were taken from the churn splitter for analysis of SSC, dissolved and suspended organic carbon (Wilde and others, 2004), and organochlorine compounds, including ΣDDx, in both water and sediment, and the samples were chilled until they could be shipped to a laboratory.
Initially, ΣDDx was to be analyzed by filtering the slurry through a baked glass-fiber filter (0.7-µm pore size), and submitting both the filter with caked sediment and filtrate for separate analyses; however, the slurry was too thick to filter. Instead, whole-water samples in 1-liter (L) baked amber glass (GCC) bottles were submitted for analysis with the intention that the high sediment concentrations in the slurry would facilitate detection; however, an apparent laboratory contamination rendered these whole-water results unusable. Ultimately, archived 1-L samples of the slurry in GCC bottles were submitted to the laboratory (Severn-Trent, Seattle, Wash.), where they were centrifuged to separate sediment from water and analyzed in accordance with USEPA SW-846 method 8081A. The resulting supernatant water was analyzed according to USEPA SW-846 method 3510C, and fine sediment according to USEPA SW-846 method 3550B. These archived samples were about 5 months old when submitted to the laboratory and therefore exceeded the accepted holding time for the method; however, they had been refrigerated since sampling, and degradation of organochlorine compounds in the archived samples during holding was believed to be minimal so analysis was still worthwhile. This extended holding time is considered for all interpretations of results for the organochlorine analyses from infiltration bags.
The mass of fine sediment (Fb) and percentage of fine sediment (F%) with diameter < 0.063 mm that accumulated in infiltration bags was calculated as
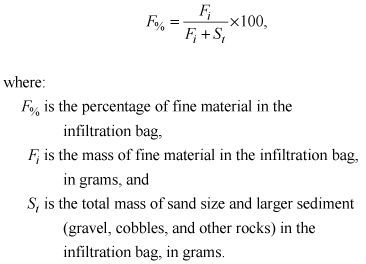 (4)
(4)
In turn,
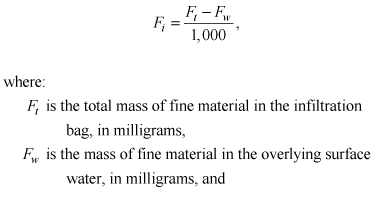 (5)
(5)
 (6)
(6)
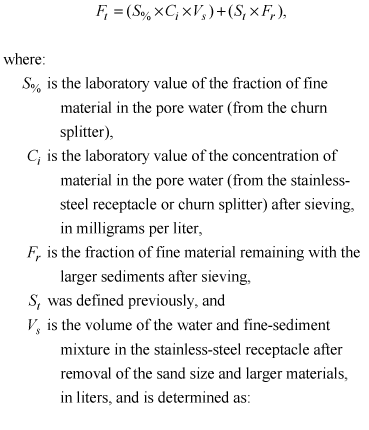
 (7)
(7)
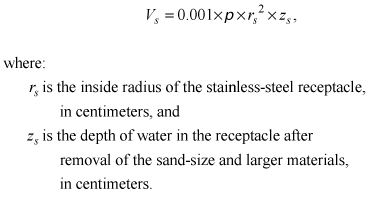
Furthermore:
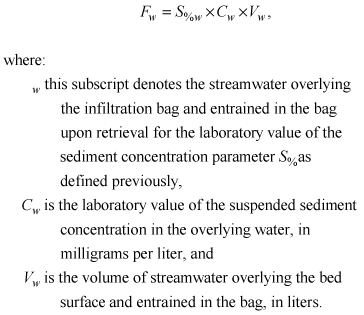 (8)
(8)
Vw is determined as
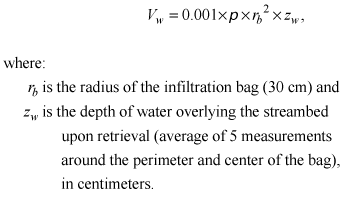 (9)
(9)
Calculations for ΣDDx in the infiltration bags were performed as follows:
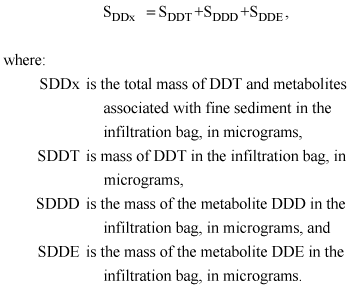 (10)
(10)
The masses of DDT and its metabolites are determined from the reported aquatic concentrations for each species, as:
 (11)
(11)
where:
[DDT]i and [DDT]w are the concentrations of the DDT species from the centrifuged sample of sediment, as submitted to the laboratory in 1-L bottles from the churn splitter, in micrograms per kilogram and in overlying water upon retrieval, respectively, and similar calculations are made for each of the other DDT species (DDD and DDE). Fi and Fw are as previously defined. In all cases, the concentrations of DDT or metabolites in the overlying water were nondetectable, and the Fw * [DDT]w term therefore became negligible.
The overall Method Detection Limit (MDL) for ΣDDx is determined by the sum of the laboratory-determined MDLs for individual DDx species.

![]() U.S. Department of the Interior | U.S. Geological Survey
U.S. Department of the Interior | U.S. Geological Survey
URL: https://pubs.usgs.gov/sir/2007/5164
Page Contact Information: Publications Team
Page Last Modified: Thursday, 01-Dec-2016 19:49:39 EST
